Aggregate gradation is the particle size distribution of the aggregate blend in asphalt or concrete, determined by sieve analysis. Gradation controls mixture density, workability, strength, and durability. Well-graded, gap-graded, and open-graded distributions produce different pavement performance characteristics. Covers gradation specifications, sieve sizes, gradation charts, and relationship to pavement distress.
Aggregate Gradation in Pavement Materials
Definition and Importance of Aggregate Gradation
Aggregate gradation refers to the distribution of particle sizes within a sample of aggregate used in pavement construction. It quantifies what proportions of an aggregate blend fall into each size fraction, from coarse particles larger than 25 mm down to mineral dust passing the 0.075 mm (No. 200) sieve. Gradation is expressed numerically as the cumulative percentage of material passing each standard sieve size, reported in tabular form and plotted graphically on a gradation chart.
Aggregate gradation is arguably the single most influential aggregate characteristic governing how a pavement material will perform in service. In hot-mix asphalt (HMA) pavements, gradation directly controls stiffness, stability, durability, permeability, workability, fatigue resistance, frictional resistance, and moisture susceptibility (Roberts et al., 1996). Every major performance property of an asphalt mixture is modulated by how the aggregate particles fit together. A gradation that is too fine may produce a mix that ruts under traffic; one that is too coarse may segregate during placement and resist compaction.
In portland cement concrete (PCC) pavements, gradation exerts similar influence over durability, porosity, workability, cement and water requirements, compressive strength, and shrinkage behavior. Well-graded aggregates in PCC reduce the void space that must be filled with expensive cement paste, lowering material costs while improving dimensional stability. Poorly graded aggregates increase water demand, which raises the water-cement ratio and degrades both strength and durability.
For base and subbase courses in pavement structures, gradation determines drainage characteristics, frost susceptibility, and load-bearing capacity. Even small percentages of material passing the 0.075 mm sieve can dramatically reduce permeability, turning a free-draining base course into a water-retaining layer prone to frost damage.
Because of its fundamental importance, gradation is a primary control parameter in all major mix design methods — including Superpave, Marshall, Hveem, and ACI concrete mix design. Transportation agencies worldwide, including the Federal Highway Administration (FHWA), Federal Aviation Administration (FAA), and International Civil Aviation Organization (ICAO), specify allowable gradation ranges for virtually every pavement layer.
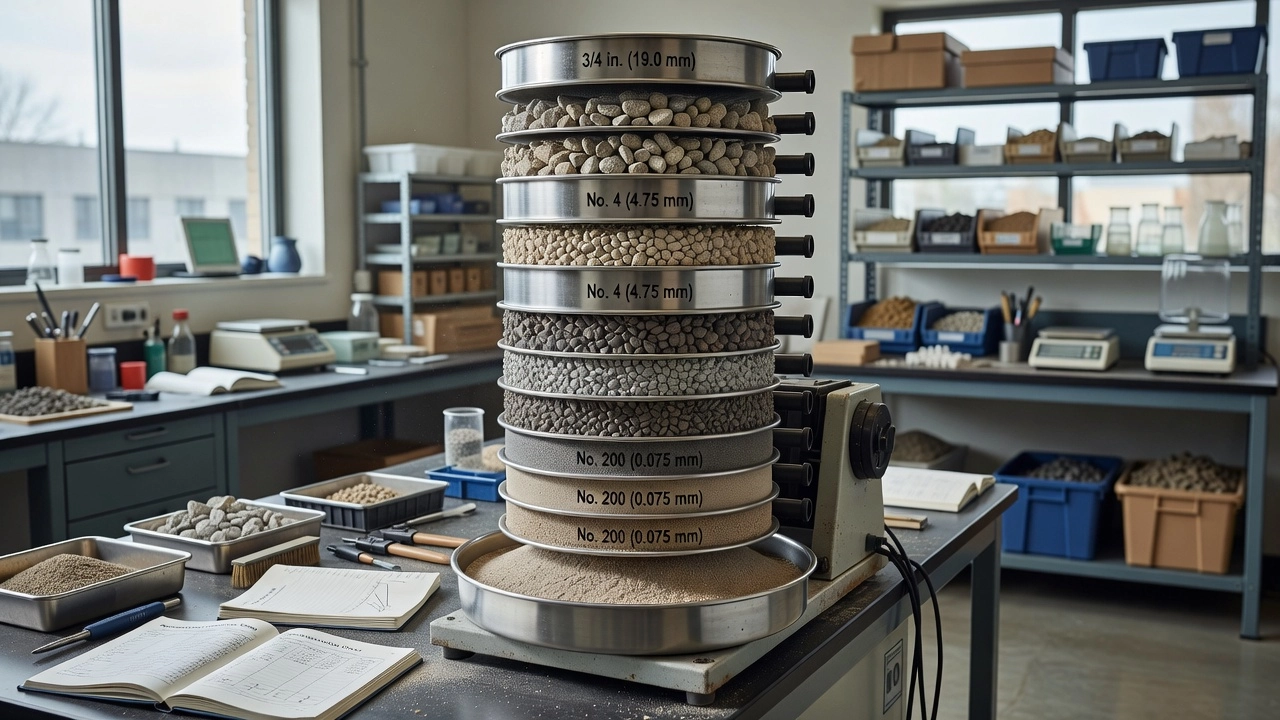
Sieve Analysis Procedure (ASTM C136 / AASHTO T 27)
The standardized method for determining aggregate gradation is the sieve analysis test, codified as ASTM C136 — Standard Test Method for Sieve Analysis of Fine and Coarse Aggregates — and its AASHTO equivalent, AASHTO T 27. This test provides the foundational data from which all gradation parameters are derived.
Test Procedure
The procedure begins with obtaining a representative aggregate sample of sufficient mass, dried to constant mass at 110 ± 5°C. The required sample mass depends on the nominal maximum aggregate size (NMAS). For fine aggregates passing the 4.75 mm (No. 4) sieve, a minimum of 300 g is required. For coarse aggregates, the minimum sample mass increases with particle size: 25 kg for aggregate with NMAS of 37.5 mm, 40 kg for 50 mm NMAS, and 60 kg for 63 mm NMAS. These mass requirements ensure that the sample is statistically representative of the aggregate source.
A nested column of standard sieves is assembled in descending order of opening size, from coarsest at the top to finest at the bottom, with a pan at the base to collect the material passing the finest sieve. The dried sample is placed on the top sieve, and the stack is mechanically shaken for a period sufficient to ensure complete separation — typically 10 to 15 minutes for a mechanical sieve shaker operating at standard amplitude.
After shaking, the mass of material retained on each sieve is weighed to the nearest 0.1 g for fine aggregates and 0.5 g for coarse aggregates. The mass retained on each sieve is divided by the total dry sample mass to calculate the percent retained on each sieve. Cumulative percent retained is computed by summing the percent retained on the given sieve and all coarser sieves above it. Percent passing (also called percent finer) is calculated as 100 minus the cumulative percent retained.
Calculations and Reporting
The key calculations are:
Percent retained on sieve i = (Mass retained on sieve i / Total dry mass) × 100
Cumulative percent retained on sieve i = Sum of percent retained on sieve i and all larger sieves
Percent passing sieve i = 100 – Cumulative percent retained on sieve i
Results are reported in tabular format listing each sieve size, the mass retained, percent retained, cumulative percent retained, and percent passing. The test report must also include the total sample mass, the NMAS, and any observations about the aggregate characteristics (e.g., presence of clay lumps, excessive dust, or degradation during testing).
Precision and Bias
ASTM C136 provides precision statements based on interlaboratory studies. For a single-operator (repeatability) standard deviation, results from the same laboratory should not differ by more than the d2s limit, typically 0.16% to 1.8% depending on sieve size and material type. For multilaboratory (reproducibility), the acceptable range is wider. These precision limits underscore the importance of strict adherence to procedure, including proper sample splitting, accurate weighing, and calibrated sieves.
Standard Sieve Sizes
Sieve analysis relies on a standardized series of sieve openings established by ASTM E11 and ISO 3310-1. These standards define the nominal opening dimensions, wire diameters, and tolerances for woven wire test sieves. The sieve series follows the R 20/3 or R 40/3 geometric progression, where each successive sieve opening is approximately half the size of the one two sieves above.
Coarse Aggregate Sieves
Sieve Designation
Opening Size
Common Use
63.0 mm (2.5 inch)
63.0 mm
Largest coarse aggregate gradation
50.0 mm (2.0 inch)
50.0 mm
Base course materials
37.5 mm (1.5 inch)
37.5 mm
Superpave 37.5 mm NMAS
25.0 mm (1.0 inch)
25.0 mm
Superpave 25.0 mm NMAS
19.0 mm (3/4 inch)
19.0 mm
Superpave 19.0 mm NMAS
12.5 mm (1/2 inch)
12.5 mm
Superpave 12.5 mm NMAS
9.5 mm (3/8 inch)
9.5 mm
Superpave 9.5 mm NMAS
4.75 mm (No. 4)
4.75 mm
Boundary between coarse/fine aggregate
Fine Aggregate Sieves
Sieve Designation
Opening Size
Common Use
2.36 mm (No. 8)
2.36 mm
Asphalt Institute fine aggregate upper bound
2.00 mm (No. 10)
2.00 mm
AASHTO M 147 fine aggregate definition
0.600 mm (No. 30)
0.600 mm
Mineral filler definition (Asphalt Institute)
0.425 mm (No. 40)
0.425 mm
Gradation control point for many specs
0.300 mm (No. 50)
0.300 mm
Concrete fineness modulus calculation
0.150 mm (No. 100)
0.150 mm
Fine sand control
0.075 mm (No. 200)
0.075 mm
Mineral dust / P200 material
The 4.75 mm (No. 4) sieve marks the conventional boundary between coarse aggregate (retained on No. 4) and fine aggregate (passing No. 4). However, the Asphalt Institute defines this boundary at the No. 8 (2.36 mm) sieve, while AASHTO M 147 uses the No. 10 (2.00 mm) sieve. The 0.075 mm (No. 200) sieve is the most critical fine sieve in pavement engineering because material passing this size — called P200 or mineral dust — strongly influences binder demand, permeability, and moisture sensitivity.
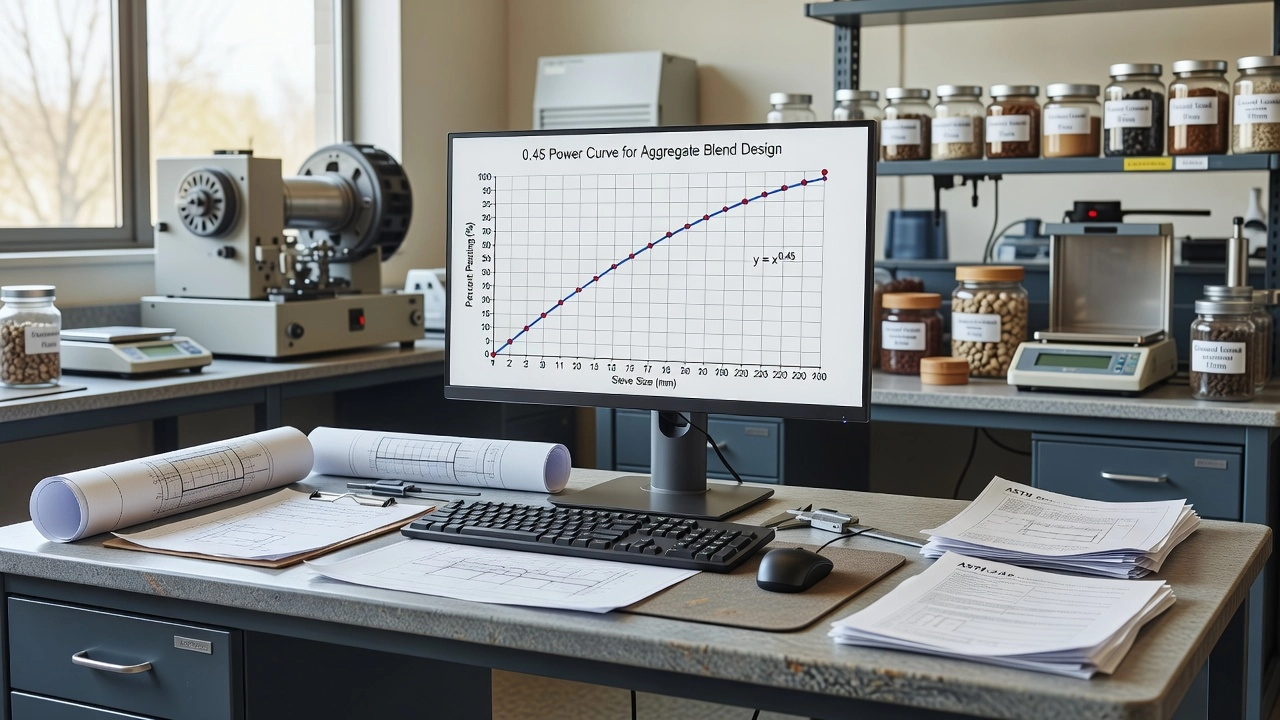
Gradation Charts — The 0.45 Power Graph
Graphical representation of gradation data is essential for mix design and quality control. The industry-standard chart is the FHWA 0.45 power gradation graph, introduced in the early 1960s and universally adopted for HMA mix design and evaluation.
Theoretical Foundation — Fuller and Thompson Equation
In 1907, Fuller and Thompson published an equation describing the gradation that produces maximum particle density:
P = (d / D)^n × 100
Where:
P = cumulative percent passing sieve size d
d = sieve opening size being considered
D = maximum aggregate size
n = exponent controlling the shape of the curve (approximately 0.5 for maximum density per Fuller and Thompson)
This equation, known as the Fuller curve, describes the ideal packing arrangement where successively smaller particles fill the voids between larger particles, producing minimum void space and maximum density. Fuller and Thompson determined that an exponent n of approximately 0.5 yields the densest particle packing for typical crushed aggregates.
The 0.45 Power Transformation
The FHWA adopted the Fuller-Thompson concept but modified the plotting method so that the maximum density line appears as a straight diagonal line on the gradation chart. This is achieved by plotting sieve size raised to the 0.45 power on the x-axis (horizontal) and cumulative percent passing on the y-axis (vertical). When Fuller and Thompson’s equation with n = 0.45 is plotted on these axes, it produces a straight line from the origin (0% passing at zero size) to the point representing 100% passing at the maximum aggregate size.
The significance of this transformation cannot be overstated: it allows engineers to instantly visually assess where a gradation falls relative to maximum density. A gradation that follows the straight line closely is well-graded (near-maximum density). A gradation that arches above the line in the finer sizes is fine-graded (excess fine material). A gradation that falls below the line is coarse-graded (excess coarse material).
Construction of the 0.45 Power Chart
To construct the chart for a given maximum aggregate size (e.g., 19.0 mm), the x-axis coordinates are computed as sieve opening^0.45. For a 19.0 mm maximum size, the 0.45 power maximum density line traces a straight line from (0, 0) at the origin to (19.0^0.45, 100) at the top right. Intermediate points are calculated using Fuller’s equation. For example, at the 4.75 mm (No. 4) sieve: d/D = 4.75/19.0 = 0.25. P = 0.25^0.45 × 100 = 53.4%. This means approximately 53% of the aggregate should pass the No. 4 sieve for a maximum density gradation with a 19.0 mm maximum size.
Different maximum aggregate sizes produce different maximum density lines on the same chart, each starting from a different point on the x-axis. The chart can accommodate multiple lines for different mixtures being evaluated simultaneously.
Interpreting the Chart
The position of a gradation curve relative to the maximum density line reveals important performance characteristics:
On the line — Maximum density, but potentially insufficient VMA for adequate binder content.
Above the line (fine side) — More fine particles, higher binder demand, increased susceptibility to rutting if too fine.
Below the line (coarse side) — More coarse particles, better stone-on-stone contact, lower binder demand, reduced workability if too coarse.
Humped shape in mid-range — Gap-graded, missing intermediate sizes, can segregate.
The restricted zone was historically included on Superpave gradation charts as a region through which gradations were discouraged from passing. This zone was located just above the maximum density line in the fine aggregate range (0.3 mm to 2.36 mm). It was originally believed that mixes passing through this zone would have unacceptably low VMA. However, NCHRP Report 464 (Kandhal and Cooley, 2001) definitively concluded that gradations violating the restricted zone performed similarly to or better than those outside it. The restricted zone was therefore eliminated from AASHTO M 323 and AASHTO R 35 in 2002, though it may still appear in historical documents.
Well-Graded (Dense-Graded) Characteristics
A well-graded aggregate — also called dense-graded — has a particle size distribution that closely follows the FHWA 0.45 power maximum density curve. This is the most common gradation type used in pavement construction in the United States and worldwide.
Particle Packing and Density
In a well-graded aggregate, the particles are distributed across a wide range of sizes such that smaller particles nest within the voids created by larger particles. This particle packing arrangement achieves high density with minimal void space. The mathematical ideal was described by Fuller and Thompson, but practical well-graded mixes intentionally deviate slightly from the maximum density curve to provide adequate voids in mineral aggregate (VMA) — typically 1% to 3% above the maximum density line for HMA.
The relationship between gradation and density is governed by the concept of packing efficiency. Natural aggregates with continuous size distributions produce packing densities of approximately 90% to 95% of the theoretical maximum, leaving 5% to 10% air voids. These air voids are essential in HMA to accommodate the asphalt binder film thickness around each particle and to allow for additional compaction under traffic without flushing (bleeding excess binder to the surface).
Performance Characteristics
Well-graded aggregates produce mixtures with several advantageous properties:
High stability — Stone-on-stone contact from the coarse fraction provides mechanical interlock that resists permanent deformation under load. The dense particle packing distributes stresses efficiently through the aggregate skeleton.
Low permeability — The continuous size distribution fills void spaces, creating a practically impermeable layer that protects the underlying pavement structure from water infiltration. Typical permeabilities for well-graded HMA are in the range of 10⁻⁴ to 10⁻⁶ cm/s.
Good workability — The balanced proportion of coarse and fine particles allows the mixture to be placed and compacted with conventional equipment. This contrasts with gap-graded or open-graded mixes that can be more difficult to handle.
Excellent fatigue resistance — The uniform stress distribution within well-graded mixtures reduces localized stress concentrations that initiate cracking. Dense-graded HMA typically exhibits superior fatigue life compared to open-graded alternatives.
Typical Applications
Dense-graded aggregates are used in the following pavement applications:
HMA surface courses — The vast majority of asphalt pavement surfaces in the U.S. are dense-graded. Superpave mix designs are almost exclusively dense-graded.
HMA binder and base courses — Structural layers benefit from the high stability and load distribution of well-graded materials.
PCC pavements — Well-graded aggregates reduce the paste volume required, lowering cost and reducing shrinkage. Most concrete pavements use dense-graded coarse and fine aggregates.
Base and subbase courses — Dense-graded crushed aggregates provide excellent load-bearing capacity, though permeability concerns may require open-graded drainage layers beneath.
Gradation Control for Dense-Graded Mixes
Dense-graded Superpave mixes are defined by control points at four key sieve sizes: the maximum aggregate size, the nominal maximum aggregate size, the 2.36 mm (No. 8) sieve, and the 0.075 mm (No. 200) sieve. The control points for a typical 12.5 mm NMAS Superpave mix are:
Sieve Size
Minimum % Passing
Maximum % Passing
19.0 mm (Max size)
100
100
12.5 mm (NMAS)
90
100
2.36 mm (No. 8)
28
58
0.075 mm (No. 200)
2.0
10.0
These control points ensure that the gradation remains within a zone that balances density, VMA, workability, and durability.
Gap-Graded Characteristics
A gap-graded aggregate distribution is one in which one or more intermediate particle sizes are present in very low percentages or absent entirely. On the 0.45 power gradation chart, a gap-graded curve exhibits a flat, horizontal segment in the mid-size range, indicating that few particles exist at those sieve sizes.
Formation and Mechanism
Gap gradation can occur naturally in some aggregate deposits or can be deliberately created by blending aggregates from different sources to omit specific size fractions. The absence of intermediate particles means that the coarse aggregate skeleton is filled primarily by fine particles, with a discontinuity in the size progression from coarse to fine.
In stone matrix asphalt (SMA), gap grading is intentionally designed to maximize stone-on-stone contact in the coarse fraction. SMA typically contains 70% to 80% coarse aggregate (retained on the 4.75 mm sieve) with a high proportion of a single coarse size, such as 9.5 mm to 4.75 mm. The voids between coarse particles are filled with a rich mortar of fine aggregate, mineral filler, asphalt binder, and stabilizing additives like cellulose or mineral fibers.
Performance Characteristics
Gap-graded aggregates produce mixtures with unique properties:
High rut resistance — The stone-on-stone contact in gap-graded SMA provides exceptional resistance to permanent deformation. SMA pavements can sustain heavy, slow-moving traffic without rutting.
Segregation tendency — During placement, gap-graded mixes are more prone to segregation than well-graded mixes because the absence of intermediate particles reduces the cohesive forces holding the mixture together. Careful handling and quality control are essential.
High binder content — SMA typically uses 5.5% to 7.0% asphalt binder compared to 4.5% to 6.0% for dense-graded HMA. The rich mortar provides durability and fatigue resistance.
Surface texture — Gap-graded surfaces tend to have a coarser, more open texture that provides excellent macrotexture for skid resistance and noise reduction.
Applications
Gap-graded mixes are used primarily in:
Stone matrix asphalt (SMA) wearing courses on high-volume highways and airport runways requiring exceptional rut resistance.
Some PCC mixes — Gap-graded concrete can reduce sand requirements while maintaining workability, though this practice is less common in the U.S. than in Europe.
Specialty surface treatments — Where surface texture requirements demand a specific aggregate size distribution.
Open-Graded Characteristics
An open-graded aggregate distribution contains only a small percentage of fine aggregate particles, creating a porous structure with interconnected voids. On the 0.45 power chart, the gradation curve is steep in the mid-size range (indicating a narrow range of coarse particles) and flat near zero in the fine range (indicating few particles passing the smaller sieves).
Structure and Permeability
Open-graded aggregates are designed to maximize permeability by limiting the amount of material passing the 2.36 mm (No. 8) or 4.75 mm (No. 4) sieves. Without fine particles to fill the voids between coarse particles, the air void content typically ranges from 15% to 25% — compared to 3% to 6% for dense-graded HMA after compaction. This high void content creates drainage channels that allow water to flow freely through the pavement structure.
The permeability of open-graded mixtures is several orders of magnitude higher than dense-graded mixtures. Typical coefficients of permeability for open-graded friction courses (OGFC) range from 0.1 to 1.0 cm/s, compared to 10⁻⁴ cm/s or less for dense-graded HMA. This rapid drainage eliminates the risk of hydroplaning and improves wet-weather visibility by reducing splash and spray.
Performance Characteristics
Open-graded aggregates offer distinct advantages and limitations:
Excellent drainage — Water drains laterally through the pavement structure and exits at the pavement edge, preventing surface water accumulation and hydroplaning.
Noise reduction — The porous structure absorbs tire-pavement noise, reducing traffic noise levels by 3 to 8 dB compared to dense-graded surfaces.
Reduced structural strength — The high void content reduces the structural contribution of the open-graded layer. Open-graded mixes are typically placed as thin wearing courses (25 to 50 mm) over a dense structural base.
Oxidation and aging — The interconnected voids expose the asphalt binder to air and UV radiation, accelerating oxidative hardening. Open-graded mixes typically have shorter service lives (8 to 12 years) than dense-graded mixes (15 to 20 years).
Clogging potential — Over time, the voids can become clogged with debris, reducing the drainage function. Periodic cleaning or replacement may be required.
Types of Open-Graded Mixes
Two common types of open-graded pavement materials are:
Open-Graded Friction Course (OGFC) — An HMA wearing course with 15% to 20% air voids, designed for surface drainage and skid resistance. OGFC is typically 19 to 25 mm thick.
Porous Asphalt — A full-depth permeable asphalt pavement system that allows stormwater to infiltrate through the pavement into the subgrade. Porous asphalt systems are used in parking lots, low-volume roads, and stormwater management applications.
Pervious Concrete — A concrete pavement with intentionally high void content (15% to 35%) that allows water to pass directly through the pavement surface. Used for parking lots, sidewalks, and stormwater management.
Nominal Maximum Aggregate Size (NMAS)
Nominal maximum aggregate size (NMAS) is a critical parameter in mix design and specification. It defines the largest particle size that appears in significant quantity in the aggregate blend.
Superpave Definition
The Superpave mix design method defines NMAS as one sieve size larger than the first sieve to retain more than 10% of the material by weight. For example, if a gradation shows 8% retained on the 19.0 mm sieve and 16% retained on the 12.5 mm sieve, the NMAS is 19.0 mm (one sieve larger than the 12.5 mm sieve, which is the first to retain more than 10%).
Maximum aggregate size is distinct from NMAS; Superpave defines it as one sieve size larger than the NMAS. In the same example, the maximum aggregate size would be 25.0 mm. The maximum size sieve must allow 100% passing.
Standard Superpave Sizes
Superpave specifies five standard NMAS values:
NMAS
First Sieve >10% Retained
Max Aggregate Size
Typical Application
9.5 mm
4.75 mm (No. 4)
12.5 mm
Thin overlays, surface treatments
12.5 mm
9.5 mm (3/8 inch)
19.0 mm
Surface and intermediate courses
19.0 mm
12.5 mm (1/2 inch)
25.0 mm
Binder and base courses
25.0 mm
19.0 mm (3/4 inch)
37.5 mm
Base courses, thick pavements
37.5 mm
25.0 mm (1 inch)
50.0 mm
Heavy-duty base courses
Engineering Significance
NMAS affects several aspects of pavement performance and construction:
Lift thickness — The compacted lift thickness should be at least 3 to 4 times the NMAS to ensure adequate compaction without particle breakage. For a 19.0 mm NMAS, the minimum lift thickness is approximately 75 mm.
Workability — Larger NMAS values produce mixes that are more difficult to handle and compact, particularly around obstructions and in thin lifts.
Surface texture — NMAS directly influences the surface macrotexture. Smaller NMAS values produce smoother surfaces with closer aggregate spacing, while larger NMAS values create coarser surfaces with better macrotexture for skid resistance.
Segregation potential — Mixes with larger NMAS are more prone to segregation during handling, transport, and placement.
Structural capacity — Larger NMAS mixes typically have higher modulus and better resistance to permanent deformation due to the coarser aggregate skeleton.
Gradation and Pavement Performance
The relationship between aggregate gradation and pavement performance is direct and quantifiable. Each gradation type produces distinct failure modes and performance characteristics that must be understood during mix design.
Rutting (Permanent Deformation)
Rutting is the accumulation of permanent deformation in the wheel path under repeated traffic loading. The aggregate gradation plays a primary role in rut resistance:
Well-graded coarse gradations (below the maximum density line) provide superior rut resistance because the coarse aggregate skeleton carries the load through stone-on-stone contact. The voids in coarse aggregate (VCA) in these mixes is typically lower than the VCA of the pure coarse fraction, confirming aggregate interlock.
Fine-graded mixes (above the maximum density line) are more susceptible to rutting because the coarse particles are “floating” in a matrix of fine aggregate and binder, reducing stone-on-stone contact. The load is carried primarily by the binder-fines mortar, which is more prone to viscous flow under load.
Gap-graded mixes like SMA provide exceptional rut resistance because the coarse fraction is designed specifically for stone-on-stone contact.
Fatigue Cracking
Fatigue cracking results from repeated tensile strains at the bottom of the HMA layer under traffic loading:
Well-graded mixes distribute tensile stresses more uniformly through the aggregate skeleton, resulting in longer fatigue life. The optimum gradation for fatigue resistance depends on the binder content and air void level.
Open-graded mixes have lower stiffness due to high air voids, which can increase tensile strains at the bottom of the layer and reduce fatigue life when used in structural layers.
Fine-graded mixes may exhibit shorter fatigue life at low binder contents due to insufficient film thickness, but can perform well at higher binder contents.
Low-Temperature Cracking
In cold climates, thermal contraction stresses can cause transverse cracking when they exceed the tensile strength of the mixture:
Coarse-graded mixes with large NMAS tend to develop higher thermal stresses due to higher stiffness at low temperatures, potentially increasing crack frequency.
Fine-graded mixes with more binder and lower stiffness may better accommodate thermal contraction.
The mineral filler content (P200) influences the mastic stiffness at low temperatures and affects thermal cracking resistance.
Moisture Damage
Moisture damage — the loss of adhesive bond between aggregate and binder in the presence of water — is influenced by gradation:
Open-graded mixes have high permeability that allows rapid water ingress, but also rapid drainage.
Dense-graded mixes with low permeability minimize water entry but can trap water that does enter, accelerating moisture damage.
Fine-graded mixes with high P200 content may have better resistance to moisture damage because the fine mastic is less permeable.
Permeability and Drainage
The relationship between gradation and permeability is exponential. Even small changes in the percentage passing the 0.075 mm (No. 200) sieve dramatically affect permeability. Research by Ridgeway (1982) demonstrated that increasing the P200 content from 2% to 8% reduced the permeability of an aggregate base material by approximately four orders of magnitude. This sensitivity is why many specifications tightly control P200 content.
For base and subbase courses intended to provide drainage, agencies specify open-graded aggregate with maximum P200 contents of 2% to 4%. For dense-graded base courses where load-bearing capacity is the primary concern, P200 contents up to 8% may be permitted.
Gradation Specification Bands
Gradation specifications define acceptable ranges of particle size distribution for specific pavement applications. These are typically expressed as specification bands — upper and lower limits of percent passing at each sieve size.
Specification Types
Gradation specifications can be categorized into several types:
Single-band specification — One set of upper and lower limits defining a single acceptable gradation zone for a given application. This is the most common type.
Multiple-band specification — Multiple gradation bands (e.g., Grading A, B, C) for different applications or maximum aggregate sizes within the same specification table. FHWA FP-96 includes multiple grading bands for subbase, base, and surface courses.
Point-to-point specification — Instead of continuous bands, specific target values with tolerances at key sieve sizes. This approach is used in some agency specifications for quality control.
Superpave control points — Specification limits at four critical sieve sizes (maximum, NMAS, No. 8, and No. 200) with a recommended gradation zone between them. Superpave does not define continuous bands but uses control points and additional requirements like the restricted zone (historical) and VMA requirements.
FHWA Representative Specifications
The FHWA Standard Specifications for Construction of Roads and Bridges (FP-96) provides representative gradation bands for aggregate courses:
Sieve Size
Subbase (Grading A)
Base (Grading B)
Surface (Grading F)
63.0 mm
—
100
—
50.0 mm
100
97–100
—
37.5 mm
97–100
—
—
25.0 mm
—
—
100
19.0 mm
—
—
97–100
12.5 mm
—
40–60 (±8)
—
4.75 mm
40–60 (±8)
—
41–71 (±7)
0.425 mm
—
9–17 (±4)
12–28 (±5)
0.075 mm
0–12 (±4)
4–8 (±3)
5–16 (±4)
The numbers in parentheses show allowable deviations from the target value during production, reflecting the practical variability inherent in aggregate production.
Superpave Gradation Control Points
Superpave specifications define control points for each NMAS:
Sieve Size
9.5 mm NMAS
12.5 mm NMAS
19.0 mm NMAS
25.0 mm NMAS
37.5 mm NMAS
50.0 mm
—
—
—
—
100
37.5 mm
—
—
—
100
90–100
25.0 mm
—
—
100
90–100
90 max
19.0 mm
—
100
90–100
—
—
12.5 mm
100
90–100
—
—
—
9.5 mm
90–100
—
—
—
—
4.75 mm
—
—
—
—
—
2.36 mm
32–67
28–58
23–49
19–45
15–41
0.075 mm
2–10
2–10
2–8
1–7
0–6
Superpave also specifies that gradations should not cross the maximum density line in a manner that produces excessively low VMA, though this is now evaluated through volumetric requirements rather than the historical restricted zone.
FAA and ICAO Airport Specifications
For airport pavements, the FAA and ICAO specify gradation requirements through national standards like FAA P-401 (asphalt) and P-501 (concrete), as referenced in ICAO Aerodrome Design Manual Part 3. Airport specifications are generally more stringent than highway specifications due to the higher wheel loads and tire pressures of aircraft, particularly for runways serving wide-body aircraft.
FAA P-401 for airport asphalt specifies gradation bands for surface courses with NMAS typically ranging from 12.5 mm to 19.0 mm, with tighter control on P200 content (typically 2% to 7%) and particular attention to the percent fractured faces and flat/elongated particles — properties that interact with gradation to control overall mixture performance.
Quality Control and Acceptance
During production, gradation is continuously monitored through quality control (QC) testing by the producer and quality assurance (QA) testing by the agency. Typical testing frequencies range from one gradation test per 500 to 1,000 tons of produced material, depending on the project specifications.
Statistical quality control methods, such as moving average charts and standard deviation analysis, are used to detect trends that might indicate a shift in gradation before the material falls outside specification limits. Control charts tracking percent passing at critical sieves — particularly the NMAS sieve, the No. 8 (2.36 mm) sieve, and the No. 200 (0.075 mm) sieve — are standard practice in all major pavement construction projects.
Variability in gradation is quantified using the fineness modulus (FM) for fine aggregates (sum of cumulative percent retained on standard sieves divided by 100) and the coefficient of uniformity (Cu = D60/D10) for coarse-grained soils and aggregates. These indices provide single-number summaries of the gradation but do not replace the detailed sieve analysis for acceptance purposes.
Summary
Aggregate gradation is a fundamental material property controlling the performance of asphalt and concrete pavements. It is determined through standardized sieve analysis (ASTM C136 / AASHTO T 27), which separates aggregate particles by size using a stacked series of standard sieves. The resulting particle size distribution is analyzed graphically using the FHWA 0.45 power chart, where the theoretical maximum density line serves as a reference for evaluating gradation quality.
Well-graded (dense-graded) aggregates follow the maximum density curve closely and produce mixtures with high stability, low permeability, and good workability — making them the standard for most pavement applications. Gap-graded aggregates, missing intermediate particle sizes, provide exceptional rut resistance in stone matrix asphalt applications. Open-graded aggregates, lacking fines, create permeable pavements ideal for drainage and noise reduction.
Nominal maximum aggregate size defines the largest particle in significant quantity and controls lift thickness, workability, surface texture, and structural capacity. Gradation specification bands and Superpave control points define acceptable gradation ranges for each application, with additional considerations for airport pavements under FAA and ICAO standards.
The relationship between gradation and pavement performance is direct: coarse-graded mixes resist rutting through stone-on-stone contact, fine-graded mixes with adequate binder provide good fatigue life, and open-graded mixes facilitate drainage while sacrificing structural strength. Proper gradation design requires balancing these competing performance requirements within the constraints of available aggregate sources, construction methods, and project-specific loading and environmental conditions.
Frequently Asked Questions
Aggregate gradation is the particle size distribution of an aggregate sample, determined by passing material through a series of standard sieves. It is one of the most influential aggregate characteristics in pavement engineering. In hot-mix asphalt (HMA), gradation affects stiffness, stability, durability, permeability, workability, fatigue resistance, frictional resistance, and moisture susceptibility. In portland cement concrete (PCC), gradation influences durability, porosity, workability, cement and water requirements, strength, and shrinkage. Proper gradation design ensures that smaller particles fill voids between larger particles to achieve target density while maintaining sufficient void space for binder (asphalt or cement paste).
ASTM C136 (also AASHTO T 27) is the standard test method for sieve analysis of fine and coarse aggregates. A dry aggregate sample of known weight is placed on the top sieve of a stacked series with progressively smaller openings. The stack is mechanically shaken for a specified duration. The weight of material retained on each sieve is measured and divided by the total sample weight to calculate percent retained. Cumulative percent passing is computed by subtracting cumulative percent retained from 100%. The results are reported in tabular form and plotted on a gradation graph, typically the FHWA 0.45 power chart. Sample mass requirements vary by nominal maximum aggregate size — from 200 g for fine aggregates up to 25 kg for coarse aggregates with NMAS of 37.5 mm or larger.
The 0.45 power gradation chart, introduced by FHWA in the early 1960s, is the standard graphical tool for evaluating aggregate gradation in the HMA industry. The x-axis represents sieve size raised to the 0.45 power, while the y-axis shows cumulative percent passing. When plotted this way, the theoretical maximum density line derived from Fuller and Thompson's equation (1907) appears as a straight diagonal line from the origin to the maximum aggregate size. A gradation that follows this line closely is considered well-graded (dense-graded) and produces maximum density. Gradations above the line are fine-graded; those below are coarse-graded. The chart is used to evaluate blend proportions, identify gradation type, and ensure compliance with specification control points in Superpave and other mix design methods.
The five main types of aggregate gradation are: (1) Well-graded (dense-graded) — near the 0.45 power maximum density curve, providing high stability and low permeability, used in most HMA and PCC mixes; (2) Gap-graded — missing intermediate particle sizes, creating a flat mid-range curve on the gradation chart, used in stone matrix asphalt (SMA) and some PCC mixes for improved economics; (3) Open-graded — lacking fines, producing high air void content for drainage, used in porous asphalt and pervious concrete; (4) Uniformly graded — most particles in a narrow size range, producing a steep gradation curve; and (5) Poorly graded — a general term for any gradation that does not conform to well-graded criteria. Each type produces distinctly different pavement performance characteristics.
Nominal maximum aggregate size (NMAS) is defined by Superpave as one sieve size larger than the first sieve to retain more than 10% of the material by weight. For example, if the 19.0 mm sieve retains 8% and the 12.5 mm sieve retains 15%, the NMAS is 19.0 mm. Maximum aggregate size, by contrast, is defined as one sieve larger than the NMAS — in this case 25.0 mm. NMAS directly influences the thickness of the pavement lift (typically 3 to 4 times NMAS), workability of the mix, achievable compaction, and surface texture. Superpave specifies five standard NMAS values: 9.5 mm, 12.5 mm, 19.0 mm, 25.0 mm, and 37.5 mm, each with corresponding gradation control points that define the acceptable percent passing ranges at key sieve sizes.
Poor aggregate gradation is a root cause of several pavement distress modes. Overly fine gradations (excessive material above the maximum density line) can lead to rutting and low VMA (voids in mineral aggregate) due to insufficient stone-on-stone contact. Overly coarse gradations can cause segregation during placement, poor workability, and difficulty achieving compaction. Gap-graded mixes lacking intermediate sizes may exhibit segregation and poor surface texture. Open-graded mixes without fines provide excellent drainage but lower structural strength. In PCC, poor gradation increases water demand, raising the water-cement ratio and reducing strength and durability while increasing shrinkage cracking. Proper gradation design using specification bands and control points is essential to mitigate these distress mechanisms.
Optimize Your Pavement Mix Designs
Need expert guidance on aggregate gradation for airport or highway pavements? Our materials engineering team can help you select, design, and implement optimized gradations for asphalt and concrete mixes, ensuring compliance with ICAO, FAA, and AASHTO standards while maximizing performance and service life.
Pervious concrete (also called permeable or porous concrete) is a concrete with high interconnected void content (15-35%) allowing water to pass through, reduci...
Concrete mix design is the process of selecting and proportioning cement, aggregates, water, and admixtures to produce concrete with specified fresh properties ...
Asphalt binder content (Pb) is the percentage by weight of binder in hot-mix asphalt — the single most important compositional parameter controlling durability,...
33 min read
Asphalt materials
Quality control
+3
Cookie Consent We use cookies to enhance your browsing experience and analyze our traffic. See our privacy policy.