ASTM D6433 — Standard Practice for Roads and Parking Lots Pavement Condition Index Surveys
ASTM D6433-20 defines the Pavement Condition Index (PCI) methodology for roads and parking lots, establishing inspection unit definition, distress identification, severity/quantity measurement, deduct value curves, and PCI calculation. It is the foundation for pavement condition assessment. Covers the full ASTM D6433 methodology, distress types by pavement type, and how TarmacView’s visual proxy relates to official D6433 PCI.
Scope and Application
ASTM D6433, formally titled Standard Practice for Roads and Parking Lots Pavement Condition Index Surveys, is the definitive international standard for quantifying the surface condition of asphalt and concrete pavements through a systematic visual survey procedure. The standard was originally developed by the U.S. Army Corps of Engineers through its PAVER system research at the Construction Engineering Research Laboratory (CERL) in Champaign, Illinois, and was subsequently adopted by ASTM International under the jurisdiction of Committee E17 on Vehicle-Pavement Systems. The current active revision is ASTM D6433-24 (published 2024), superseding D6433-23, D6433-20, D6433-18, D6433-16, D6433-11, and earlier versions dating back to D6433-99.
The Pavement Condition Index (PCI) produced by this standard is a numerical indicator that rates the surface condition of the pavement on a scale from 0 to 100, where 100 represents a pavement with no visible distress and 0 represents complete failure. The PCI provides a measure of the present condition of the pavement based on the distress observed on the surface, which also indicates the structural integrity and surface operational condition including localized roughness and safety. It is important to understand what the PCI does not measure: the PCI cannot measure structural capacity (load-bearing strength), nor does it provide direct measurement of skid resistance or roughness. These functional and structural parameters require separate testing methods — Falling Weight Deflectometer (FWD) for structural capacity, continuous friction measuring equipment (CFME) for skid resistance, and inertial profilers for roughness (International Roughness Index, IRI).
The standard is applicable to a broad range of pavement facilities including: municipal street networks (arterial, collector, and local roads); state and federal highway systems; parking lots of all sizes (commercial, institutional, industrial); military installation pavements; and airport service roads and parking facilities (note that airport runways, taxiways, and aprons use the related ASTM D5340 standard for airport PCI surveys). The standard explicitly states that the PCI represents the collective judgment of pavement maintenance engineers and is an indirect measurement of pavement structural integrity (not capacity) and pavement functional condition indicators such as roughness. The PCI method is not intended to replace the direct measurement of ride quality, structural capacity, or friction.
Continuous monitoring of the PCI over time is used to establish the rate of pavement deterioration, which permits early identification of major rehabilitation needs before the pavement reaches a condition where only expensive reconstruction is viable. The PCI also provides feedback on pavement performance for validation or improvement of current pavement design and maintenance procedures. This is the foundation of any Pavement Management System (PMS) — without a standardized, repeatable condition index, network-level budget optimization, project prioritization, and performance tracking are impossible.
Inspection Unit Definition
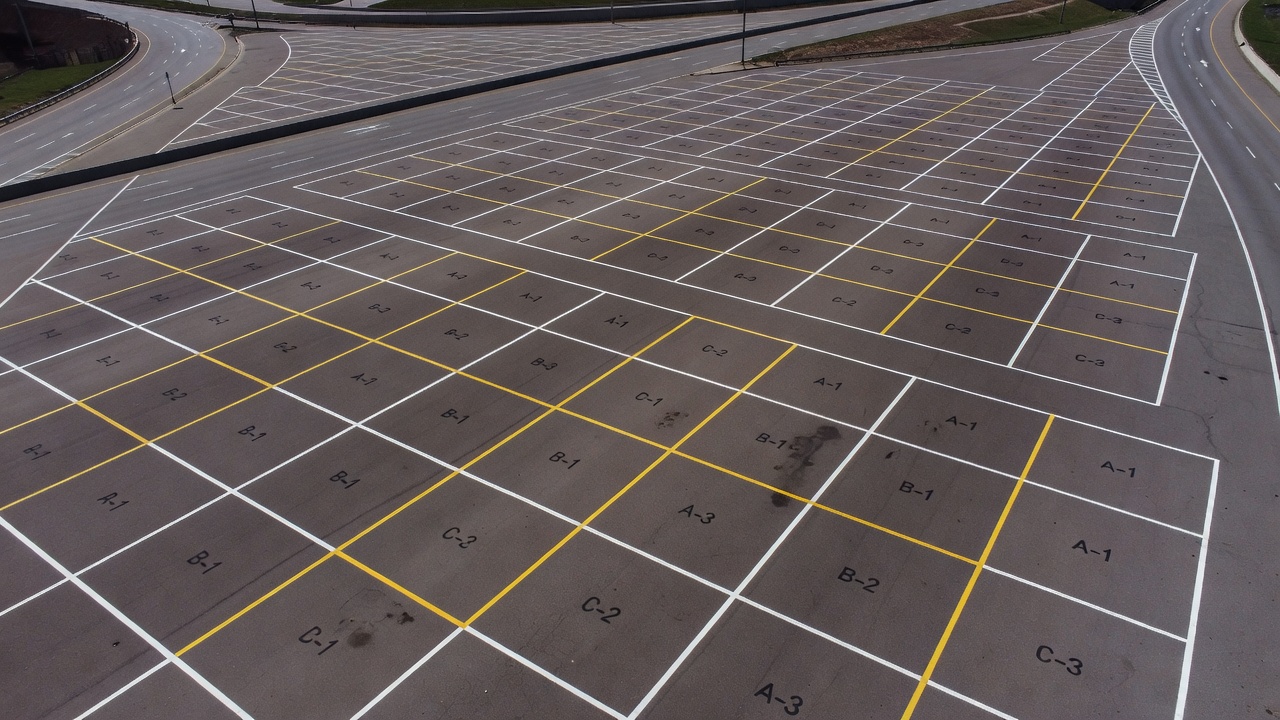
The PCI methodology begins with a rigorous inventory structure rather than inspection. Before any distress data is collected, the road network must be decomposed into a three-level hierarchy: Branches, Sections, and Sample Units. This hierarchical decomposition ensures that PCI data can be aggregated and reported at any level of the network, from a single sample unit to an entire city-wide pavement network.
Branches are the highest level of the hierarchy. A Branch is typically a single road, street, or parking lot identified by name or route number (e.g., “Main Street,” “Route 42,” “Parking Lot A”). Each Branch is assigned a unique identifier within the pavement management system. Branches are further characterized by their use type (arterial, collector, local, parking), surface type (asphalt concrete, Portland cement concrete, composite), and pavement rank (primary, secondary, tertiary for priority purposes).
Sections are contiguous pavement segments within a Branch that share uniform characteristics: the same construction history (same original construction date and rehabilitation events), the same traffic volume and load levels, the same surface type and structural design, and relatively uniform condition. Sections are the fundamental unit at which PCI is reported and maintenance decisions are made. A section of Main Street that was repaved in 2020 is a different Section from the adjoining segment that was last surfaced in 2005, even though they share the same Branch name. Section boundaries should be permanent and correspond to identifiable field features such as intersections, cross-streets, mileposts, or drainage basin boundaries. The standard does not prescribe a maximum section length, but typical practice limits sections to 0.5 to 1.0 miles (0.8 to 1.6 km) for urban roads and up to 3.0 miles (4.8 km) for rural highways to maintain condition uniformity within each section.
Sample Units are the actual areas that inspectors walk and survey — the fundamental unit of PCI data collection. For asphalt concrete (AC) roads, a sample unit is approximately 2,500 square feet (±1,000 sq ft), which corresponds to one lane width (typically 12 feet or 3.7 m) multiplied by a length of about 100 feet (30.5 m) for a standard 2,400 sq ft unit. For Portland cement concrete (PCC) roads, a sample unit is approximately 20 contiguous slabs (±8 slabs), because slab edges and joints are critical distress features in rigid pavements. The standard permits sample unit areas to vary within the tolerance range — this flexibility allows inspectors to align sample unit boundaries with identifiable landmarks (intersections, manholes, utility covers) and avoid splitting slabs or pavement features across sample unit boundaries.
The standard provides a formula for calculating the minimum number of sample units (n) that must be inspected per Section to achieve a 95% confidence level for the Section PCI estimate:
n = (N × s²) / [(e²/4) × (N - 1) + s²]
Where N is the total number of sample units in the Section, s is the estimated standard deviation of PCI within the Section (typically assumed as 10 PCI points for planning purposes, or determined from previous inspections), and e is the allowable error in the Section PCI estimate (typically ±5 PCI points). For a typical Section with 20 to 40 sample units and a 10-point standard deviation, this formula yields an inspection requirement of 5 to 8 random sample units — a significant efficiency gain over 100% inspection.
The random sampling procedure specified in ASTM D6433 uses systematic random sampling: the inspector divides the total number of sample units in the Section by the required number of random units (n) to obtain a sampling interval (i), selects a random starting unit between 1 and i, and inspects every i-th unit thereafter. This systematic approach ensures spatial coverage across the Section while maintaining the statistical validity of random sampling. In addition to the random sample units, the standard permits the inspection of additional sample units — non-representative areas such as utility cuts, localized failure patches, or areas with unique distress patterns. These additional units are reported separately and are not included in the Section PCI calculation, preventing unrepresentative localized conditions from distorting the Section average.
Distress Types by Pavement Type
The core of a PCI survey is the systematic identification and measurement of standardized distress types. ASTM D6433 defines separate distress catalogs for asphalt concrete (AC) surfaces and Portland cement concrete (PCC) surfaces. The AC catalog contains 19 distress types (numbered 01 through 19), while the PCC catalog contains 15 distress types (numbered 21 through 39). Each distress type has specific definitions, measurement units, severity level criteria, and its own set of deduct value curves.
Asphalt Concrete (AC) Distress Types — 19 Types
Code
Distress Type
Measurement Unit
Severity Levels
01
Alligator (Fatigue) Cracking
Square Feet
L / M / H
02
Bleeding
Square Feet
L / M / H
03
Block Cracking
Square Feet
L / M / H
04
Bumps and Sags
Linear Feet
L / M / H
05
Corrugation
Square Feet
L / M / H
06
Depression
Square Feet
L / M / H
07
Edge Cracking
Linear Feet
L / M / H
08
Joint Reflection Cracking
Linear Feet
L / M / H
09
Lane/Shoulder Drop-Off
Linear Feet
L / M / H
10
Longitudinal and Transverse Cracking
Linear Feet
L / M / H
11
Patching and Utility Cuts
Square Feet
L / M / H
12
Polished Aggregate
Square Feet
N/A
13
Potholes
Count
L / M / H
14
Railroad Crossing
Square Feet
L / M / H
15
Rutting
Square Feet
L / M / H
16
Shoving
Square Feet
L / M / H
17
Slippage Cracking
Square Feet
L / M / H
18
Swell
Square Feet
L / M / H
19
Weathering and Raveling
Square Feet
L / M / H
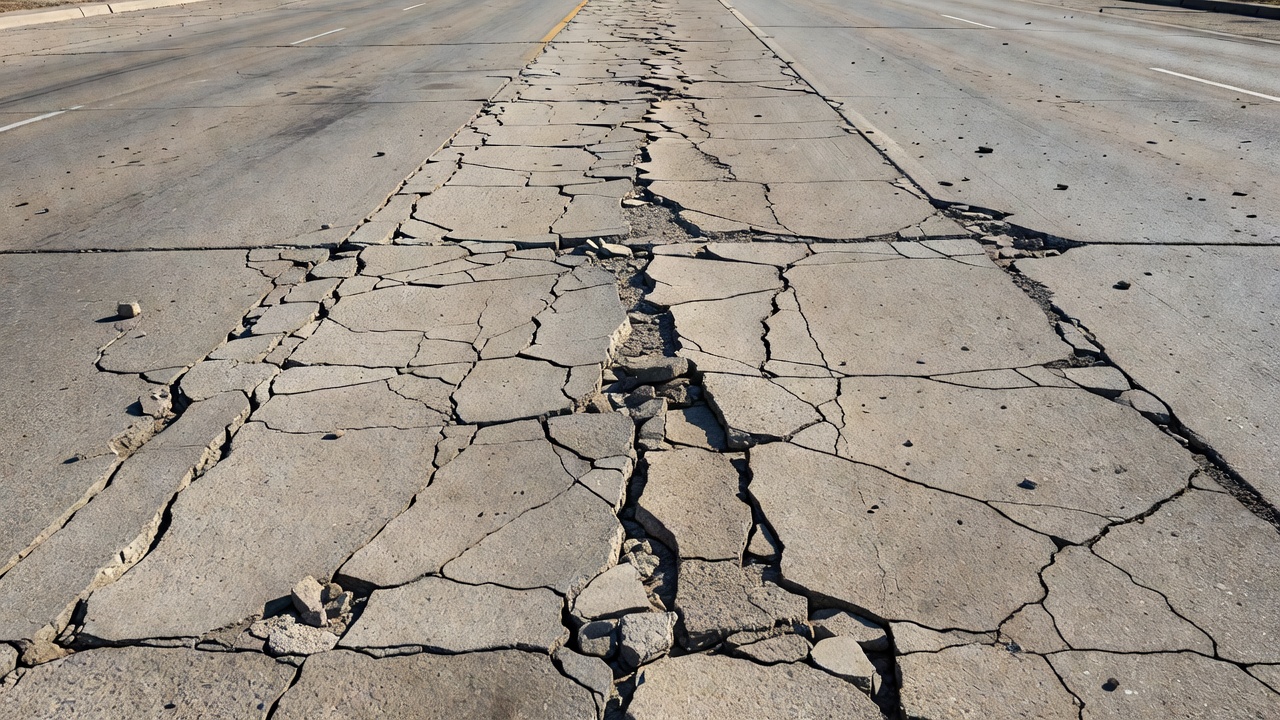
Alligator (Fatigue) Cracking (01) is a series of interconnected cracks forming small polygons resembling alligator hide. It is caused by traffic-induced fatigue failure of the asphalt concrete layer under repeated load applications. The cracking initiates at the bottom of the HMA layer (where tensile strains are highest) and propagates upward to the surface. Low severity is defined as fine longitudinal cracks with no spalling, typically less than 1/4 inch (6 mm) wide. Medium severity shows further development with light spalling at crack edges. High severity exhibits a fully developed pattern with spalling, pumping, and crack widths exceeding 1/2 inch (13 mm). Alligator cracking is the most critical structural distress for AC pavements.
Bleeding (02) is a film of asphalt binder on the pavement surface that creates a shiny, glass-like reflection. It occurs when the asphalt binder fills the aggregate voids during hot weather and then rises to the surface. Bleeding reduces skid resistance and is caused by excessive binder content, low air voids, or over-applied tack coats.
Block Cracking (03) consists of rectangular cracks dividing the pavement into blocks approximately 1 to 100 square feet (0.1 to 10 m²) in area. Unlike alligator cracking, block cracking is caused by thermal shrinkage of the HMA (not traffic loading) and indicates age hardening and oxidation of the asphalt binder. Low severity cracks are less than 1/4 inch wide with no spalling. Medium severity cracks are 1/4 to 3/4 inch wide with light spalling. High severity cracks exceed 3/4 inch with heavy spalling.
Potholes (13) are bowl-shaped depressions in the pavement surface. They result from the progressive deterioration of alligator cracking or localized base/subgrade failures. Potholes are measured by count — the number of individual potholes in the sample unit — and the quantity field records the count rather than an area or length. Low severity potholes are less than 1 inch (25 mm) deep. Medium severity potholes are 1 to 2 inches (25 to 50 mm) deep. High severity potholes exceed 2 inches (50 mm) in depth.
Rutting (15) is a longitudinal surface depression in the wheel path caused by permanent deformation of one or more pavement layers under traffic loading. Rutting is measured as the maximum rut depth in the sample unit. Low severity ruts are 1/4 to 1/2 inch (6 to 13 mm) deep. Medium severity ruts are 1/2 to 1 inch (13 to 25 mm) deep. High severity ruts exceed 1 inch (25 mm) in depth.
Weathering and Raveling (19) is the wearing away of the pavement surface caused by loss of asphalt binder and dislodgment of aggregate particles. It is caused by oxidation of the asphalt binder, exposure to weather (UV radiation, freeze-thaw cycles), and the mechanical action of traffic. Low severity shows loss of fine aggregate with some surface roughness. Medium severity shows loss of coarse aggregate with significant surface texture and pitting. High severity shows extensive loss of coarse aggregate creating a pockmarked surface.
Key distinctions in PCC distress measurement: The primary measurement unit for most PCC distresses is number of affected slabs rather than square feet or linear feet. The inspector counts how many slabs within the 20-slab sample unit exhibit each distress type. The density is then computed as (number of affected slabs / total slabs in sample unit) × 100. Joint Seal Damage (26) is an exception — it is rated by the overall condition of the sealant material in the sample unit joints rather than by density, because the entire joint system is evaluated holistically. Shrinkage Cracks (37) are fine, hairline cracks that do not extend through the full slab depth and have no load transfer function — they are recorded as present or absent without severity levels.
Punchout (34) applies exclusively to Continuously Reinforced Concrete Pavement (CRCP) — it is the structural failure of the area between two adjacent transverse cracks, caused by the loss of aggregate interlock at the cracks and subsequent pump-out of subgrade material. This distress does not occur in jointed plain concrete pavement (JPCP) or jointed reinforced concrete pavement (JRCP).
Severity Levels per Distress
Each distress type in ASTM D6433 is classified into three severity levels — Low (L), Medium (M), and High (H) — with the exception of Polished Aggregate (AC-12, PCC-31), Popouts (PCC-32), and Shrinkage Cracks (PCC-37), which have no defined severity levels and are recorded simply as present or absent. The severity level definitions are specific to each distress type and are based on measurable physical characteristics rather than subjective judgement.
Low Severity generally indicates the initial stage of the distress with minor physical manifestation. For cracking distresses, Low severity typically means crack widths less than 1/4 inch (6 mm) with no spalling or secondary cracking. For surface deformation distresses (rutting, depression), Low severity means depth less than 1/4 to 1/2 inch (6 to 13 mm) depending on the specific distress. For disintegration distresses (weathering/raveling), Low severity means loss of fine aggregate with surface roughening but no loss of coarse aggregate.
Medium Severity indicates intermediate deterioration where the distress is clearly visible and beginning to affect pavement performance. For cracking, Medium severity typically means crack widths of 1/4 to 3/4 inch (6 to 19 mm) with light spalling at crack edges and some secondary cracking. For surface deformation, Medium severity means depth of 1/2 to 1 inch (13 to 25 mm) for rutting and depressions. For disintegration, Medium severity means loss of coarse aggregate with pitting and surface texture development.
High Severity indicates advanced deterioration where the distress significantly compromises pavement performance and structural integrity. For cracking, High severity typically means crack widths exceeding 3/4 inch (19 mm) with heavy spalling, pumping, and extensive secondary cracking. For alligator cracking, High severity shows a fully developed pattern with loose pieces and pumping. For surface deformation, High severity means depth exceeding 1 inch (25 mm) for rutting and depressions. For potholes, High severity means depth exceeding 2 inches (50 mm).
The severity level assignment must follow the written definitions in the standard for each specific distress type. There is no single crack width cutoff that applies to all distress types — the definitions are distress-specific. For example, the crack width thresholds for Alligator Cracking differ from those for Block Cracking and those for Longitudinal/Transverse Cracking. Inspectors must be trained on the specific severity definitions for each distress type in the catalog. This is why inspector qualification is critical — ASTM does not currently have a formal certification program for PCI inspectors, but many agencies require inspectors to pass a proficiency test or complete a training course such as the U.S. Army Corps of Engineers PAVER training or the FAA’s PCI inspector training.
Quantity Measurement
The quantity of each distress within a sample unit is measured in one of three units depending on the distress type: square feet (area), linear feet (length), or count (individual occurrences). The measurement unit for each distress type is specified in the standard’s distress catalog and is not interchangeable.
For area-based measurements (most distress types for AC pavements): the inspector measures the length and width of the affected area and multiplies to obtain square feet. For irregularly shaped areas, the inspector approximates the area as a rectangle or uses the visual estimation method — estimating the percentage of the sample unit area affected and multiplying by the total sample unit area. For example, if a sample unit is 2,500 square feet and approximately 5% of the surface shows bleeding, the quantity is recorded as 125 square feet. The standard permits the use of trained visual estimation for area measurement — studies have shown that trained inspectors can estimate distress area within ±10% accuracy compared to precise tape-and-field measurement, and the time savings justify the minor loss of precision for network-level surveys.
For linear-based measurements (cracking distresses, edge cracking, lane/shoulder drop-off): the inspector measures the total length of the crack or feature in linear feet. For cracks that extend beyond the sample unit boundary, only the length within the sample unit is measured. For multiple cracks of the same type and severity within a sample unit, the lengths are summed. For example, three transverse cracks of Low severity within a sample unit, measuring 12, 8, and 10 feet respectively, would be recorded as a single entry of 30 linear feet of Low severity transverse cracking.
For count-based measurements (potholes, some PCC distresses): the inspector simply counts the number of individual occurrences. For potholes, each pothole is counted individually regardless of its size. The quantity field records the total count. For PCC slab distresses, the inspector counts the number of affected slabs within the sample unit (typically 20 slabs).
The Distress Density is then calculated as:
Density (%) = (Measured Quantity / Sample Unit Area) × 100
For AC area-based measurements: Density = (sq ft of distress / sq ft of sample unit) × 100. For AC linear-based measurements: Density = (linear ft of distress × 1 ft width / sq ft of sample unit) × 100 — the standard assumes a nominal 1-foot width for linear measurements to convert length to area-equivalent for density calculation. For count-based measurements (potholes): Density = (number of potholes × 1 sq ft / sq ft of sample unit) × 100 — each pothole is assumed to represent 1 square foot of area-equivalent for density purposes. For PCC slab distresses: Density = (number of affected slabs / total number of slabs in sample unit) × 100.
Deduct Value Curves
The Deduct Value (DV) is the number of PCI points deducted from a perfect score of 100 for a specific combination of distress type, severity level, and density. The deduct value curves are the mathematical heart of the ASTM D6433 PCI methodology — they transform the three-dimensional field observation (distress type, severity, density) into a single numerical deduction that reflects the engineering significance of that distress.
ASTM D6433 publishes deduct value curves for each distress type at each severity level. For AC pavements, there are 57 curves (19 distress types × 3 severity levels, with Polished Aggregate having no curve because it is recorded as present/absent with a fixed deduct value). For PCC pavements, there are 38 curves (15 distress types × 3 severity levels minus distresses with no severity levels). Each curve plots Distress Density (%) on the horizontal axis (from 0 to 100%) against Deduct Value on the vertical axis (from 0 to approximately 100). The curves are nonlinear — a 5% density of Low severity alligator cracking might yield a deduct value of 12, while the same 5% density at High severity might yield a deduct value of 38. The curves are developed from empirical data collected by the U.S. Army Corps of Engineers through thousands of field surveys correlating observed distress with pavement condition as judged by experienced pavement engineers.
The deduct value curves are published in Appendix C of the standard (for U.S. Army Corps of Engineers TM 5-623 format) and in the ASTM D6433 Annex. The curves are specific to each distress type because the same density of different distress types has different implications for pavement condition. For example, at 10% density: Alligator Cracking (fatigue failure indicator) has a much higher deduct value than Block Cracking (thermal indicator) at the same severity level, because fatigue cracking directly reflects structural damage while block cracking is primarily an environmental/material issue.
To use the deduct value curves: (1) compute the distress density as described above; (2) locate the density value on the horizontal axis of the appropriate curve (specific distress type and severity level); (3) project vertically to the severity curve; (4) project horizontally to the left axis to read the deduct value; (5) record the deduct value for that distress entry. For Polished Aggregate (AC-12) , which has no density-based curve, the standard assigns a fixed deduct value of 0 when recorded as absent and 25 when present at any level (per the latest D6433 revision).
Corrected Deduct Value (CDV)
The Corrected Deduct Value (CDV) is the critical adjustment that prevents the PCI calculation from over-penalizing a sample unit with multiple distresses. The raw sum of all individual deduct values (the Total Deduct Value or TDV) would overstate the true condition impact because the first distress in a sample unit causes the most significant degradation, while each additional distress has a diminishing marginal impact — a sample unit with alligator cracking, rutting, and patching is not simply the sum of the individual deduct values.
The CDV is determined through an iterative procedure:
Step 1: Sort all individual deduct values in descending order from highest to lowest.
Step 2: Determine the maximum number of deducts (m) allowed for this set. The value of m is determined from the highest individual deduct value (HDV) using the formula: m = 1 + (9/98) × (100 - HDV), which is rounded to the nearest integer. The maximum value of m is limited to 10. This formula ensures that sample units with a single severe distress (high HDV) use fewer deducts in the iteration, while sample units with many minor distresses (low HDV) can use more deducts.
Step 3: Create the iteration set: take the sorted deduct values and include only the largest m values. If there are fewer than m deduct values, include all of them. Append a fixed placeholder value of 2.0 for the remaining entries to fill the set to exactly m values.
Step 4: Compute the Total Deduct Value (TDV) for this iteration by summing all values in the set.
Step 5: Look up the CDV from the Corrected Deduct Value curves (published in the standard Appendix C) by locating the TDV on the vertical axis and projecting to the appropriate q curve, where q is the number of individual deduct values in the current iteration set that are greater than 5.0. Read the CDV from the horizontal axis.
Step 6: Reduce m by 1 (m = m - 1) and repeat Steps 3 through 5. Continue iterating until m reaches 1.
Step 7: The CDV for the sample unit is the maximum CDV obtained across all iterations.
This iterative procedure is computationally intensive by hand (which is why electronic calculation tools like MicroPAVER, Stantec’s PCI software, and mobile inspection apps are widely used), but it produces a CDV that accurately reflects the true engineering impact of the observed distresses. The CDV correction prevents a sample unit with many minor distresses from receiving an unrealistically low PCI, while ensuring that a sample unit with a single critical distress is properly penalized.
PCI Calculation Steps
The complete PCI calculation for a sample unit follows five sequential steps:
Step 1 — Field Data Collection: Inspect the sample unit and record all distress entries. Each entry consists of: Distress Type (from the 19 AC types or 15 PCC types), Severity Level (L, M, or H), and Quantity (in sq ft, linear ft, or count). A single sample unit may contain multiple entries of the same distress type at different severity levels — for example, 50 sq ft of Low-severity alligator cracking and 20 sq ft of High-severity alligator cracking are recorded as two separate entries, because each severity-density combination has a different deduct value.
Step 2 — Compute Deduct Values: For each distress entry, compute the Distress Density using the appropriate formula for the measurement unit. Locate each density-severity combination on the appropriate deduct value curve and read the Deduct Value (DV). Record all DVs for the sample unit.
Step 3 — Compute Total Deduct Value (TDV): Sum all individual Deduct Values to obtain the TDV.
Step 4 — Compute Corrected Deduct Value (CDV): Apply the iterative CDV procedure described above, using the CDV curves for the appropriate pavement type (AC or PCC). The CDV curves are different for AC and PCC pavements because the interaction between distress types differs between flexible and rigid pavements.
Step 5 — Calculate PCI: PCI = 100 - CDV_max, where CDV_max is the maximum CDV obtained from all iterations of Step 4. The PCI is reported as an integer between 0 and 100 (rounded to the nearest whole number).
A detailed example from the standard: A 2,500 sq ft AC sample unit has 6 sq ft of Low-severity alligator cracking (density = 0.24%, DV = 4), 16 sq ft of Medium-severity alligator cracking (density = 0.64%, DV = 17), and 50 sq ft of Low-severity rutting (density = 2.0%, DV = 13). TDV = 4 + 17 + 13 = 34. For the CDV iteration: m = 1 + (9/98) × (100 - 17) = 8.6, rounded to 9. With only 3 deduct values, q = 3. From the AC CDV curve: TDV = 34 and q = 3 gives CDV = 24. PCI = 100 - 24 = 76 (Satisfactory). Note that this CDV (24) is significantly lower than the TDV (34) — the correction reduced the deduction by 10 points, illustrating the diminishing marginal impact of multiple distresses.
For Section PCI calculation, the PCI of the Section is the area-weighted average of the PCI of all surveyed sample units (both random and additional units are included), provided that the random units provide adequate statistical confidence. The standard also recommends computing the standard deviation of the sample unit PCI values within the Section and reporting the 95% confidence interval for the Section PCI. If the confidence interval exceeds ±5 PCI points, additional sample units should be surveyed.
PCI Rating Scale
The Pavement Condition Index is a dimensionless number from 0 to 100. ASTM D6433 defines a 7-level verbal rating scale that maps to specific PCI ranges, providing a standardized language for communicating condition between engineers, asset managers, elected officials, and the public.
PCI Range
Condition Rating
Typical Maintenance Action
86–100
Good
Routine monitoring. No maintenance action required.
The condition ratings guide the type and urgency of maintenance intervention. Pavements in the Good to Satisfactory range (PCI 71-100) are candidates for preventive maintenance — treatments that preserve the existing pavement structure and extend service life at relatively low cost. Seal coats, microsurfacing, thin overlays (1 to 2 inches), and crack sealing are typical preventive treatments applied in this range. The cost per square yard for preventive maintenance is typically $2 to $8 (2024 USD), compared to $15 to $40 for major rehabilitation and $50 to $100+ for reconstruction.
Pavements in the Fair range (PCI 56-70) are candidates for minor rehabilitation — treatments that restore some structural capacity and address surface distresses. Mill-and-fill overlays (2 to 3 inches), hot in-place recycling, and heavy crack sealing with patching are typical treatments. At PCI 60, the pavement has consumed approximately 40% of its structural life on average, and rehabilitation at this stage is approximately 3 to 4 times more cost-effective than waiting until the PCI drops below 40.
Pavements in the Poor to Very Poor range (PCI 26-55) require major rehabilitation — structural overlays (4 to 6 inches), cold in-place recycling, full-depth reclamation, or partial reconstruction. At PCI 40, the pavement condition is at a tipping point where preventive treatments are no longer effective and only structural interventions can restore adequate performance. Waiting until PCI drops below 40 means that the pavement deterioration rate accelerates exponentially — the time to transition from PCI 40 to PCI 20 is often 2 to 3 times faster than from PCI 70 to PCI 50.
Pavements in the Serious to Failed range (PCI 0-25) require complete reconstruction — removal and replacement of the existing pavement structure. At these PCI levels, the pavement exhibits extensive structural failures (deep alligator cracking, base failures, significant rutting with structural deformation, multiple potholes) that cannot be cost-effectively repaired through overlay or patching.
The PCI rating scale also provides a basis for network-level performance targets. Many transportation agencies set a minimum acceptable PCI threshold (typically 55 to 70 depending on road classification — higher for arterials, lower for local roads) and use the PCI to track progress toward maintaining the network above that threshold. The PCI distribution across a network — the percentage of lane-miles in each condition category — is a standard performance metric reported in annual pavement condition reports and required for compliance with federal and state performance management regulations (e.g., MAP-21, FAST Act in the United States).
ASTM D6433 and TarmacView Proxy
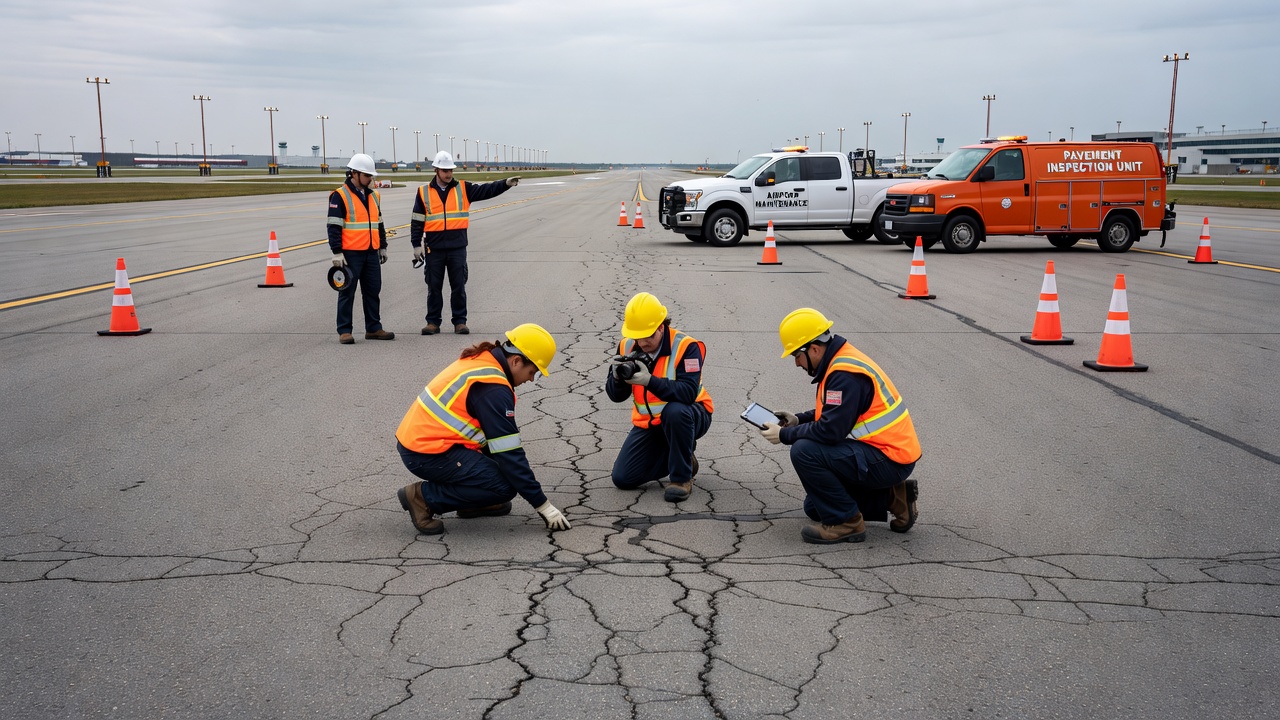
TarmacView produces a visual proxy PCI that is statistically correlated to the ASTM D6433 methodology but derived from automated image analysis rather than manual field inspection. This proxy is designed to address the fundamental limitations of traditional PCI surveys: high cost ($500 to $2,000 per lane-mile for manual inspections), low frequency (typically every 2 to 5 years for most agencies), and significant inspector variability (inter-rater variability of ±5 to ±10 PCI points between different inspectors surveying the same sample unit).
The TarmacView approach uses computer vision models trained on thousands of pavement images with ground-truth labels from certified ASTM D6433 PCI inspectors. The image data is collected using vehicle-mounted camera systems (typically 4K or higher resolution forward-facing and downward-facing cameras) that capture continuous pavement imagery at highway speeds. The imagery is processed through a pipeline of: (1) semantic segmentation models that identify pavement surface regions and exclude non-pavement areas (curbs, gutters, lane markings, shadows); (2) distress detection models that identify and classify distress types (trained to detect the 19 AC distress types and 15 PCC distress types defined in ASTM D6433); (3) severity estimation models that assign Low, Medium, or High severity levels based on visual features (crack width, spalling extent, deformation depth); and (4) density estimation models that compute the percentage of the imaged area affected by each distress-severity combination.
The PCI proxy is computed using a simplified deduct value algorithm that approximates the full ASTM D6433 deduct value and CDV procedure. The algorithm uses the same 19/15 distress type catalogs and the same severity level definitions as the standard, but the deduct values are derived from machine learning regression rather than the published deduct value curves. The CDV is computed using a neural network approximation of the iterative CDV procedure, enabling real-time PCI calculation as the imagery is processed. The proxy PCI values are calibrated against ground-truth ASTM D6433 PCI values from a validation dataset of at least 500 sample units representing the full range of pavement conditions (PCI 10 to 100).
Important differences between the TarmacView PCI proxy and full ASTM D6433 PCI:
Characteristic
ASTM D6433 PCI
TarmacView PCI Proxy
Data Collection
Manual field inspection by trained inspectors
Automated image capture at driving speed
Distress Identification
Human visual identification and judgement
Computer vision model prediction
Measurement
Manual tape, ruler, visual estimation
Pixel-level image analysis
Deduct Values
Published curves in ASTM standard
ML-derived approximation
CDV Procedure
Manual iterative calculation
Neural network approximation
Accuracy
±2-5 PCI points (trained inspectors)
±5-10 PCI points (correlated to ground truth)
Inspection Frequency
Every 2-5 years
As frequently as monthly/quarterly
Cost per Lane-Mile
$500-$2,000
$50-$200
Coverage
Statistical sampling (5-8 units per section)
Continuous (every foot of pavement)
Formal Compliance
Full ASTM compliance
Visual proxy — not ASTM compliant
The TarmacView PCI proxy is suitable for: network-level screening to identify pavement sections requiring detailed inspection; frequent condition monitoring to track deterioration rates between formal PCI surveys; budget planning and maintenance prioritization with annual updates; and performance tracking for pavement management systems. It is not suitable for: projects requiring formal ASTM D6433 compliance (e.g., FAA-funded airport projects, legally mandated condition reporting, or construction warranty evaluations); forensic investigations where precise distress quantification is required; or pavement sections with complex distress patterns that fall outside the training dataset.
For agencies that require full ASTM D6433 compliance, TarmacView provides a hybrid workflow: the automated analysis identifies sample units and provides preliminary PCI values, which are then verified and validated by a certified PCI inspector who reviews the automated results and adjusts as needed. This hybrid approach reduces field inspection time by 50 to 70% while maintaining ASTM D6433 compliance, delivering the best balance of speed, cost, and accuracy.
Ultimately, ASTM D6433 remains the gold standard for pavement condition assessment worldwide. The TarmacView visual proxy extends the reach of this methodology by making PCI-based condition assessment accessible at a frequency and cost that was previously impossible with manual inspection alone. The proxy does not replace the standard — it complements it by enabling more frequent, more granular, and more cost-effective condition data collection, while the full ASTM D6433 procedure is reserved for formal condition assessment and compliance applications.
Frequently Asked Questions
ASTM D6433, titled 'Standard Practice for Roads and Parking Lots Pavement Condition Index Surveys,' is the primary international standard for conducting visual pavement condition assessments. It establishes a complete methodology that includes defining a pavement network hierarchy (Branch-Section-Sample Unit), conducting visual surveys to identify 19 distress types for asphalt concrete (AC) pavements and 15 distress types for Portland cement concrete (PCC) pavements, rating each distress at Low, Medium, or High severity levels, measuring distress quantities, converting measurements to deduct values using published curves, computing the Corrected Deduct Value (CDV) through an iterative procedure, and calculating the Pavement Condition Index (PCI) as 100 minus the maximum CDV. The PCI score ranges from 0 (Failed) to 100 (Good). The standard is used by municipalities, departments of transportation, military installations, airports, and private asset managers for network-level pavement management, maintenance prioritization, budget allocation, and rehabilitation planning.
ASTM D6433 defines 19 distress types for asphalt concrete (AC) surfaced roads and parking lots. These are: (01) Alligator (Fatigue) Cracking, (02) Bleeding, (03) Block Cracking, (04) Bumps and Sags, (05) Corrugation, (06) Depression, (07) Edge Cracking, (08) Joint Reflection Cracking, (09) Lane/Shoulder Drop-Off, (10) Longitudinal and Transverse Cracking, (11) Patching and Utility Cut Patching, (12) Polished Aggregate, (13) Potholes, (14) Railroad Crossing, (15) Rutting, (16) Shoving, (17) Slippage Cracking, (18) Swell, and (19) Weathering and Raveling. Each distress type has specific measurement units (square feet, linear feet, or count), severity level definitions (Low, Medium, High), and its own set of deduct value curves. Polished Aggregate (distress 12) is the only type with no defined severity levels per ASTM D6433 — it is recorded as present or absent.
ASTM D6433 defines 15 distress types for Portland cement concrete (PCC) surfaced roads and parking lots. These are: (21) Blow-Up/Buckling, (22) Corner Break, (23) Divided Slab, (24) Durability ('D') Cracking, (25) Faulting, (26) Joint Seal Damage, (27) Lane/Shoulder Drop-Off, (28) Linear Cracking, (29) Patching (Large) and Utility Cut Patching, (30) Patching (Small), (31) Polished Aggregate, (32) Popouts, (33) Pumping, (34) Punchout (CRCP only), (35) Railroad Crossing, (36) Scaling/Map Cracking/Crazing, (37) Shrinkage Cracks, (38) Spalling (Corner), and (39) Spalling (Joint). The numbering starts at 21 to distinguish from the AC distress types. Key differences from AC pavements include: quantities are measured primarily by counting affected slabs rather than area; Joint Seal Damage is rated by overall condition rather than density; and some distresses (like Punchout) apply only to Continuously Reinforced Concrete Pavement (CRCP). The PCI rating scale thresholds also differ slightly between AC and PCC pavements.
The PCI calculation in ASTM D6433 follows a five-step process. Step 1: Inspect each sample unit and record distress types, severity levels (Low, Medium, High), and quantities (in square feet, linear feet, or count depending on distress type). Step 2: Compute Distress Density for each distress entry by dividing the measured quantity by the total sample unit area and multiplying by 100. Then use the standardized deduct value curves (published in the ASTM standard appendices) to determine the Deduct Value (DV) for each distress type-severity-density combination. Step 3: Sum all individual deduct values to obtain the Total Deduct Value (TDV). Step 4: Determine the Corrected Deduct Value (CDV) using the correction curves — an iterative procedure that progressively reduces the number of deducts (m) with values above 5, computes a new TDV for each iteration, and reads the CDV from the correction curve. Step 5: Calculate PCI = 100 - CDV_max, where CDV_max is the maximum CDV obtained across all iterations. The resulting PCI is a number between 0 (Failed) and 100 (Good).
ASTM D6433 defines a 7-level verbal rating scale that maps to specific PCI ranges. Good (PCI 86-100): Routine monitoring only, no maintenance action required. Satisfactory (PCI 71-85): Preventive maintenance such as seal coats and crack sealing. Fair (PCI 56-70): Minor rehabilitation or targeted surface repairs. Poor (PCI 41-55): Major rehabilitation or structural overlay required. Very Poor (PCI 26-40): Structural rehabilitation or partial reconstruction. Serious (PCI 11-25): Reconstruction necessary, safety hazards likely present. Failed (PCI 0-10): Complete failure, immediate reconstruction required. These ranges follow the ASTM D6433 standard 7-level scale. The PCI value is dimensionless — it represents the pavement condition based on visible surface distress but does not directly measure structural capacity, skid resistance, or roughness. Most pavement management systems use the PCI to trigger maintenance actions: preventive treatments are cost-effective above PCI 70, while below PCI 40 only major rehabilitation or reconstruction restores structural adequacy.
TarmacView produces a visual proxy PCI that is correlated to the ASTM D6433 methodology but derived from automated image analysis rather than manual field inspection. While the ASTM D6433 standard requires trained inspectors to walk sample units, measure distress quantities manually, and compute PCI using the full deduct value procedure, TarmacView uses computer vision and machine learning models trained on thousands of pavement images to detect and classify distress types, estimate severity levels, and compute a PCI score algorithmically. The TarmacView PCI proxy is calibrated against ASTM D6433 PCI values from ground-truthed survey data to ensure statistical correlation. This approach enables: (1) much higher inspection frequency at lower cost, (2) consistent and repeatable results without inspector variability, (3) faster network-wide assessments, and (4) integration with pavement management systems. However, TarmacView's PCI proxy is a visual estimate — it does not replace the full ASTM D6433 procedure for projects requiring formal D6433 compliance, such as FAA-funded airport projects or legally mandated condition reporting.
ASTM D6433 organizes a road network into a three-level hierarchy: Branch, Section, and Sample Unit. A Branch is typically a single road or street identified by name or route number (e.g., 'Main Street'). Each Branch is divided into one or more Sections — contiguous segments sharing the same construction history, traffic volume, surface type, and condition. Sections are the level at which PCI is reported and maintenance decisions are made. Each Section is further divided into Sample Units — the actual areas that inspectors walk and survey. For asphalt concrete (AC) roads, a sample unit is approximately 2,500 square feet (±1,000 sq ft), which typically corresponds to one lane width multiplied by a length of about 100 feet. For Portland cement concrete (PCC) roads, a sample unit is approximately 20 contiguous slabs (±8 slabs). The standard provides formulas for calculating the minimum number of random sample units to inspect per Section to achieve a 95% confidence level for the Section PCI. Non-representative sample units (e.g., an area with a utility cut that is not typical of the section) can be surveyed as additional 'additional' units and are reported separately.
Need professional pavement condition assessment?
TarmacView provides comprehensive pavement inspection services with ASTM D6433-compliant PCI surveys using advanced visual data collection technology. Our platform delivers PCI proxy values correlated to the D6433 methodology, enabling faster, more frequent, and cost-effective condition assessments for roads, parking lots, and airfield pavements.
The Pavement Condition Index (PCI) is a numerical indicator from 0 (failed) to 100 (excellent) that rates pavement surface condition based on observed distress ...
The Pavement Condition Index (PCI) is a numerical rating from 0 (failed) to 100 (excellent) that quantifies pavement surface condition based on observed distres...
A pavement distress survey systematically identifies, classifies, and measures each distress type, severity, and extent on a pavement section following standard...
19 min read
Pavement Condition
PCI Survey
+2
Cookie Consent We use cookies to enhance your browsing experience and analyze our traffic. See our privacy policy.