California Bearing Ratio (CBR) for Pavement Foundation Design
The California Bearing Ratio (CBR) is a penetration test that measures the strength of subgrade soil, subbase, and base materials relative to a standard crushed stone, expressed as a percentage. CBR values are a primary input for empirical flexible pavement thickness design per FAA AC 150/5320-6G, AASHTO, and ICAO standards.
California Bearing Ratio (CBR) — Definition and History
The California Bearing Ratio (CBR) is a standardized penetration test that quantifies the shear strength and load-bearing capacity of subgrade soils, subbase, and base course materials used in pavement construction. The test result is expressed as a percentage — the ratio of the force required to drive a cylindrical plunger into the test material at a specified rate, compared to the force required to achieve the same penetration into a standard sample of high-quality crushed stone. By definition, standard crushed stone has a CBR of 100%.
The CBR test was developed between 1928 and 1929 by O.J. Porter, a materials and research engineer with the California Division of Highways (now Caltrans). Porter was tasked with developing a rational method for determining the thickness of pavement layers required to prevent subgrade failure under increasing traffic loads. His approach was elegantly simple: measure the resistance of the soil to penetration by a small plunger under controlled conditions, and express that resistance relative to a stable, well-understood reference material — crushed stone. The original apparatus used a plunger with a cross-sectional area of 3 square inches (19.4 cm²), driven at a penetration rate of 0.05 inches per minute (1.27 mm/min). The standard reference force was established at 1,000 psi at 0.1 inches of penetration — the resistance exhibited by well-graded, high-quality crushed stone.
Porter’s test gained rapid acceptance within California and began spreading to other state highway departments throughout the 1930s. The critical turning point for CBR came during World War II. The U.S. Army Corps of Engineers (USACE) was tasked with rapidly constructing military airfields across diverse terrain — from the jungles of the Pacific to the deserts of North Africa — to support the Allied air campaign. The Corps assembled a team including Porter, Arthur Casagrande, Donald Middlebrooks, and Roy Bertram to develop a practical design method for airfield pavements that could support the heavy wheel loads of B-17 Flying Fortress bombers (gross weight approximately 60,000 lbs, or 27,200 kg). The team adopted Porter’s CBR test as the foundation of the design method, extrapolating the original highway design curves to aircraft loads through a series of accelerated traffic tests.
The USACE research produced the first comprehensive CBR design curves for airfield pavements, published in 1944 as Technical Memorandum No. 213-1. These curves related subgrade CBR value, aircraft wheel load, tire pressure, and number of load applications to the required pavement thickness. The design method was validated through full-scale accelerated traffic testing using actual aircraft and heavy military vehicles, demonstrating that pavements designed using the CBR method performed as predicted under repeated loading. The USACE work extended the CBR method from highway loads (5,000 to 10,000 lbs wheel loads) to aircraft loads reaching 60,000 lbs per wheel — an order of magnitude increase that required extrapolation of the original Porter curves. Subsequent accelerated traffic tests at the USACE Waterways Experiment Station (WES) in Vicksburg, Mississippi, validated the design curves for aircraft wheel loads up to 200,000 lbs, confirming the fundamental soundness of the CBR approach.
Following World War II, the CBR test was formalized as a standard test method through the American Society for Testing and Materials (ASTM) as ASTM D1883, and through the American Association of State Highway and Transportation Officials (AASHTO) as AASHTO T193. The International Civil Aviation Organization (ICAO) adopted the CBR method for airfield pavement design in its Aerodrome Design Manual — Part 3, Pavements (ICAO Doc 9157), and the Federal Aviation Administration (FAA) incorporated CBR into its Advisory Circular 150/5320 series for airport pavement design. Despite the development of more sophisticated mechanistic-empirical design methods — including layered elastic analysis (LEA) used in FAA’s FAARFIELD software since 2009 — CBR remains the primary input parameter for subgrade strength characterization in virtually all pavement design codes worldwide.
CBR Test Procedure — ASTM D1883 and AASHTO T193
The CBR test procedure is rigorously defined in ASTM D1883 (Standard Test Method for California Bearing Ratio of Laboratory-Compacted Soils) and AASHTO T193 (California Bearing Ratio). The two standards are technically equivalent with minor procedural differences. The test is performed on soil samples compacted into a standard cylindrical mold at a specified moisture content and density, then subjected to penetration by a standard piston. The complete procedure includes the following sequential steps:
Sample preparation begins with the soil being air-dried and processed through a 19.0 mm (3/4-inch) sieve to remove oversized particles. Material retained on the 19.0 mm sieve is replaced with an equal mass of material passing the sieve but retained on the 4.75 mm (No. 4) sieve, ensuring the sample’s gradation remains representative. The optimum moisture content (OMC) and maximum dry density (MDD) are determined using ASTM D698 (Standard Proctor) compaction — a 5.5 lb hammer dropped 12 inches with three layers and 25 blows per layer, unless the material requires the modified Proctor effort (ASTM D1557, 10 lb hammer, 18-inch drop) for higher-density applications such as airport base courses.
The sample is mixed with sufficient water to achieve the target moisture content — typically OMC ± 1% for the design condition. The moist soil is placed in a sealed container and allowed to cure for a minimum of 16 hours (overnight) to ensure uniform moisture distribution throughout the sample. For base course materials and untreated aggregates, the curing period may be reduced to 1 to 3 hours as specified in the project quality control plan.
Compaction is performed in the standard CBR mold — a cylindrical steel container 152.4 mm (6.0 inches) in diameter and 177.8 mm (7.0 inches) in height, with a removable collar extension that allows compaction to produce a specimen height of approximately 127 mm (5.0 inches) after the collar is removed and the sample is trimmed flush with the mold top. The mold includes a perforated base plate to allow drainage during soaking and a spacer disk (approximately 61.3 mm or 2.42 inches thick) placed at the bottom during compaction to create a void beneath the sample for subsequent swell measurement.
The compacted specimen is compacted in five equal layers, each receiving 55 blows of the 5.5 lb (2.5 kg) compaction hammer dropped from 304.8 mm (12 inches), applied uniformly across the mold surface (Standard Proctor effort). For materials requiring Modified Proctor effort, the specimen is compacted in five layers with 56 blows per layer using the 10 lb (4.54 kg) hammer dropped from 457 mm (18 inches). The compacted specimen height should be 127 ± 2.5 mm (5.0 ± 0.1 inches) after trimming.
Soaking is the most critical phase of the CBR test for pavement design. After compaction, the mold assembly (including the perforated base plate and a filter paper) is placed in a water tank, and a surcharge weight of 4.54 kg (10 lbs) is placed on top of the sample to simulate the overburden pressure of the overlying pavement layers. The surcharge weight ensures the sample remains stable during soaking and represents the confining pressure the subgrade will experience under the actual pavement structure. Water is admitted to the tank to submerge the sample to a depth of approximately 25 mm (1 inch) above the top surface.
The sample is allowed to soak for 96 hours (4 days) — a duration established by decades of experience correlating 4-day soaked CBR values with field pavement performance. During soaking, swell measurements are taken using a swell plate and dial gauge assembly. Swell is the vertical expansion of the soil due to water absorption, expressed as a percentage of the initial sample height. A high swell potential indicates that the subgrade may experience significant volume change when exposed to water, leading to pavement heave and damage. For expansive clays, swell of 5% to 15% is not uncommon, and special design measures (lime stabilization, moisture barriers, or over-excavation) are required to mitigate pavement damage.
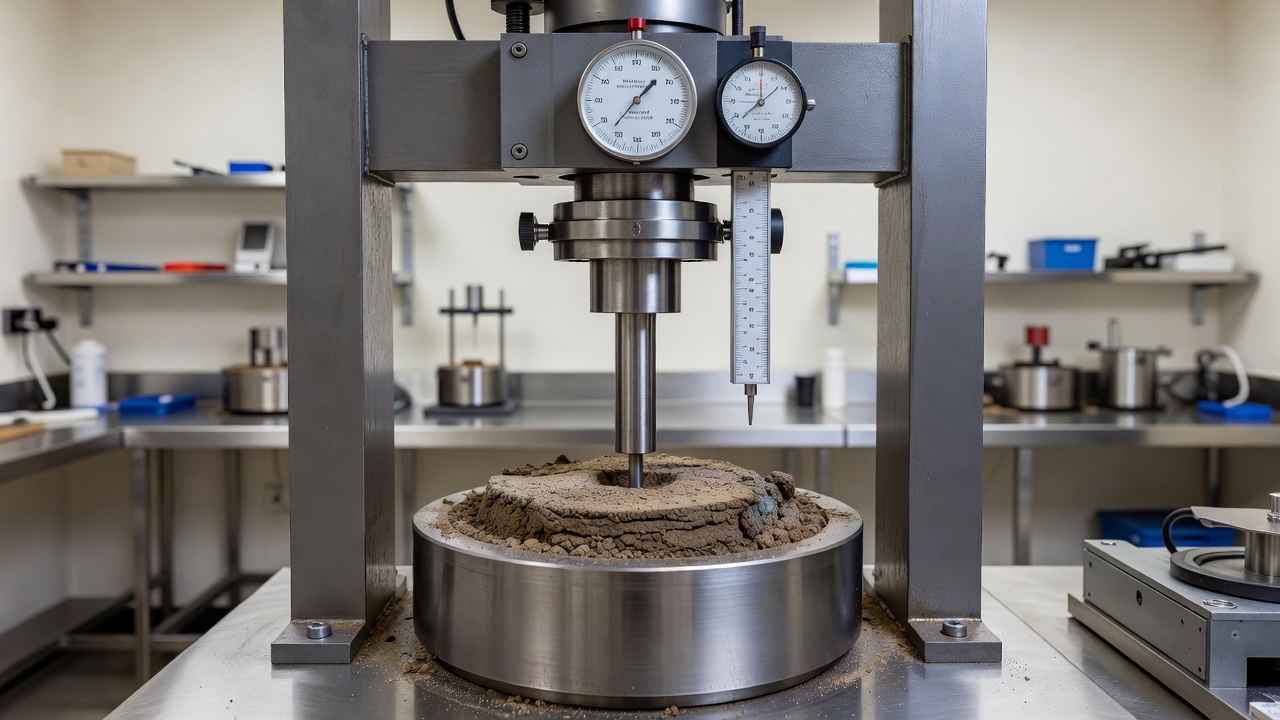
Penetration testing follows immediately after soaking. The mold assembly is removed from the water tank and allowed to drain for 15 minutes. The sample is placed in a compression testing machine (load frame) with a capacity of at least 50 kN (11,200 lbs). A penetration piston — 49.63 ± 0.13 mm (1.954 ± 0.005 inches) in diameter, giving a cross-sectional area of 1,935 mm² (3.0 square inches) — is positioned at the center of the sample surface. The piston must be clean and free of soil particles to ensure uniform bearing on the sample. An annular surcharge weight of 4.54 kg (10 lbs) — identical to the weight used during soaking — is placed on the sample around the piston to maintain confinement.
The piston is driven into the sample at a constant rate of 1.27 mm/min (0.05 in/min) — this precise penetration rate ensures that the test measures the soil’s undrained shear strength under a quasi-static loading condition, approximating the rate at which traffic loads are applied to the subgrade. Load (force) readings are recorded at penetration increments of 0.25 mm (0.01 inch) up to a total penetration of at least 12.7 mm (0.5 inch). The maximum penetration reached is typically limited to 12.7 mm unless the material is exceptionally strong, in which case the test may continue to 17.8 mm (0.7 inch).
Standard forces for the reference crushed stone material are tabulated in both ASTM D1883 and AASHTO T193. The standard force at 2.54 mm (0.1 inch) penetration is 13.34 kN (3,000 lbf) , and at 5.08 mm (0.2 inch) penetration is 20.02 kN (4,500 lbf) . These values represent the force required to drive the standard piston into high-quality crushed stone at the corresponding penetration depths.
Penetration Depth
Standard Force (kN)
Standard Force (lbf)
Standard Force (psi)
2.54 mm (0.1 in)
13.34
3,000
1,000
5.08 mm (0.2 in)
20.02
4,500
1,500
7.62 mm (0.3 in)
25.58
5,750
1,917
10.16 mm (0.4 in)
30.69
6,900
2,300
12.70 mm (0.5 in)
35.14
7,900
2,633
CBR Penetration Curve
The relationship between applied force and penetration depth is plotted to produce a CBR penetration curve (force-penetration curve). This curve is the primary data output from the CBR test and must be carefully analyzed to determine the correct CBR value.
Under ideal conditions, the force-penetration curve is a smooth, gradually increasing curve that passes through the origin (zero force at zero penetration). However, many soils — particularly compacted cohesive soils and granular materials with high compaction density — produce curves with an initial concave downward shape near the origin, indicating that the seating of the piston or the compaction of surface irregularities has artificially increased the initial slope. When this occurs, a correction to the curve origin is required.
The correction procedure involves drawing a tangent line to the steepest portion of the force-penetration curve (typically between 1.0 mm and 3.0 mm penetration). The intersection of this tangent with the zero-force axis is identified. If this intersection occurs at a penetration greater than zero (i.e., the tangent does not pass through the origin), the entire curve is shifted horizontally so that the tangent passes through the origin. This correction effectively removes the initial seating error and ensures that the CBR computation is based on the true soil resistance behavior.
After the curve correction (if required), the force values at penetrations of 2.54 mm and 5.08 mm are read directly from the corrected curve. The CBR is calculated for each penetration depth using the following formula:
CBR (%) = (Measured Force / Standard Force) × 100
For the 2.54 mm penetration: CBR₂.₅₄ = (F₂.₅₄ / 13.34 kN) × 100
For the 5.08 mm penetration: CBR₅.₀₈ = (F₅.₀₈ / 20.02 kN) × 100
The reported CBR value is the higher of the two calculated values. In virtually all cases where the test has been performed correctly and the curve correction has been properly applied, the CBR at 2.54 mm penetration governs — meaning it produces the higher value. If the CBR at 5.08 mm penetration is higher than at 2.54 mm, the test must be examined for procedural errors, material anomalies, or the need for additional curve correction.
The penetration curve also provides qualitative information about soil behavior. A steep, rapidly rising curve indicates high modulus and strength — typical of well-graded granular materials, crushed stone, and cement-treated soils. A flat, gradually rising curve indicates low modulus and strength — typical of saturated clays, silts, and organic soils. The shape of the curve between 0 and 5.08 mm penetration is particularly instructive, as it reflects the material’s stiffness at the strain levels relevant to pavement design.
For quality control testing during construction, the full penetration test to 12.7 mm may not be required. ASTM D1883 permits a simplified procedure for routine QC testing: the test is performed only to 5.08 mm (0.2 inch) penetration, and the CBR is calculated using the standard forces at 2.54 mm and 5.08 mm as described above. This streamlined approach reduces testing time while providing adequate data for daily construction control.
Soaked vs Unsoaked CBR
The choice between soaked and unsoaked CBR testing is one of the most important decisions in pavement design testing, as it directly affects the design thickness and long-term performance of the pavement structure.
Soaked CBR testing subjects the compacted sample to 96 hours (4 days) of water immersion before penetration testing. The sample is submerged under approximately 25 mm (1 inch) of water with a surcharge weight of 4.54 kg (10 lbs) on the surface. During soaking, the sample absorbs water, pore pressures equilibrate, and the soil may soften, swell, or both. The soaked CBR represents the worst-case field moisture condition — typically encountered after prolonged rainfall, rising groundwater tables, or the loss of surface sealing integrity due to pavement cracking. For pavement design, the soaked CBR is universally specified as the design CBR value for determining the thickness of new pavement structures. This conservative approach ensures that the pavement will provide adequate structural support even when the subgrade is at its weakest in-service condition.
The swell measurement taken during soaking provides critical data for pavement design. Swell is measured using a dial gauge or linear variable differential transformer (LVDT) attached to the top surcharge plate. The swell percentage is calculated as:
For highly expansive clays (CH, MH soil types per USCS), swell values of 5% to 15% are common. When swell exceeds 2%, special design provisions are required: lime stabilization to reduce swell potential; moisture barriers to prevent water ingress; undercuts and replacement with non-expansive fill; or thicker pavement sections to apply greater overburden pressure to suppress swelling. FAA AC 150/5320-6G specifies that subgrade soils with swell exceeding 2% require special treatment measures before pavement construction.
Unsoaked CBR testing is performed immediately after compaction without water immersion. The sample is penetration-tested at its compacted moisture content. Unsoaked CBR values are always higher than or equal to soaked CBR values because water absorption weakens the soil structure through several mechanisms: (1) pore pressure development reduces effective stress and shear strength; (2) clay minerals absorb water, increasing interparticle spacing and reducing cohesion; (3) cementation bonds in stabilized soils may be weakened by water ingress; and (4) granular materials lose apparent cohesion when the fine fraction becomes saturated.
The strength loss ratio — the ratio of soaked CBR to unsoaked CBR — is a useful index of a soil’s moisture sensitivity. Well-graded sands and gravels (SW, GW) may have strength loss ratios of 0.85 to 0.95, losing only 5% to 15% of their strength upon saturation. In contrast, high-plasticity clays (CH) may have strength loss ratios of 0.15 to 0.35 — losing 65% to 85% of their unsoaked strength when saturated. This dramatic strength loss explains why clay subgrades are notorious for pavement failures after extended wet periods and why soaked CBR testing is essential for design.
Soil Type
Unsoaked CBR (%)
Soaked CBR (%)
Strength Loss Ratio
Well-graded gravel (GW)
70-90
60-80
0.85-0.90
Poorly-graded sand (SP)
25-45
15-30
0.60-0.70
Silty sand (SM)
15-30
8-18
0.50-0.65
Lean clay (CL)
8-15
3-8
0.30-0.55
Fat clay (CH)
5-10
1-4
0.15-0.40
Organic silt (OH)
3-8
0.5-3
0.15-0.40
The California Department of Transportation (Caltrans) — the organization that created the CBR test — uses a variant of the soaked CBR test in which samples are compacted at optimum moisture content and soaked for 4 days, but the material is not compacted at optimum moisture content for the soaked test. Instead, Caltrans uses a procedure in which the sample is compacted at a moisture content 2% to 4% above optimum for the soaked test, simulating the condition of a subgrade that has been subjected to moisture accumulation during its service life. This procedure produces more conservative design CBR values and has been adopted by several western U.S. state highway agencies.
Typical CBR Values by Soil Type
CBR values vary dramatically across the spectrum of soil types, from less than 1% for organic soils and soft clays to over 80% for high-quality crushed aggregate base courses. Understanding the typical CBR range for each soil type is essential for preliminary pavement design, field identification of problematic subgrades, and quality assurance of construction materials.
The Unified Soil Classification System (USCS), specified by ASTM D2487, provides the standard framework for classifying soils and associating them with expected CBR ranges. The USCS divides soils into coarse-grained (gravels and sands), fine-grained (silts and clays), and highly organic (peat) categories.
Gravels (G groups) — soils with more than 50% retained on the No. 4 sieve (4.75 mm) — exhibit the highest CBR values of any natural soil type. Well-graded gravel (GW) with a good distribution of particle sizes from 75 mm down to fine sand and silt typically produces soaked CBR values of 40% to 80% . The high CBR results from excellent particle interlock, low void ratio, and high internal friction angle (φ = 40° to 50°). Poorly-graded gravel (GP) — gravel with a narrow particle size distribution — has lower particle interlock but still achieves CBR values of 30% to 60% . Silty gravel (GM) with up to 12% fines passing the No. 200 sieve produces CBR of 20% to 50% , while Clayey gravel (GC) may have CBR reduced to 15% to 40% depending on the plasticity of the clay fraction.
Sands (S groups) — soils with more than 50% passing the No. 4 sieve but more than 50% retained on the No. 200 sieve (75 μm) — produce CBR values generally lower than gravels but still adequate for most subgrade applications. Well-graded sand (SW) yields soaked CBR of 20% to 40% , while Poorly-graded sand (SP) produces 10% to 25% . Silty sand (SM) — sand with 5% to 12% non-plastic or low-plasticity fines — generates CBR of 10% to 20% . Clayey sand (SC) — sand with plastic fines — produces CBR of 5% to 15% , with the lower end corresponding to higher plasticity fines.
Silts (M groups) — fine-grained soils with liquid limit (LL) below 50 and plasticity index (PI) below the A-line — exhibit moderate to low CBR. Low-plasticity silt (ML) — rock flour, loess, or inorganic silt with LL < 50 — yields soaked CBR of 3% to 15% . High-plasticity elastic silt (MH) — micaceous or diatomaceous silt with LL > 50 — produces CBR of 2% to 8% . Silts are particularly problematic in pavement design because they are highly frost-susceptible, exhibiting significant strength loss during spring thaw when ice lenses melt and produce excess pore water pressure.
Clays (C groups) — fine-grained soils with PI above the A-line — produce the lowest CBR values of natural inorganic soils. Low-plasticity lean clay (CL) — LL < 50 — generates soaked CBR of 3% to 10% . High-plasticity fat clay (CH) — LL > 50 — yields soaked CBR of 1% to 5% . The CBR of clays is highly dependent on the compaction water content: clays compacted 2% to 3% dry of optimum may have significantly higher CBR but are prone to swelling upon moisture ingress, while clays compacted wet of optimum have lower CBR but less swell potential.
Organic soils (O groups and Peat) — soils containing organic matter — yield the lowest CBR values. Organic silt or clay (OL/OH) produces soaked CBR of 0.5% to 3% , while peat (Pt) may have CBR below 0.5% . These materials are generally unsuitable as pavement subgrades and require removal and replacement, ground improvement (stone columns, prefabricated vertical drains), or specialized foundation systems.
USCS Group
Soil Description
Typical Soaked CBR (%)
Frost Susceptibility
Pavement Suitability
GW
Well-graded gravel
40-80
Low
Excellent
GP
Poorly-graded gravel
30-60
Low
Good
GM
Silty gravel
20-50
Medium
Good
GC
Clayey gravel
15-40
Medium
Fair
SW
Well-graded sand
20-40
Low
Good
SP
Poorly-graded sand
10-25
Low
Fair
SM
Silty sand
10-20
Medium-High
Fair
SC
Clayey sand
5-15
Medium
Poor
ML
Low-plasticity silt
3-15
High
Poor
CL
Lean clay
3-10
Medium
Poor
MH
Elastic silt
2-8
High
Very Poor
CH
Fat clay
1-5
Medium
Very Poor
OL/OH
Organic soils
0.5-3
Very High
Unsuitable
Pt
Peat
<0.5
Very High
Unsuitable
CBR in Flexible Pavement Design — FAA Method
The Federal Aviation Administration (FAA) has used the CBR method as the foundation of flexible airport pavement thickness design since the 1960s, when the first FAA pavement design advisory circular was published. The current design procedure is defined in FAA Advisory Circular AC 150/5320-6G — Airport Pavement Design and Evaluation, issued in June 2021, which supersedes all previous versions. The design is performed using FAARFIELD (FAA Rigid and Flexible Iterative Elastic Layered Design) version 2.0 software, which employs layered elastic theory (LET) rather than the traditional CBR design curves used in earlier versions (AC 150/5320-6F and earlier).
Despite the shift to layered elastic analysis, CBR remains the fundamental input parameter for subgrade strength characterization in FAARFIELD. The software provides two methods for defining subgrade strength: direct input of the resilient modulus (Mr) if laboratory test data is available, or estimation of Mr from the design CBR value using the Heukelom and Klomp correlation: Mr (psi) = 1,500 × CBR (for fine-grained soils with CBR ≤ 10). For higher CBR values, FAARFIELD internally applies the Powell et al. correlation: Mr (psi) = 2,550 × CBR^0.64.
The FAA design procedure for flexible pavements with FAARFIELD involves the following steps:
Step 1: Determine the design subgrade CBR. The design CBR value is established through a geotechnical investigation program that includes soil borings, sampling, and laboratory CBR testing (ASTM D1883, 4-day soaked) at representative locations along the proposed pavement alignment. For runway and taxiway projects, borings are typically spaced at 150 m (500 ft) intervals along the centerline and at edge locations, with additional borings at areas of suspected subgrade variability. The resulting CBR values are plotted as a function of station along the alignment. The design CBR is selected as the 90th to 95th percentile value — meaning that 90% to 95% of the tested locations have a CBR equal to or greater than the design value. This statistical approach ensures that the pavement structure is adequate for the majority of the subgrade conditions encountered, while accepting that a small percentage of weaker areas will require individual treatment (e.g., over-excavation and replacement, stabilization, or geotextile reinforcement).
Step 2: Define the design aircraft and traffic. The pavement must be designed for the critical design aircraft — the aircraft type that produces the greatest pavement thickness requirement. For commercial service airports, the critical aircraft is typically the most demanding aircraft type expected to conduct 500 or more annual departures. The FAARFIELD software accepts inputs including: aircraft type (from the built-in aircraft library covering all commercial and military types from Cessna 172 to Airbus A380); annual departure levels (500, 1,500, 5,000, 10,000, 20,000+); and gear configuration (single-wheel, dual-wheel, dual-tandem, dual-tandem with twin tricycle, triple-dual tandem, etc.).
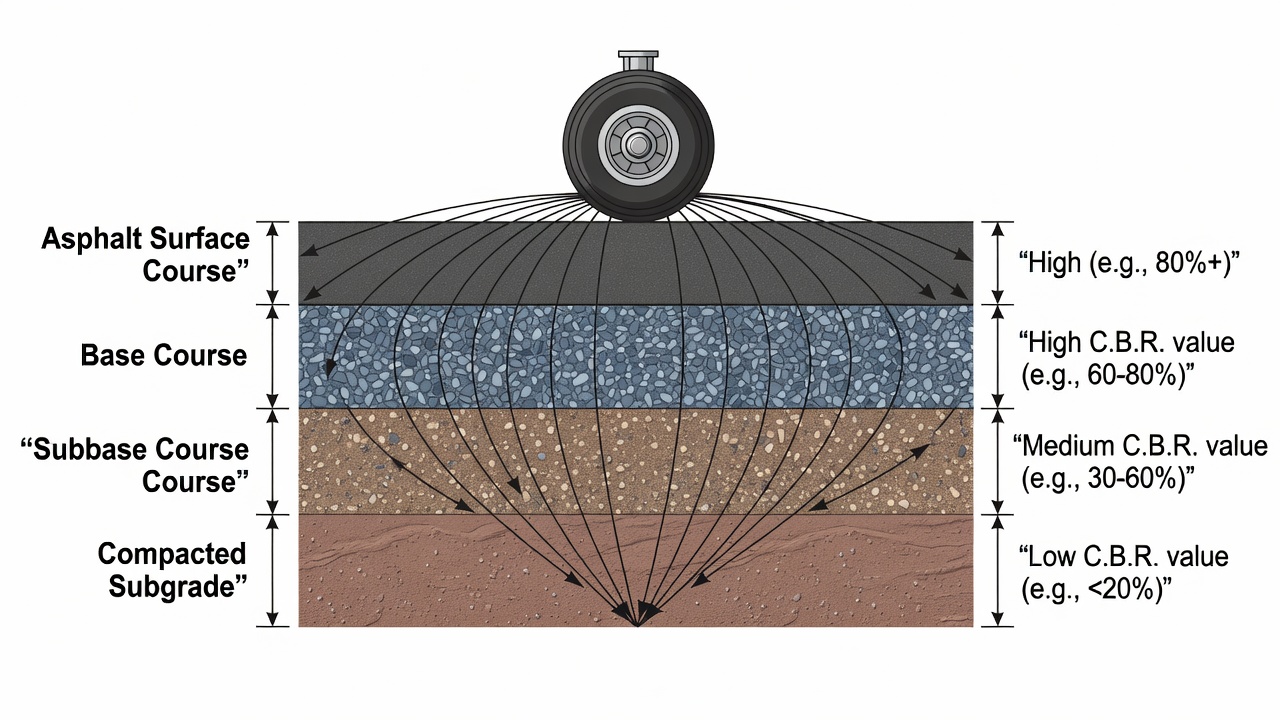
Step 3: Input layer properties. FAARFIELD requires input of the resilient modulus (or CBR-based estimate) for each pavement layer: subgrade (design CBR value), subbase (typically CBR 15 to 30 for untreated materials, or modulus 100 to 300 MPa for treated materials), base course (CBR 20 to 80 for unbound aggregate, or modulus 200 to 6,900 MPa for stabilized materials), and asphalt surface (modulus 1,000 to 3,500 MPa depending on temperature, asphalt binder grade, and mix properties).
Step 4: Iterative thickness computation. FAARFIELD computes the critical stresses and strains at the interfaces between pavement layers using Boussinesq elastic theory extended for multiple layers (Burmister solution). The critical design criteria for flexible pavements are the horizontal tensile strain at the bottom of the asphalt surface layer (controlling fatigue cracking) and the vertical compressive strain at the top of the subgrade (controlling subgrade rutting). The software iteratively adjusts layer thicknesses until the computed strains at the design traffic level are less than the allowable strains. The allowable strain relationships are based on full-scale accelerated pavement testing (APT) data from the FAA’s National Airport Pavement Test Facility (NAPTF) at the William J. Hughes Technical Center in Atlantic City, New Jersey.
For airport development projects where FAARFIELD software is not available, the FAA provides standard design curves in Appendices of AC 150/5320-6G that relate CBR to required total pavement thickness for various aircraft types and annual departure levels. These curves are derived from layered elastic analysis using the same failure criteria as FAARFIELD and can be used for preliminary design, design verification, and projects where the software is not accessible.
The subbase layer in FAA design is typically constructed with material having a CBR of at least 15. The base course (per FAA Item P-208 or P-209 for aggregate base, or P-210 for cement-treated base) must have a minimum CBR of 20 for P-208 and 30 for P-209, verified through laboratory testing. The total pavement structure thickness — including surface, base, and subbase — is determined by FAARFIELD such that the vertical stress on the subgrade does not exceed the subgrade bearing capacity, which is a function of the design CBR. The subgrade stress ratio — the ratio of applied stress to subgrade bearing capacity — is typically limited to 0.5 to 0.7 for flexible pavements, depending on traffic level and reliability.
CBR and Subgrade Strength Classification
CBR values form the basis of subgrade strength classification systems used by pavement design agencies worldwide. The FAA AC 150/5320-6G classifies subgrade strength into four categories based on CBR:
FAA Subgrade Class
CBR Range (%)
Description
Typical Soil Types
Design Implications
High (H)
> 15
High-strength subgrade
GW, GP, SW, well-compacted SM
Minimum pavement thickness required
Medium (M)
8 - 15
Medium-strength subgrade
SP, SM, CL (low PI), GM
Moderate pavement thickness
Low (L)
4 - 8
Low-strength subgrade
ML, CL (high PI), SC, MH
Significant pavement thickness required
Ultra-Low (UL)
< 4
Very low-strength subgrade
CH, OH, OL, Pt
Subgrade improvement required before paving
The ICAO Aerodrome Design Manual — Part 3 (Doc 9157) employs an equivalent classification system with subgrade strength categories directly linked to CBR ranges for international consistency. The categories are identical to the FAA system: High (CBR > 15), Medium (CBR 8 to 15), Low (CBR 4 to 8), and Ultra-Low (CBR < 4). This classification is used not only for thickness design but also for selecting the appropriate PCN (Pavement Classification Number) reporting code for strength. For rigid (concrete) pavements, the subgrade strength is classified as A (High), B (Medium), C (Low), or D (Ultra-Low) with the same CBR boundaries, expressed in terms of the effective modulus of subgrade reaction (k-value) for concrete pavement design.
The correlation between CBR and modulus of subgrade reaction (k-value) for rigid pavement design is established through the formula:
k (pci) = CBR × 7.5 (approximate, for fine-grained subgrades)
For example, a subgrade with CBR 6 yields k = 45 pci (pounds per cubic inch), while CBR 15 yields k = 113 pci. The k-value is used in rigid (concrete) pavement thickness design using the FAARFIELD rigid pavement module or the Westergaard stress equations for concrete slab design.
The California Department of Transportation (Caltrans) uses the R-value (Resistance Value) — also known as the Stabilometer R-value — instead of CBR for pavement design. While the CBR measures penetration resistance, the R-value measures lateral pressure resistance under a vertical load using the Hveem stabilometer. A correlation between R-value and CBR has been established:
CBR = (R + 10) / 2 (approximate, valid for R-value range 0 to 80)
Thus, an R-value of 50 corresponds to approximately CBR 30, while an R-value of 10 corresponds to approximately CBR 10. The R-value test is primarily used in the western United States, while CBR is used in the eastern United States and internationally.
The U.S. Army Corps of Engineers (USACE) classifies subgrade soils for airfield pavement design using the CBR design curves developed during World War II and continuously refined through full-scale testing. USACE classification groups subgrades into Category 1 (CBR > 20) , Category 2 (CBR 10 to 20) , Category 3 (CBR 5 to 10) , Category 4 (CBR 3 to 5) , and Category 5 (CBR < 3) . The USACE method is more conservative than FAA for ultra-low subgrades, requiring additional protection layers when CBR falls below 3.
Correlations with Resilient Modulus
The resilient modulus (Mr) — the elastic stiffness of a soil under repeated, moving wheel loads — is the fundamental material property used in mechanistic-empirical pavement design. While CBR measures a soil’s resistance to penetration at a single loading rate (essentially a measure of undrained shear strength), the resilient modulus measures the recoverable (elastic) strain under cyclic loading — a more direct representation of a pavement material’s response to moving traffic loads. The relationship between CBR and Mr is essential because most pavement design agencies have decades of CBR test data but increasingly use mechanistic-empirical methods requiring Mr input.
The most widely used correlation is the Heukelom and Klomp (1962) formula, developed from an extensive database of CBR and cyclic triaxial tests on fine-grained subgrade soils:
Mr (psi) = 1,500 × CBR for fine-grained soils with CBR ≤ 10
For example:
CBR 1 → Mr = 1,500 psi (10.3 MPa)
CBR 3 → Mr = 4,500 psi (31.0 MPa)
CBR 5 → Mr = 7,500 psi (51.7 MPa)
CBR 10 → Mr = 15,000 psi (103.4 MPa)
This formula is incorporated into the AASHTO Guide for Design of Pavement Structures (1993) and is the default conversion in the FAA FAARFIELD software for subgrade materials with CBR ≤ 10. For CBR values above 10, AASHTO recommends the Powell et al. (1984) formula:
Mr (psi) = 2,550 × CBR^0.64
This relationship yields:
CBR 15 → Mr = 13,200 psi (91 MPa)
CBR 20 → Mr = 15,950 psi (110 MPa)
CBR 40 → Mr = 25,100 psi (173 MPa)
CBR 80 → Mr = 38,500 psi (265 MPa)
The European standard — BS 8006 (Code of Practice for Strengthened/Reinforced Soils and Other Fills) — recommends the Alpan (1970) correlation for fine-grained soils:
Mr (MPa) = 16 × CBR^0.64 (approximate, using Mr in MPa)
The Transport and Road Research Laboratory (TRRL) in the United Kingdom developed the following correlation from extensive testing of British subgrade soils:
Mr (MPa) = 17.6 × CBR^0.64
For granular base and subbase materials, Mr is less reliably predicted from CBR because granular materials exhibit stress-dependent stiffness — the modulus increases with increasing confining pressure. The Shell pavement design method recommends:
Mr (psi) = 3,000 × CBR^0.50 for granular materials
CBR (%)
Mr (psi) — Fine-Grained
Mr (psi) — Granular
Mr (MPa) — Fine-Grained
2
3,000
4,240
20.7
5
7,500
6,710
51.7
10
15,000
9,490
103.4
20
15,950*
13,420
110*
50
27,800*
21,210
192*
80
38,500*
26,830
265*
*Using Powell et al. formula for CBR > 10
The FAA has conducted extensive research on CBR-Mr correlations using data from the National Airport Pavement Test Facility (NAPTF) , where full-scale flexible pavement test sections with known subgrade CBR values were subjected to controlled aircraft loading while subgrade strains were continuously measured. The NAPTF validation confirmed that the Heukelom and Klomp relationship is conservative for airport subgrades — meaning that pavement thicknesses designed using the Mr = 1,500 × CBR correlation tend to be slightly over-designed compared to the NAPTF-measured performance. However, the FAA continues to use the Heukelom and Klomp correlation for design to maintain consistency with the existing body of empirical design experience.
For critical airport pavement projects (major commercial airports serving Code E and Code F aircraft), the FAA recommends direct Mr testing using AASHTO T307 (Determining the Resilient Modulus of Soils and Aggregate Materials) rather than relying on CBR-Mr correlations. AASHTO T307 subjects the material to a sequence of cyclic triaxial load sequences at varying confining pressures and deviator stresses, directly measuring the resilient (recoverable) axial strain. The test protocol includes 15 loading sequences for subgrade materials and 30 sequences for base/subbase materials, each applying 100 load repetitions with a 0.1-second load duration and 0.9-second rest period. Direct Mr testing adds significant cost — approximately $500 to $1,000 per test compared to $75 to $150 for a standard soaked CBR test — but provides layer-specific modulus values that optimize pavement thickness and reduce the risk of premature failure.
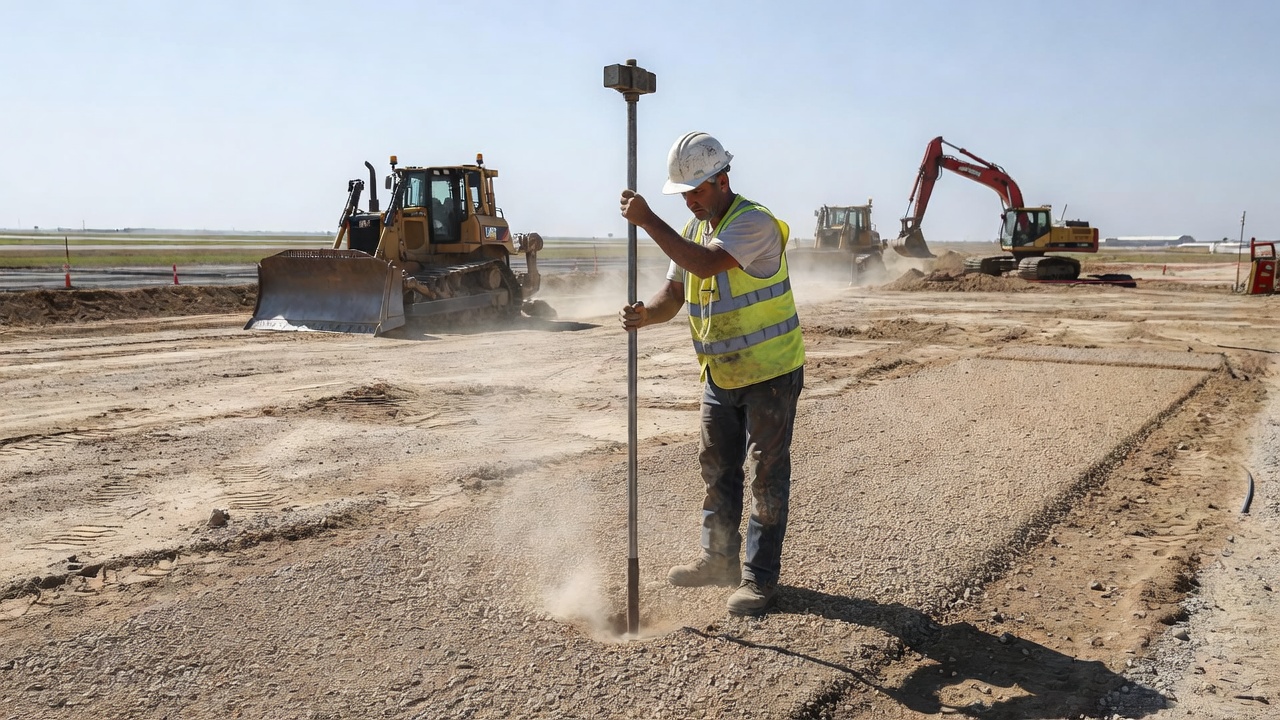
Field CBR — Dynamic Cone Penetrometer
The Dynamic Cone Penetrometer (DCP) is a portable, rapid, and cost-effective field device that provides a continuous in-situ strength profile of subgrade soils and unbound pavement layers. The DCP was originally developed in South Africa in the 1950s for road pavement evaluation and has been standardized internationally as ASTM D6951 (Standard Test Method for Use of the Dynamic Cone Penetrometer in Shallow Pavement Applications). The FAA explicitly recognizes DCP testing as an acceptable alternative to laboratory CBR testing for subgrade evaluation in AC 150/5320-6G Appendix D.
The standard DCP apparatus consists of a 16 mm (0.63-inch) diameter steel rod with a replaceable 60-degree cone tip at the lower end and a slide hammer at the upper end. The hammer has a mass of 8 kg (17.6 lbs) and is dropped from a fixed height of 575 mm (22.6 inches) onto an anvil, driving the cone into the soil. The penetration depth per hammer blow is recorded, and the cumulative penetration is plotted against the number of blows. The DCP provides a continuous strength profile with depth — a significant advantage over laboratory CBR testing, which only evaluates the material at a single density and moisture condition.
The correlation between DCP penetration rate and CBR is expressed by the general formula adopted by the US Army Corps of Engineers and ASTM D6951:
CBR = 292 / (DCP Penetration Rate)^1.12
Where the DCP Penetration Rate (PR) is the average penetration in millimeters per blow (mm/blow) over a specific depth interval. For example:
For different soil types, more specific correlation formulas have been developed through extensive field calibration. The Transport Research Laboratory (TRL, UK) recommends soil-specific formulas:
For cohesive soils (clays, silts — CH, CL, MH, ML): CBR = 3,452 / PR² (where PR is in mm/blow)
The DCP is particularly valuable for construction quality control where rapid, frequent testing is required. A DCP test to a depth of 600 mm (24 inches) — sufficient to evaluate the full subgrade profile for most airport pavement sections — takes approximately 10 to 15 minutes to perform, compared to 4 to 7 days for a laboratory soaked CBR test. This speed allows the geotechnical engineer or construction quality assurance team to assess dozens of test locations in a single day, providing real-time data for construction decisions.
The DCP is also used for pavement forensic investigation to identify the location and magnitude of weak layers within the pavement structure. For example, a DCP profile through an existing flexible pavement may reveal: high penetration resistance (low CBR) at the surface due to asphalt binder or cement stabilization; moderate penetration resistance through the base and subbase layers (typically CBR 30 to 80); and low penetration resistance in the subgrade (typically CBR 3 to 15). A sudden increase in penetration rate at a specific depth indicates a weak layer that may be the cause of pavement distress — such as a saturated clay lens below a sand subgrade, or a zone of poorly compacted fill.
The FAA (AC 150/5320-6G Appendix D) provides specific guidance on DCP testing for airport pavement projects: test locations should be spaced at maximum 150 m (500 ft) intervals along the pavement centerline, with offset tests at shoulder locations; testing depth should extend at least 1.5 m (5 ft) below the proposed subgrade elevation to identify deeper weak zones; moisture content testing should accompany DCP testing to assess the effect of saturation on strength; and DCP-derived CBR values should be correlated with laboratory soaked CBR tests on representative samples for project-specific calibration.
The limitations of DCP testing include: the test measures strength at the in-situ moisture content, which may not represent the design (soaked) condition; granular materials may be disturbed by the cone penetration, affecting the measured resistance in subsequent blows; and the cone may be deflected or obstructed by coarse aggregate or rock fragments, producing erroneously high CBR readings. Despite these limitations, the DCP is widely considered the most practical field tool for subgrade strength evaluation and is required by many airport construction specifications.
CBR in Airport Pavement Design
The use of CBR in airport pavement design is governed by ICAO Annex 14 — Aerodromes, Volume 1 (Aerodrome Design and Operations), and detailed in ICAO Doc 9157 — Aerodrome Design Manual, Part 3: Pavements. The ICAO manual provides a comprehensive overview of the CBR design method, including detailed design curves, material specifications, and quality control procedures adapted for international application.
ICAO Annex 14 defines four Subgrade Strength Categories for pavement design and PCN reporting:
ICAO Code
Subgrade Strength
CBR Range (%)
k-Value Range (MN/m³)
A
High
> 15
> 150
B
Medium
8 - 15
80 - 150
C
Low
4 - 8
40 - 80
D
Ultra Low
< 4
< 40
These codes are used in the PCN (Pavement Classification Number) reporting system — an ICAO-mandated method for reporting pavement strength to pilots and airline operators. The PCN code includes the subgrade strength category as one of five code elements, enabling aircraft operators to match aircraft loads (expressed as Aircraft Classification Number — ACN) to pavement strength. For example, a PCN of 65/F/B/W/T indicates a pavement with PCN 65, flexible pavement, medium subgrade (CBR 8-15), no tire pressure restriction, and evaluated by technical analysis. The subgrade strength code (letter B in this example) directly references the CBR-based classification.
The ICAO design method for flexible pavements follows a CBR-based empirical approach similar to the legacy FAA method (AC 150/5320-6E and earlier). The design curves relate subgrade CBR, aircraft load, tire pressure, and the number of coverages (passes) to the required total pavement thickness above the subgrade. The method distinguishes between light aircraft (gross weight ≤ 5,700 kg or 12,500 lbs) and heavy aircraft (gross weight > 5,700 kg), providing separate design curves for each category. For light aircraft, the design curves are based on single-wheel loads with tire pressures up to 0.7 MPa (100 psi). For heavy aircraft, the curves account for multiple-wheel gear configurations (dual, dual-tandem, dual-tandem with twin tricycle) and tire pressures up to 1.5 MPa (220 psi).
The ICAO design procedure requires the following inputs:
Design aircraft (or aircraft mix)
Wheel load and tire pressure of the design aircraft
Annual departures (or total coverages over design life)
Subgrade CBR (4-day soaked, ASTM D1883)
Quality of materials in each pavement layer
The design thickness is then read from standard curves or computed using the ICAO design equations, which are derived from the USACE CBR relationships with modifications for modern aircraft gear configurations. The minimum recommended pavement structure thickness for any airfield pavement (regardless of CBR) is 300 mm (12 inches) for flexible pavements and 150 mm (6 inches) for rigid pavements, ensuring adequate frost protection and construction stability.
For airport pavement evaluation — determining the load-carrying capacity of existing pavements — CBR values are obtained through field DCP testing (ASTM D6951) or laboratory testing of cores and samples extracted from the existing pavement structure. The existing subgrade CBR is evaluated at the in-situ moisture content, but a soaked CBR value is estimated using the project-specific correlation between field and laboratory values. The evaluated pavement structural capacity is then expressed as the PCN using the ICAO reporting format.
The Airbus and Boeing aircraft pavement design manuals — published by the manufacturers for airport planning purposes — both use CBR as the primary subgrade parameter for flexible pavement design. Airbus provides standard CBR design charts for each aircraft type (A320, A330, A380, etc.) relating required pavement thickness to subgrade CBR for both flexible and rigid pavements. Boeing publishes similar charts in the Boeing Airport Compatibility Documents for each aircraft family (737, 747, 777, 787). An airport planner evaluating pavement requirements for a new aircraft type can use these charts with a known subgrade CBR to determine whether existing pavement thickness is adequate.
The critical consideration in airport pavement design is that the design CBR represents the worst in-service condition — typically the CBR of the subgrade at the equilibrium moisture content, which may be 2% to 5% above the optimum moisture content for fine-grained soils. The FAA and ICAO specify the 4-day soaked CBR because it has been shown to produce pavement thicknesses that are adequate for long-term performance. Unsoaked CBR values should never be used for airport pavement design, as they do not account for the inevitable moisture increase that occurs beneath impermeable pavement surfaces over time due to water vapor migration, groundwater fluctuations, and surface water infiltration through cracks and joints.
The future of CBR in airport pavement design is evolving with the transition from empirical to mechanistic-empirical (M-E) design methods. The FAA’s FAARFIELD software now uses layered elastic analysis with direct Mr input, and the Airport Pavement M-E Design Guide currently under development will further refine the role of CBR as an input parameter. However, CBR is unlikely to be replaced entirely — the vast existing database of CBR test results, the simplicity and low cost of the test, and its continued specification in ICAO and national standards ensure that CBR will remain a cornerstone of airport pavement engineering for decades to come.
Frequently Asked Questions
The California Bearing Ratio (CBR) test is a standardized penetration test (ASTM D1883 / AASHTO T193) that measures the shear strength of soil and base materials by driving a standard 49.6 mm (1.95-inch) diameter cylindrical plunger into a compacted sample at a rate of 1.27 mm/min (0.05 in/min). The force required to achieve penetrations of 2.54 mm and 5.08 mm (0.1 and 0.2 inches) is compared to the force required to penetrate a standard crushed stone sample at the same depths. The ratio is expressed as a percentage. CBR values are the primary input for determining flexible pavement thickness in FAA and AASHTO design procedures.
The CBR test procedure involves: (1) preparing a soil sample at the optimum moisture content and compacting it into a cylindrical mold 152.4 mm (6 inches) in diameter and 177.8 mm (7 inches) tall; (2) applying a surcharge weight of 4.54 kg (10 lbs) to simulate pavement overburden; (3) soaking the sample in water for 96 hours (4 days) and measuring swell; (4) mounting the mold in a compression testing machine with a penetration piston; (5) driving the piston at 1.27 mm/min (0.05 in/min) into the sample; (6) recording force readings at 0.25 mm (0.01 in) penetration increments up to 12.7 mm (0.5 in); (7) plotting the force-penetration curve; and (8) calculating the CBR as the ratio of the measured force to the standard force at 2.54 mm and 5.08 mm penetration.
Typical CBR values by soil type: GW (well-graded gravel): 40-80; GP (poorly-graded gravel): 30-60; GM (silty gravel): 20-50; SW (well-graded sand): 20-40; SP (poorly-graded sand): 10-25; SM (silty sand): 10-20; SC (clayey sand): 5-15; ML (silt, low plasticity): 3-15; CL (lean clay, low plasticity): 3-10; MH (elastic silt, high plasticity): 2-8; CH (fat clay, high plasticity): 1-5; OL/OH (organic soils): 0.5-3. A CBR of 100% represents standard crushed stone. For airport pavement design, subgrades with CBR below 3 are classified as ultra-low strength and require special treatment.
CBR is the foundation of empirical flexible pavement thickness design. The FAA AC 150/5320-6G and ICAO Aerodrome Design Manual Part 3 both use CBR as the primary subgrade strength parameter. The required pavement thickness is inversely related to the CBR value: a subgrade with CBR 3 requires approximately 635 mm (25 inches) of pavement structure for a Boeing 737 load, while a CBR 15 subgrade requires only about 330 mm (13 inches). The CBR value determines not only thickness but also the need for subgrade improvement, stabilization, or geotextile reinforcement.
Soaked CBR measures the strength of a soil sample after 96 hours of water immersion, simulating worst-case field moisture conditions after rainfall or groundwater rise. The sample is submerged under 25 mm (1 inch) of water with a 4.54 kg surcharge, and swell is measured. Unsoaked CBR tests a sample at its compacted moisture content without immersion. The soaked CBR is always lower than or equal to the unsoaked CBR. For pavement design, the soaked CBR governs because it represents the critical saturated condition. The ratio of soaked to unsoaked CBR — the strength loss ratio — can range from 0.2 (highly moisture-sensitive clays) to 0.9 (well-drained sands and gravels).
The most widely used correlation is the Heukelom and Klomp (1962) formula: Mr (psi) = 1500 × CBR for fine-grained soils with CBR ≤ 10. For higher CBR values, the Powell et al. (1984) formula is preferred: Mr (psi) = 2550 × CBR^0.64. The FAA FAARFIELD software accepts both direct Mr input and CBR-based estimation. A CBR of 3 corresponds to approximately Mr = 4,500 psi (31 MPa), while a CBR of 10 yields approximately Mr = 15,000 psi (103 MPa). These correlations are approximate — for critical projects, direct Mr testing via cyclic triaxial testing (AASHTO T307) is recommended.
Yes, field CBR testing is performed using the Dynamic Cone Penetrometer (DCP) per ASTM D6951. The DCP measures penetration per blow (mm/blow) which is correlated to CBR using the formula: CBR = 292 / (DCP Penetration Rate)^1.12. The DCP consists of a 16 mm diameter rod with a 60-degree cone tip, driven by an 8 kg (17.6 lb) hammer dropped 575 mm. Field CBR is also measured directly using a field CBR apparatus similar to the lab device but placed directly on the subgrade. The DCP is more practical for field use as it provides a continuous strength profile with depth.
The FAA uses CBR as the primary subgrade strength input in the FAARFIELD pavement design software per AC 150/5320-6G. The design process requires: (1) determining the design subgrade CBR from laboratory testing of representative samples — typically the 90th to 95th percentile value along the proposed pavement alignment; (2) selecting the design aircraft and annual departure levels; (3) inputting the CBR into FAARFIELD which computes the required layer thicknesses using layered elastic theory. FAA specifies that the design CBR must be based on 4-day soaked test conditions (ASTM D1883). Minimum subgrade CBR for pavement construction without special treatment is 3. For CBR below 3, subgrade improvement (lime stabilization, cement treatment, geotextile reinforcement, or removal/replacement) is required.
Optimize Your Pavement Structural Evaluation
Accurate CBR assessment is fundamental to safe and cost-effective pavement design. Our advanced geotechnical inspection services provide precise subgrade strength data for airport pavement projects worldwide.
Resilient Modulus (Mr) is the dynamic elastic modulus of subgrade soil or unbound pavement materials under repeated (cyclic) loading, measuring recoverable stra...
The plate bearing test (plate load test) applies static loads to a circular steel plate on the ground surface, measuring settlement to determine soil bearing ca...
Pavement thickness design determines the layer thicknesses required to support traffic loads over the design life. Methods include empirical (AASHTO 1993; FAA C...
26 min read
Pavement design
Airport engineering
+1
Cookie Consent We use cookies to enhance your browsing experience and analyze our traffic. See our privacy policy.