Chloride Attack
Chloride attack is the penetration of chloride ions from deicing salts, marine environments, or contaminated materials into concrete, destroying the passive oxi...
25 min read
Concrete Defects
Corrosion
+4
Chloride content testing determines the concentration of chloride ions at various depths in concrete, indicating corrosion risk to reinforcement. Total chloride (acid-soluble) and free chloride (water-soluble) are measured from drilled powder samples or cores. Covers sampling, test methods (potentiometric titration, Quantab, XRF), and interpretation relative to corrosion threshold.
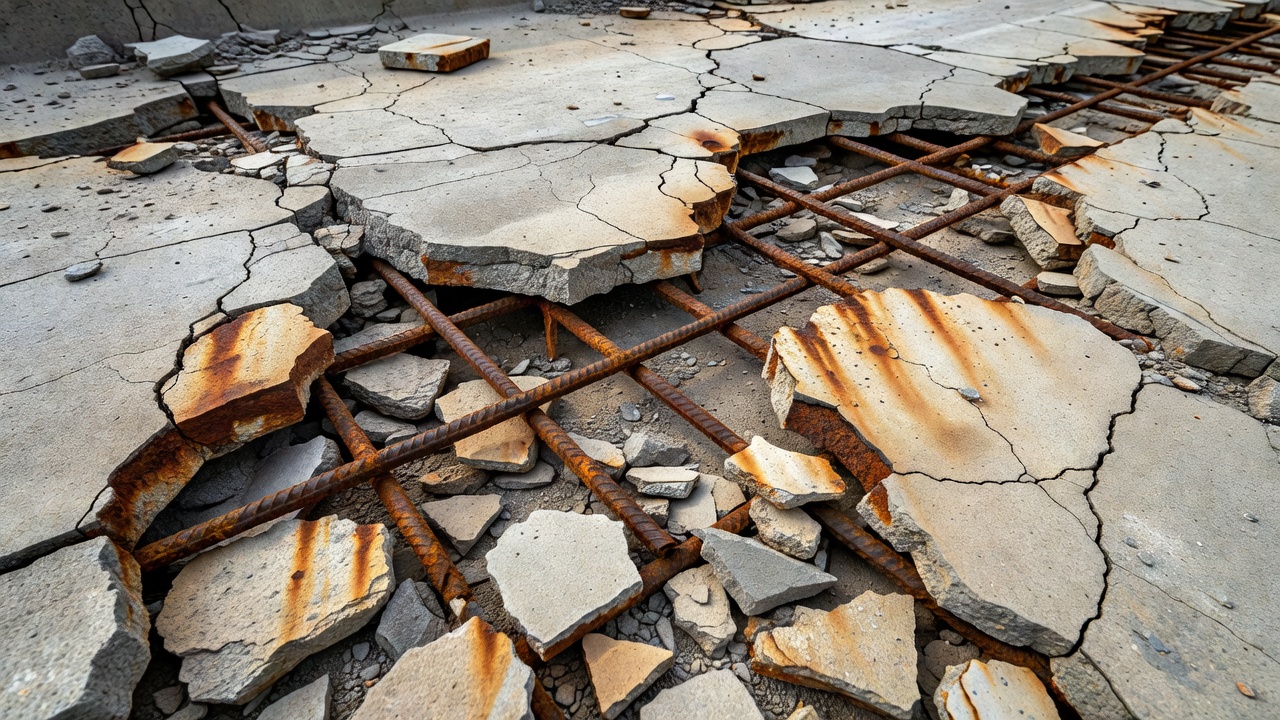
Chloride content testing is the quantitative chemical analysis of concrete to determine the concentration of chloride ions present within the cementitious matrix. This testing is performed on samples collected from concrete structures — primarily bridge decks, parking garages, marine structures, and airport pavements — to assess the risk of chloride-induced corrosion of embedded steel reinforcement. Chloride ions, when present at the steel-concrete interface above a critical concentration, destroy the protective passive oxide layer that normally shields reinforcing steel from corrosion, initiating an electrochemical process that produces expansive rust products, concrete cracking, spalling, and ultimately structural deterioration. The test generates data expressed as chloride concentration as a percentage by weight of cementitious material or by weight of concrete, plotted against depth from the surface to create a chloride profile that reveals both the current corrosion risk and the rate at which chlorides are penetrating the cover concrete.
The distinction between total chloride (acid-soluble) and free chloride (water-soluble) is fundamental to interpreting chloride content test results and making corrosion risk assessments. The two measurements differ in what fraction of the total chloride population in concrete they extract and quantify, and each provides a different perspective on corrosion risk.
Total chloride (acid-soluble chloride) is determined by digesting a powdered concrete sample in hot nitric acid, which dissolves the cement matrix completely and releases all chloride ions — both those freely dissolved in the pore solution and those chemically bound in hydration products such as Friedel’s salt (3CaO·Al₂O₃·CaCl₂·10H₂O). The measurement is performed per ASTM C1152 (Standard Test Method for Acid-Soluble Chloride in Mortar and Concrete) or AASHTO T260 Procedure A. Total chloride represents the maximum quantity of chloride that could potentially become available to cause corrosion if the bound chlorides are released through carbonation, changes in pore solution chemistry, or other mechanisms. The total chloride content is always higher than the free chloride content, typically by a factor of 1.25 to 1.4, though this ratio varies with cement type, w/cm ratio, curing conditions, and the presence of supplementary cementitious materials such as fly ash or slag that increase chloride binding capacity.
Free chloride (water-soluble chloride) is determined by boiling a powdered concrete sample in distilled water for five minutes, then allowing it to stand for 24 hours before filtration and analysis per ASTM C1218. This extraction dissolves only the chloride ions present in the pore solution — the fraction that is immediately available to depassivate steel reinforcement. Water-soluble chloride is the more direct indicator of current corrosion risk because only free ions can participate in the electrochemical corrosion reaction at the steel surface. However, water-soluble chloride measurement is more sensitive to sample preparation details, extraction temperature, and the water-to-sample ratio, and can underestimate corrosion risk if bound chlorides become released over time as the concrete ages or carbonates.
From a corrosion science perspective, what matters is the concentration of free chloride ions at the steel surface relative to the concentration of hydroxide ions in the pore solution, expressed as the [Cl⁻]/[OH⁻] ratio. The passive layer on steel remains stable when the [Cl⁻]/[OH⁻] ratio is below approximately 0.6, though this threshold varies with steel composition, temperature, and surface condition. Expressing chloride content as a percentage by weight of cementitious materials is a practical simplification that avoids the need to extract and analyze pore solution directly.
The corrosion threshold (also called critical chloride content or chloride threshold level, CTL) is the chloride concentration at the steel-concrete interface that is sufficient to disrupt the passive oxide layer and initiate active corrosion. This threshold is not a single universal value — it is a statistical distribution influenced by multiple interacting parameters including concrete pH, cement composition, water-cement ratio, curing conditions, moisture content, temperature, steel surface condition (presence of mill scale, rust, or surface imperfections), and the availability of oxygen at the cathode.
For conventional carbon steel reinforcement in portland cement concrete, the commonly accepted corrosion threshold ranges from 0.2% to 0.4% total chloride by weight of cement (approximately 0.03–0.06% by weight of concrete). When expressed as water-soluble chloride, the threshold is typically 75–80% of these values, or approximately 0.06% to 0.10% water-soluble chloride by weight of cement. The American Concrete Institute (ACI) 222R (Protection of Metals in Concrete Against Corrosion) specifies maximum allowable limits of 0.08% total chloride or 0.06% water-soluble chloride by weight of cement for prestressed concrete, and 0.15% total chloride or 0.10% water-soluble chloride for reinforced concrete in corrosive environments.
The FHWA (Federal Highway Administration) has published extensive literature reviews on chloride threshold values, noting that reported values from laboratory studies range from 0.04% to 2.5% by weight of cement, depending on test conditions and definition of corrosion initiation. Field studies on actual bridge structures show thresholds generally in the range of 1.2 lb/yd³ (0.71 kg/m³) for conventional rebar, equivalent to approximately 0.2% by weight of cement or 0.03% by weight of concrete assuming 600 lb of cement per cubic yard of normal weight concrete.
For prestressing steel and post-tensioning tendons, the allowable chloride limits are significantly lower because of the higher stress state and reduced tolerance for corrosion damage. The AASHTO LRFD Bridge Construction Specifications and the Post-Tensioning Institute (PTI) M55.01-03 both limit total chloride to 0.08% by weight of cementitious material for grout. The European Standard EN 447 allows 0.10% by weight of cement for grout. These limits are why rigorous chloride testing is mandatory for grout materials in post-tensioned bridge construction.
The corrosion threshold is often expressed in multiple ways in codes and specifications:
| Expression | Reinforced Concrete | Prestressed Concrete |
|---|---|---|
| % by weight of cement (total Cl⁻) | 0.15–0.20% | 0.06–0.08% |
| % by weight of cement (water-soluble Cl⁻) | 0.10% | 0.06% |
| % by weight of concrete (total Cl⁻) | 0.025–0.033% | 0.010–0.013% |
| [Cl⁻]/[OH⁻] ratio in pore solution | 0.3–0.6 | 0.2–0.3 |
| lb/yd³ of concrete (total Cl⁻) | 1.0–2.0 | 0.4–0.6 |
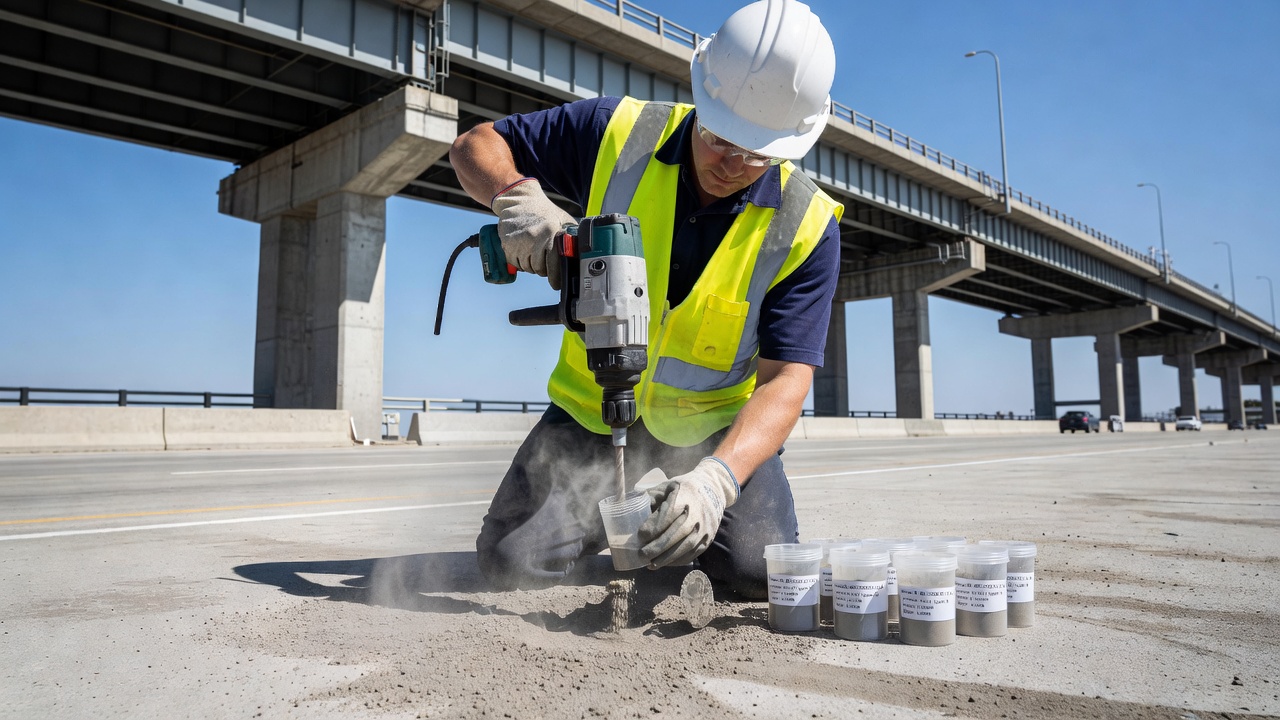
Chloride sampling is one of the most critical steps in the entire testing process because the quality of the analytical result cannot exceed the quality of the sample from which it is derived. Improper sampling — cross-contamination between depth increments, insufficient sample mass, sampling too close to cracks or delaminations, or sampling from wet or contaminated surfaces — produces results that are unreliable regardless of the sophistication of the laboratory analysis.
The standard sampling method for chloride profiling is rotary hammer drilling of 1-inch (25 mm) diameter holes at predetermined depth increments. The procedure, codified in AASHTO T260 and detailed in state-specific protocols such as Idaho IR-128, involves the following steps. First, a sampling location grid is established at a minimum density of one sample location per 1,000 square feet (100 m²) with a minimum of three locations per bridge deck. Locations are chosen at points of probable high chloride concentration — curb lines, gutter lines, the lower side of super-elevated decks, and areas adjacent to expansion joints where deicing salt-laden water accumulates. Samples are not taken at locations where delamination, spalling, or patching has already occurred, since corrosion at those locations is already obvious.
At each sampling location, three holes are drilled within a 6-inch (150 mm) diameter circle to obtain sufficient powder mass. A rotary hammer with a 1-inch by 12-inch (25 mm by 300 mm) carbide-tipped bit equipped with interchangeable depth sleeves controls the drilling depth for each increment. The surface is first scarred approximately ¼ inch (6 mm) deep to remove surface dirt and salt that could produce erroneously high readings. The scarred material is discarded. The holes are blown clean with compressed air between each depth increment.
Standard depth increments are typically ½ inch (15 mm), with nominal sampling depths of ¼–¾ inch (6–19 mm) for the surface increment, ¾–1¼ inch (19–32 mm) for the second increment, 1¼–1¾ inch (32–44 mm) for the third, and continuing at ½-inch increments to the maximum sampling depth, which should extend at least ½ inch below the reinforcement depth. The FHWA Long-Term Bridge Performance (LTBP) Protocol FLD-DC-MS-004 specifies six depth increments for bridge deck chloride profiling, with the surface increment at 0.25–0.75 inch used as the driving chloride concentration (C₀) for diffusion calculations.
Each powder sample — approximately 15 grams or a 20-dram vial filled three-quarters full — is collected in a labeled plastic vial using a clean sampling spoon. The drill bit, depth sleeve, and sampling spoon are cleaned between depth increments using a nylon brush, paper towels, and 2-propanol (isopropyl alcohol) to prevent cross-contamination. The three holes are then extended to the next depth increment using the next depth sleeve, and the process is repeated. Complete sampling at a single location takes approximately 30–60 minutes depending on the number of depth increments and concrete hardness.
The alternative sampling method is core extraction per ASTM C42, followed by cutting the core into depth increments in the laboratory. The FHWA LTBP protocol uses 2.5-inch diameter cores for chloride profiling, with the top 3 inches of the core dedicated to chloride analysis. Cores are cut into ½-inch thick slices corresponding to the same depth increments used for powder sampling. The core method provides more material for analysis and allows visual examination of the concrete at each depth, but is more labor-intensive and leaves a hole that must be patched.
Chloride content in concrete is determined by several analytical methods that differ in accuracy, speed, cost, and equipment requirements. The choice of method depends on the required level of precision, the number of samples to be analyzed, field versus laboratory conditions, and applicable standards.
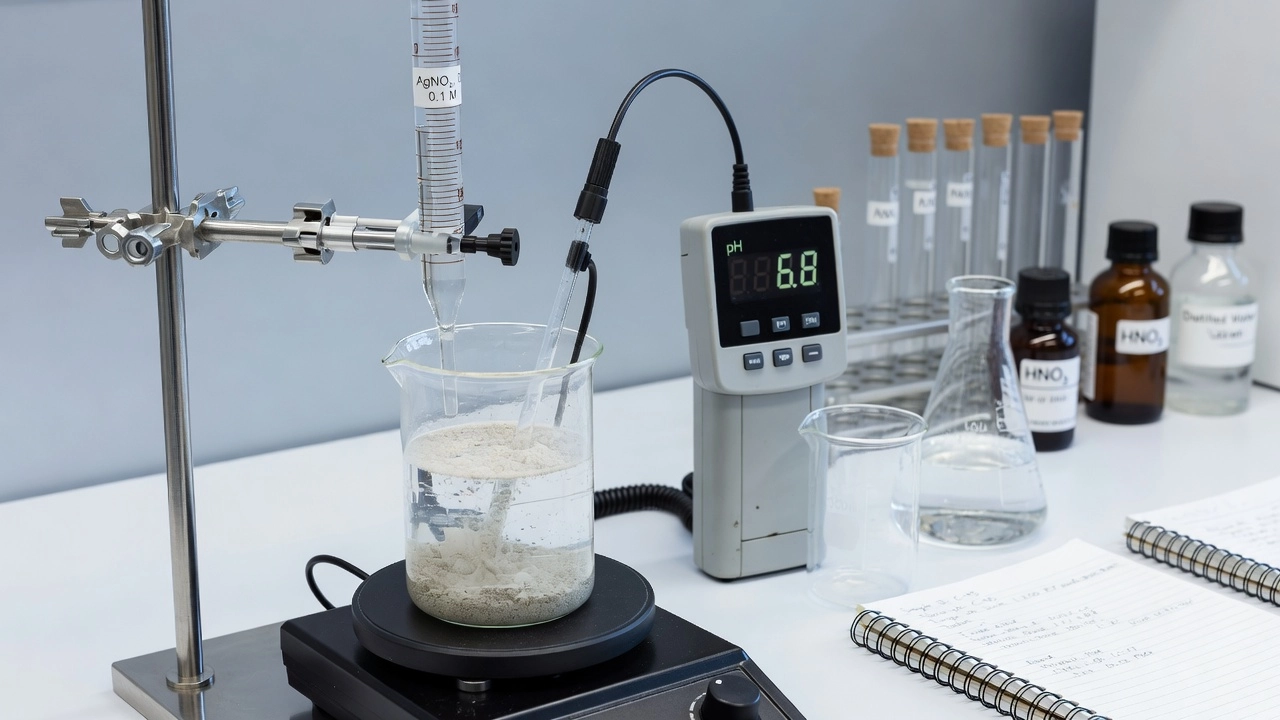
Potentiometric titration is the reference standard method for chloride determination in concrete and is specified as the primary method in ASTM C1152 and AASHTO T260 Procedure A. The method involves extracting chlorides from a weighed powdered concrete sample (typically 3–10 g) by digestion in hot nitric acid (for total chloride) or hot water (for water-soluble chloride). The filtered extract is then titrated with a standard silver nitrate (AgNO₃) solution while monitoring the potential difference between a silver billet electrode and a reference electrode using a millivolt meter.
The titration proceeds by the reaction: Ag⁺ (from AgNO₃) + Cl⁻ (from sample) → AgCl (precipitate). As silver nitrate is added incrementally, the silver ion concentration in solution remains very low while chloride ions are present. When all chloride has precipitated as silver chloride, the first excess of silver ions produces a sharp increase in potential at the electrode, defining the equivalence point. The volume of silver nitrate titrant consumed to reach the equivalence point is directly proportional to the chloride content of the sample. The endpoint is identified by plotting the first derivative (ΔE/ΔV) or second derivative (Δ²E/ΔV²) of the titration curve and locating the inflection point.
Modern automated titration systems — such as those from Metrohm, Mettler Toledo, or Hanna Instruments — perform the titration and endpoint detection automatically, storing the potentiometric data for quality assurance. The FHWA LTBP protocol requires retention of detailed titration records including calibration standards, blank corrections, and the full log of incremental titrant addition with corresponding voltage readings. Automated systems typically achieve precision of ±0.001% chloride by weight of sample.
The Quantab method (also called Quantab chloride titrator strips) is a simplified field test for estimating chloride content in concrete without laboratory equipment. The method is described in the Transportation Research Record 1347 (Measuring the Chloride Content of Concrete, 1992) and involves the following procedure. A 5 g sample of powdered concrete is digested in 50 mL of 1N nitric acid, allowed to stand with occasional stirring, and then filtered through filter paper. A Quantab strip — a flat capillary column impregnated with silver dichromate — is placed vertically in the filtrate.
The solution rises in the capillary by capillary action, and the silver ions react with chloride to form a white silver chloride precipitate. As the precipitate forms, it blocks the capillary, and the height of the color change from yellow to white is read against a calibrated scale printed on the strip. The reading is converted to chloride concentration using a calibration table provided by the manufacturer (Hach Company).
The Quantab method offers significant advantages for field screening: it is simple to perform, requires no electrical power or sophisticated equipment, produces results in 15–45 minutes, and has a manufacturer-certified accuracy of ±10% of the measured value. It is widely used by state DOTs for rapid bridge deck chloride screening to identify areas requiring more detailed laboratory testing. However, the method is less precise than potentiometric titration, particularly at very low chloride concentrations near the detection limit, and is susceptible to interference from bromide or iodide ions if present. It is suitable for screening but not for final acceptance or forensic determinations where regulatory limits are at issue.
X-ray fluorescence spectrometry is an advanced instrumental method that offers the potential for rapid, non-destructive chloride analysis in both laboratory and field settings. The technique involves irradiating a sample with high-energy X-rays, which cause atoms in the sample to emit secondary (fluorescent) X-rays at characteristic energies for each element. By measuring the intensity of the chlorine Kα fluorescence line at 2.62 keV, the chloride concentration in the sample can be quantified.
Handheld XRF (hXRF) analyzers — such as the Olympus Innov-X Delta or Bruker S1 Titan — have been calibrated for chloride quantification in cement-based materials. A study by Chinchón-Payá et al. (2021) published in Materials demonstrated that hXRF can accurately quantify chloride ions in concrete with a correction factor of 1.16 when calibrated against potentiometric titration results. The hXRF method can be applied directly to concrete surfaces in situ or to powdered samples in the laboratory. For in situ measurements, the hXRF is placed against a ground concrete surface, and a 60–120 second measurement provides an elemental spectrum from which chloride concentration is calculated. For powdered samples, the sample is placed in a cylindrical holder and analyzed on a workbench.
Micro-XRF (μXRF) instruments provide the additional capability of mapping chloride distribution across a sample surface at millimeter or sub-millimeter spatial resolution. This technique, described in research from Malvern Panalytical and Bruker, allows visualization of chloride penetration fronts, detection of localized chloride hotspots near cracks or defects, and correlation of chloride distribution with aggregate particles and air voids. The technique provides information that bulk titration methods cannot reveal. However, both hXRF and μXRF require careful calibration using matrix-matched standards, and the detection limit for chlorine (approximately 0.01–0.02% by weight) is higher than for titration methods.
| Method | Precision | Time per Test | Equipment Cost | Field Use | Standard |
|---|---|---|---|---|---|
| Potentiometric titration | ±0.001% Cl⁻ | 30–60 min | $$ | No | ASTM C1152, AASHTO T260 |
| Quantab strips | ±10% of value | 15–45 min | $ | Yes | TRR 1347 |
| Handheld XRF | ±0.01–0.02% Cl⁻ | 2–5 min | $$$ | Yes | Calibrated per method |
| Lab XRF (WDXRF) | ±0.002% Cl⁻ | 15–30 min | $$$$ | No | EN 196-2 |
| Volhard titration | ±0.003% Cl⁻ | 45–90 min | $ | No | Historical reference |
A chloride profile is a graphical representation of chloride concentration plotted against depth from the concrete surface. It is the most informative output of chloride testing because it reveals not only whether chlorides have reached the reinforcement at a concentration above the threshold, but also the rate at which chlorides are penetrating the concrete, the surface exposure condition, and the concrete’s resistance to chloride ingress.
The profile is constructed by analyzing chloride content at each discrete depth increment — typically six to eight increments over the top 2–3 inches (50–75 mm) of concrete. The data points are plotted as chloride concentration (in % by weight of cementitious material, % by weight of concrete, or kg/m³) on the y-axis against depth from the surface (in mm or inches) on the x-axis. The characteristic shape of a chloride profile in sound concrete shows the highest concentration at the surface (typically 0.3–1.0% by weight of concrete for bridge decks exposed to deicing salts) and a declining concentration with increasing depth, asymptotically approaching the background chloride level at depths beyond the penetration front.
Fick’s Second Law of Diffusion is the fundamental transport model used to interpret chloride profiles:
∂C/∂t = D × (∂²C/∂x²)
where C is chloride concentration at depth x and time t, and D is the diffusion coefficient. The solution of this equation for steady-state conditions with constant surface concentration and a semi-infinite medium is:
C(x,t) = C₀ × erfc[x / (2 × √(Dₐ × t))]
where C(x,t) is the chloride concentration at depth x and time t, C₀ is the surface chloride concentration, erfc is the complementary error function, Dₐ is the apparent chloride diffusion coefficient, and t is the exposure time. Nonlinear regression analysis is performed on the measured profile data to solve for C₀ and Dₐ.
The apparent chloride diffusion coefficient (Dₐ) is a key durability parameter. It describes the rate at which chloride ions move through the concrete cover by diffusion under the prevailing concentration gradient. Typical Dₐ values for bridge deck concrete range from 1 × 10⁻¹² m²/s for high-quality, low-w/cm concrete to 1 × 10⁻¹¹ m²/s for more permeable concrete. The diffusion coefficient is not a true material constant — it decreases over time as continued hydration refines the pore structure, an effect captured by the ageing factor (m) in service life models such as Life-365 and STADIUM.
The surface chloride concentration (C₀) is not the actual concentration at the immediate surface but rather the back-calculated concentration at the surface from the regression fit. It typically ranges from 0.3% to 1.5% by weight of concrete for bridge decks in deicing salt environments, depending on exposure severity, frequency of salt application, and drainage conditions. C₀ increases over time as chlorides accumulate from repeated applications.
A well-constructed chloride profile enables the engineer to determine three critical parameters for corrosion risk assessment: the chloride concentration at the reinforcement depth — obtained by interpolating the profile at the measured concrete cover depth; the critical depth — the depth at which the chloride concentration equals the corrosion threshold, below which concrete is still chloride-free; and the time to corrosion initiation — estimated by solving Fick’s second law using the measured Dₐ, C₀, cover depth, and the assumed corrosion threshold.
The interpretation of chloride content data follows a structured decision framework that integrates the chloride profile with other condition assessment data — concrete cover depth, half-cell potential mapping, corrosion rate measurements, concrete resistivity, and visual inspection. The goal is to answer four questions: Is corrosion currently occurring? How severe is it? Will it continue or accelerate? And what intervention, if any, is needed?
The first-level interpretation is a direct comparison of the measured chloride concentration at reinforcement depth against the applicable corrosion threshold. If the chloride concentration at the reinforcement depth exceeds the threshold, active corrosion is probable provided that oxygen and moisture are also available at the cathode. If the concentration is below the threshold, corrosion initiation is unlikely at present, but the remaining time to initiation must be estimated from the diffusion parameters.
The second-level interpretation uses the full chloride profile to estimate the rate of chloride ingress. A profile showing a steep concentration gradient (high surface concentration, low chloride at depth) with a well-defined penetration front indicates a concrete with good resistance to chloride ingress, where diffusion is slow and the service life against chloride-induced corrosion is expected to be long. A profile showing a flat gradient with significant chloride at all depths indicates either a highly permeable concrete (high Dₐ) or a long exposure period where chlorides have had time to penetrate deeply. The profile shape also reveals whether the concrete is in the diffusion-dominated regime (profile follows the erfc function smoothly) or whether additional transport mechanisms such as capillary suction, wicking, or pressure-driven flow are active (indicated by profile anomalies or abrupt changes in slope).
The third-level interpretation integrates chloride data with electrochemical measurements. Half-cell potential mapping (ASTM C876) identifies areas where the corrosion potential of the steel is more negative than -350 mV vs. Cu/CuSO₄, indicating a high probability of active corrosion. Corrosion rate measurement (linear polarization resistance or galvanostatic pulse techniques) quantifies the rate of metal loss in μm/year or mA/m², distinguishing active corrosion from passivity. Concrete resistivity (Wenner four-probe method) identifies areas where the concrete is sufficiently conductive to support corrosion current — low resistivity (< 20 kΩ·cm) supports high corrosion rates, while high resistivity (> 100 kΩ·cm) limits corrosion even if chlorides are present. When high chloride concentration at reinforcement depth is found in a location with corrosion potential more negative than -350 mV and corrosion rate above 0.1 μm/year, active corrosion is confirmed and repair intervention is indicated.
The chloride concentration at the reinforcement depth is the single most important parameter for corrosion risk assessment because it represents the actual chemical condition at the steel surface where corrosion initiation occurs. This value is not measured directly — reinforcement is never exposed for sampling — but is determined by interpolating the chloride profile at the measured concrete cover depth.
Concrete cover depth is measured by a cover meter (pachometer) that uses electromagnetic induction to locate the reinforcement and measure the depth of concrete over the bars. In bridge decks, typical cover depths range from 1.5 to 3.0 inches (38–75 mm) depending on the original design specifications and construction tolerances. The AASHTO LRFD Bridge Design Specifications require minimum cover of 2.5 inches for bridge decks in corrosive environments. However, actual cover often varies significantly from design values due to construction tolerances, bar placement errors, and concrete surface irregularities. For this reason, cover must be measured at each chloride sampling location, not taken from the design drawings.
The interpolation of chloride concentration at the reinforcement depth is performed by fitting a regression curve (typically the Fickian diffusion model or a polynomial function) to the measured profile data and evaluating the fitted function at the cover depth. For example, if the cover depth is 2.0 inches and chloride profile data are available at depths of 0.5, 1.0, 1.5, 2.0, and 2.5 inches, the chloride concentration at 2.0 inches is read directly. If the cover depth falls between two measured increments, linear interpolation between the two bounding points is used.
When the chloride concentration at reinforcement depth exceeds the threshold, the corrosion process may already be active or may initiate within the near future depending on the rate of additional chloride ingress and the moisture conditions. The time from exceeding threshold to visible damage (cracking, spalling) depends on the corrosion rate, which in turn depends on the availability of oxygen, moisture, and ionic conductivity. This corrosion propagation phase can range from 5 to 20 years for typical bridge deck conditions. For prestressed or post-tensioned structures, the propagation phase can be much shorter because the high tensile stress accelerates crack growth once corrosion pits form.
Bridge decks are the most common infrastructure component subjected to routine chloride content testing because they are directly exposed to deicing salts applied during winter maintenance operations. In the United States, over 60 million metric tons of deicing salt (primarily sodium chloride) are applied to roadways annually. A significant portion of this salt dissolves in runoff water, splashes onto bridge decks, and penetrates the concrete surface through the deck’s porous microstructure and through cracks. Over a typical bridge deck service life of 40–75 years, chloride concentrations at the reinforcement depth can reach several times the corrosion threshold, leading to widespread corrosion-induced deterioration that is the single largest maintenance cost for highway agencies.
The FHWA Long-Term Bridge Performance (LTBP) Program has developed standardized protocols for chloride testing of bridge decks, codified in Protocol FLD-DC-MS-004 (Sampling and Testing for Chloride Profiles). The protocol specifies: core diameter of 2.5 inches; six depth increments of 0.5 inch each from the surface to 3.0 inches; the surface increment (0.25–0.75 inch) used as the driving chloride concentration C₀ for diffusion calculations; analysis per AASHTO T260 Procedure A; and titration of samples in order of anticipated increasing chloride concentration (deepest to shallowest) to minimize cross-contamination.
State DOTs have developed additional guidance for bridge deck chloride testing. The Idaho IR-128 standard practice requires a minimum of one sample location per 1,000 square feet with a minimum of three locations per deck, with samples concentrated at curb lines and the low side of super-elevated decks. The protocol emphasizes cleaning the sampling area, scarifying the surface before the first depth increment, and cleaning all equipment between increments with 2-propanol.
The Florida DOT specifies a maximum allowable chloride content of 0.40 lb/yd³ (0.24 kg/m³) for new bridge deck concrete, which is equivalent to approximately 0.067% by weight of cement assuming 600 lb of cement per cubic yard. This limit is consistent with the AASHTO limit of 0.08% total chloride by weight of cementitious material for prestressed concrete.
Bridge deck chloride testing is most valuable when combined with half-cell potential mapping and chain drag delamination surveys. The combination of these three condition assessment methods provides comprehensive corrosion risk assessment: chloride testing identifies the chemical condition (chloride available to initiate corrosion), half-cell potential identifies the electrochemical condition (is corrosion occurring now?), and chain drag identifies the physical consequence (has corrosion produced delamination?). When all three indicators are positive at the same location, active corrosion with structural damage is confirmed and repair is urgent.
Chloride content testing of concrete is governed by a suite of national and international standards that define sampling procedures, analytical methods, calculations, and reporting requirements. The three primary standards in North America are described below.
ASTM C1152 — Standard Test Method for Acid-Soluble Chloride in Mortar and Concrete. This test method covers the determination of total chloride (acid-soluble chloride) in hardened mortar and concrete. A powdered sample passing a 850 μm (No. 20) sieve is digested in hot nitric acid (HNO₃ at approximately 20% concentration) for at least 30 minutes. The hot acid digestion ensures complete dissolution of all chloride-containing phases including Friedel’s salt and any bound chloride in hydration products. The solution is filtered, and the filtrate is titrated potentiometrically with standard silver nitrate solution (0.05N or 0.1N AgNO₃). The result is calculated as percent chloride by mass of sample, and may be converted to percent by mass of cementitious material if the cement content of the concrete is known. The precision of the method, based on interlaboratory testing, has a multilaboratory coefficient of variation of approximately 6.5% at a chloride content of 0.10% by mass.
ASTM C1218 — Standard Test Method for Water-Soluble Chloride in Mortar and Concrete. This test method covers the determination of free chloride (water-soluble chloride) in hardened mortar and concrete. A powdered sample is boiled in distilled water for five minutes, then allowed to stand for 24 hours at room temperature. The water extraction dissolves only the chloride present in the pore solution — the fraction immediately available to participate in corrosion. The extract is filtered and titrated potentiometrically with standard silver nitrate. The water-soluble chloride content is typically 70–80% of the acid-soluble chloride content, though this ratio varies with cement type and chloride binding capacity. ASTM C1218 is less commonly specified for forensic investigations because the water extraction is more sensitive to sample handling, extraction conditions, and filtration procedures.
AASHTO T260 — Sampling and Testing for Chloride Ion in Concrete and Concrete Raw Materials. This is the primary standard governing both sampling and testing procedures in the United States highway industry. AASHTO T260 is referenced by virtually all state DOT specifications for bridge deck chloride testing. The standard includes: Procedure A — potentiometric titration (essentially equivalent to ASTM C1152 for acid-soluble chloride determination); Procedure B — atomic absorption spectrophotometry, which is still recognized as a valid method though less commonly used by commercial laboratories; detailed procedures for sampling including drilling, depth control, sample collection, and prevention of cross-contamination; calculation methods for expressing results as percent by mass of sample, percent by mass of cementitious material, or kg/m³; quality control requirements including duplicate analyses and blank corrections; and reporting requirements including sample identification, depth increments, and laboratory quality assurance data.
The AASHTO LRFD Bridge Construction Specifications (Section 10, Table 10.9.3.2) limit total chloride in grout to 0.08% by weight of cementitious material, referencing AASHTO T260 and ASTM C1152 for verification.
International standards relevant to chloride testing include: BS EN 14629:2007 — Products and Systems for the Protection and Repair of Concrete Structures — Test Methods — Determination of Chloride Content in Hardened Concrete — the primary European standard for chloride profile testing; NT BUILD 443 — Concrete Hardened: Accelerated Chloride Penetration — used for determining the chloride diffusion coefficient by immersion in sodium chloride solution; and ISO 1920-11 — Testing of Concrete — Part 11: Determination of the Chloride Resistance of Concrete — Unidirectional Diffusion — a newer international standard for chloride diffusion testing.
Chloride content data directly informs infrastructure maintenance and repair decisions at multiple levels. The relationship between measured chloride levels and the timing, extent, and type of repair intervention follows a logical progression from screening through detailed investigation to repair design.
Level 1 — Screening: At the network level, rapid screening using Quantab strips or handheld XRF at a limited number of locations identifies decks or pavement sections with chloride levels above background. This screening prioritizes structures for detailed investigation. For example, a state DOT might test five locations per bridge deck during biennial inspection and flag any deck where chloride at reinforcement depth exceeds 0.02% by weight of concrete (half the threshold) for detailed follow-up. This screening complements routine visual inspection and chain drag surveys.
Level 2 — Detailed Investigation: Structures identified in the screening phase undergo full chloride profiling at a higher sampling density (one location per 500–1,000 square feet). The profiles are used to calculate Dₐ and C₀ for input into service life models such as Life-365, STADIUM, or the FHWA’s Chloride Exposure Duration Model. The models estimate the remaining service life — the time until the chloride concentration at reinforcement depth reaches the threshold — which defines the time window for preventive maintenance.
Level 3 — Repair Design: At the project level, chloride profiles define the removal depth for concrete repair. If chlorides have penetrated only the outer 1 inch of cover, a partial-depth patch that removes the chloride-contaminated concrete and replaces it with a low-permeability repair mortar is sufficient. If chlorides have penetrated to the reinforcement at concentrations above the threshold over a wide area, full-depth slab replacement or application of electrochemical chloride extraction (ECE) may be necessary. The ACI 222R and ACI 364.1R provide guidance on specifying removal depths based on chloride profiles.
Level 4 — Preventive Strategies: For structures where chloride profiles indicate that the corrosion threshold has not yet been reached but will be reached within the service life window (typically 10–20 years), preventive maintenance strategies are prioritized. These include application of penetrating sealers (silanes, siloxanes) that reduce water and chloride ingress; installation of cathodic protection systems (galvanic or impressed current) that polarize the reinforcement to prevent corrosion; and electrochemical chloride extraction (ECE) that applies a temporary electric field to drive chloride ions away from the reinforcement and out of the concrete.
The cost implications of chloride-informed maintenance decisions are substantial. A preventive strategy applied before corrosion initiation (e.g., sealer application at a cost of $3–$8/ft²) can extend bridge deck service life by 10–15 years at a fraction of the cost of reactive repair (partial-depth patching at $50–$150/ft² or full-depth replacement at $200–$500/ft²). The economic justification for routine chloride testing is compelling: every dollar spent on chloride testing supports a maintenance decision that can save $10–50 in deferred or avoided repair costs.
The reliability of chloride content data depends on rigorous quality assurance throughout the sampling, handling, and analysis chain. Common sources of error and their mitigation are:
Cross-contamination between depth increments: The most frequent and most significant source of error in chloride profiling. When drilling from shallow to deep increments, powder from the previous depth increment that remains on the drill bit, in the holes, or in the sampling tools contaminates the next, deeper increment. This produces an artificially high reading at depth. Mitigation requires thorough cleaning of all tools between increments with 2-propanol and complete removal of loose powder from the holes using compressed air.
Surface contamination: The concrete surface is typically heavily contaminated with deicing salt, dirt, and debris that does not reflect the chloride content of the concrete itself. The mandatory scarification of the surface ¼ inch before collecting the first depth increment removes this contamination. Without scarification, the surface increment reading can be 2–5 times higher than the true concrete chloride content.
Sample size insufficient: Each depth increment must provide at least 10–15 grams of powder for reliable analysis. Single 1-inch diameter holes do not produce sufficient powder; three holes per depth increment are required. For core samples, the core diameter must be at least three times the nominal maximum aggregate size to provide a representative sample.
Moisture condition of samples: Wet samples produce inaccurate chloride concentrations because the water dilutes the sample mass basis. Samples should be dried in an oven at 105°C before weighing and analysis. The FHWA LTBP protocol specifies that concrete powder samples should be dried to constant mass before analysis.
Matrix interference: Certain concrete constituents can interfere with chloride analysis. Sulfide ions (from some aggregates or ground-granulated blast furnace slag) can react with silver nitrate, causing a titration error. Bromide and iodide ions produce the same precipitation reaction as chloride. These interferences are addressed by using potentiometric titration which differentiates endpoints by potential, or by including a pretreatment step such as hydrogen peroxide addition to oxidize sulfides.
Blank corrections: All titration procedures require a blank determination using the same reagents and procedure but without the concrete sample. The blank value, which represents the chloride contributed by the reagents themselves, is subtracted from the sample reading. Blank values should be less than 0.005% chloride by mass of sample equivalent. Higher blanks indicate reagent contamination.
Laboratory accreditation: Reputable chloride testing laboratories hold accreditation to ISO/IEC 17025 (General Requirements for the Competence of Testing and Calibration Laboratories) and participate in proficiency testing programs such as those administered by the Cement and Concrete Reference Laboratory (CCRL) or AASHTO re:source. The Florida DOT, for example, requires that commercial laboratories providing chloride testing services be accredited by the Construction Materials Engineering Council (CMEC) for the specific ASTM or AASHTO test methods.
Chloride content testing is one component of a comprehensive corrosion condition assessment that typically includes multiple complementary methods. The relationship between chloride testing and other assessment methods is:
Half-cell potential (ASTM C876) measures the corrosion potential of the reinforcing steel relative to a reference electrode (typically copper-copper sulfate). A potential more negative than -350 mV indicates a greater than 90% probability of active corrosion. However, half-cell potential alone cannot distinguish between corrosion caused by chlorides versus carbonation, and it provides no information about the rate or extent of corrosion damage. Chloride testing adds the cause dimension — if high chloride concentration coincides with negative potentials, chloride-induced corrosion is confirmed.
Linear polarization resistance (LPR) and galvanostatic pulse methods measure the corrosion current density (i_corr) in μA/cm², which can be converted to metal loss rate in μm/year using Faraday’s law. Corrosion rates below 0.1 μA/cm² indicate passivity, rates of 0.1–0.5 μA/cm² indicate moderate corrosion, rates of 0.5–1.0 μA/cm² indicate high corrosion, and rates above 1.0 μA/cm² indicate very high corrosion. Chloride testing provides the pre-condition explaining why the steel is corroding.
Concrete resistivity (Wenner four-probe method, AASHTO T358) measures the electrical resistance of concrete in kΩ·cm. Low resistivity (< 20 kΩ·cm) supports high corrosion rates by facilitating ionic current flow between anodic and cathodic sites. High resistivity (> 100 kΩ·cm) suppresses corrosion even when sufficient chloride is present. Chloride testing combined with resistivity measurements identifies locations where both the thermodynamic driving force (chloride) and kinetic pathway (conductive electrolyte) are present for active corrosion — the most critical locations requiring urgent repair.
Petrographic examination (ASTM C856) of concrete thin sections can identify corrosion products (rust), microcracking around reinforcement, secondary deposits (calcite, ettringite), and evidence of freeze-thaw damage that may work synergistically with chloride-induced corrosion. Petrography provides visual confirmation of damage mechanisms inferred from chloride data.
Cover depth measurement with a cover meter (ASTM C876 or BS 1881-204) provides the essential link between chloride profiles and reinforcement location. Without accurate cover depth, the chloride concentration at the steel surface cannot be determined, and the corrosion risk assessment is incomplete. Cover depth should be measured at each chloride sampling location and at a grid of points across the structure to document the statistical distribution of cover depths.
The integration of these methods — chloride profiles, half-cell potential, corrosion rate, resistivity, cover depth, and petrography — provides a complete picture of corrosion condition: the cause (chlorides or carbonation), the likelihood (is the threshold exceeded?), the activity (is corrosion occurring?), the rate (how fast is metal being consumed?), and the consequence (how much damage has already occurred?). This comprehensive assessment drives rational, cost-effective repair decisions that extend infrastructure service life while optimizing maintenance expenditure.
TarmacView integrates chloride content data with automated pavement condition inspection to provide comprehensive corrosion risk assessments. Schedule a demo to see how our platform connects laboratory test results with field inspection and maintenance planning.
Chloride attack is the penetration of chloride ions from deicing salts, marine environments, or contaminated materials into concrete, destroying the passive oxi...
Corrosion of reinforcing steel is the electrochemical deterioration of rebar within concrete, driven by chloride ingress or carbonation destroying the protectiv...
Concrete electrical resistivity measures the material's resistance to ionic current flow, providing an indirect indication of corrosion risk — low resistivity c...