Concrete petrography is the microscopic examination of hardened concrete thin sections and polished surfaces to identify aggregate type, cement paste characteristics, air-void system parameters, ASR gel, cracking patterns, carbonation depth, and other microstructural features. It is the definitive forensic method for diagnosing concrete deterioration causes.
Definition and Scope of Concrete Petrography
Concrete petrography is the systematic scientific examination of hardened concrete using microscopic and macroscopic techniques to determine its composition, microstructure, quality, and the causes of any deterioration or performance problems. The term derives from the Greek petros (rock) and graphia (description) — petrography is literally the description of rocks, and concrete is an artificial rock composed of aggregate particles bound by a cement paste matrix. The method is codified in ASTM C856 — Standard Practice for Petrographic Examination of Hardened Concrete (latest version C856/C856M-20), which establishes the standard procedures for visual examination, stereomicroscopy, polarized light microscopy (PLM), fluorescence microscopy, scanning electron microscopy (SEM), and X-ray diffraction (XRD) as applied to concrete specimens.
The scope of concrete petrography extends across the entire service life of concrete structures. During the pre-construction phase, petrographic examination of aggregate sources per ASTM C295 — Standard Guide for Petrographic Examination of Aggregates for Concrete identifies potentially deleterious constituents including reactive silica minerals (opal, chalcedony, strained quartz, volcanic glass), iron sulfides (pyrite, marcasite, pyrrhotite), clay coatings, soluble sulfates, and organic matter. During construction, petrography of hardened concrete samples verifies that the delivered material matches the approved mix design — confirming aggregate type and gradation, cementitious content, air-void parameters, water-cement ratio, and degree of hydration. During the in-service phase, petrographic examination of cores extracted from areas showing distress provides definitive diagnosis of deterioration mechanisms including alkali-silica reaction (ASR), alkali-carbonate reaction (ACR), freeze-thaw deterioration, sulfate attack (external, internal, and delayed ettringite formation), corrosion-induced cracking, carbonation, and D-cracking. During forensic investigation, petrography answers the critical question: why did this concrete fail?
The FHWA Petrographic Manual (FHWA-HRT-04-150) describes petrography as a “progressive examination sequence” that moves from the macroscopic to the microscopic scale. The examination begins with unaided visual inspection of the specimen, progresses to stereomicroscopy of polished surfaces at 5× to 50× magnification, advances to polarized light microscopy of thin sections at 20× to 1000× magnification, and employs SEM/EDS and XRD for definitive phase identification when necessary. Each stage informs the next, and the petrographer develops a refined hypothesis as evidence accumulates. The British Cement Association (1992) and Lane (2001) emphasize that the identification of alkali-aggregate reaction specifically requires an integration of field and laboratory evidence — petrography alone cannot diagnose without context, and field inspection alone cannot confirm mechanisms without microstructural evidence.
Sample Preparation for Petrographic Examination
Proper sample preparation is the foundation of accurate petrographic analysis. The quality of the microscopic examination depends entirely on the quality of the prepared specimen — poor preparation introduces artifacts that can be mistaken for in-situ deterioration features. The FHWA Petrographic Manual (FHWA-HRT-04-150) dedicates extensive guidance to preparation methods, recognizing that sample preparation “is the most critical step in the petrographic examination process.”
Core Extraction and Sampling Strategy
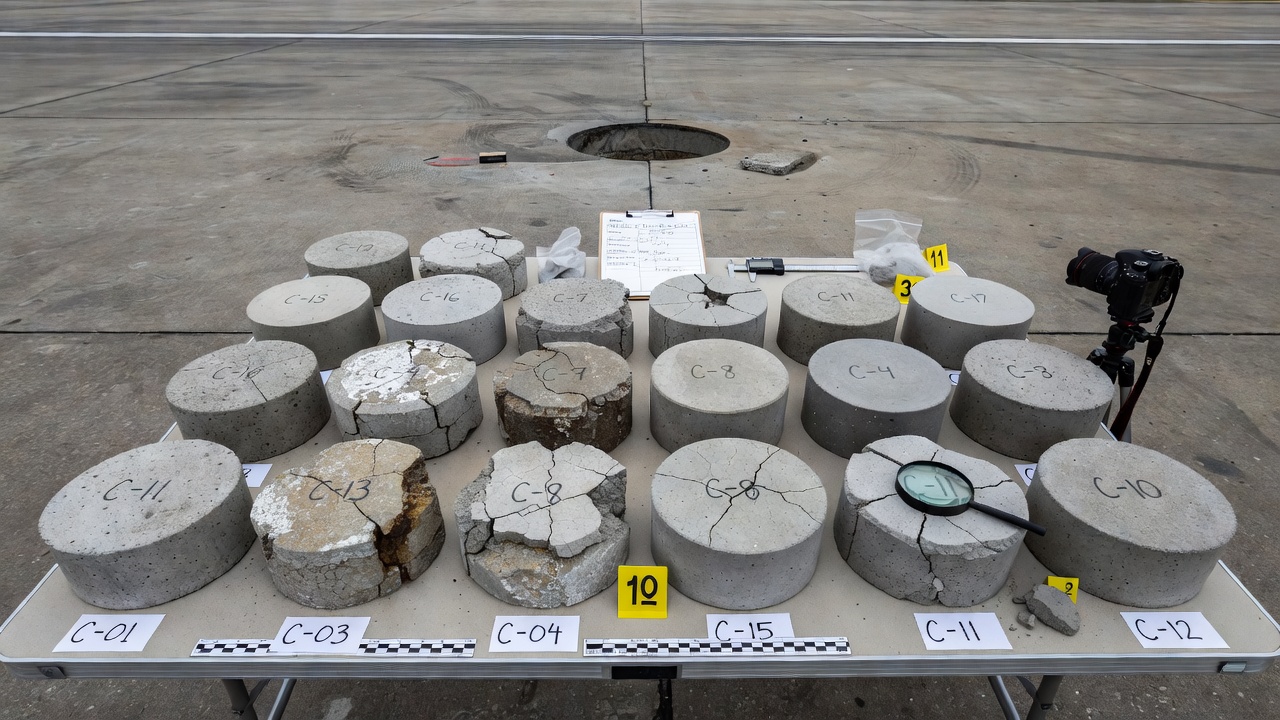
Per ASTM C856, concrete specimens for petrographic examination are typically diamond-drilled cores with a minimum diameter of 100 mm (4 inches) and a preferred depth of at least 203 mm (8 inches). Full-depth cores that extend through the entire concrete thickness are preferred because they capture the complete depth profile including the surface zone, interior mass, and bottom interface. For forensic investigations, the FHWA recommends the “good, bad, and ugly” sampling approach — extract cores from three categories of locations: areas showing significant distress (the ugly), nearby areas in the same structure showing moderate distress (the bad), and sound areas of the same concrete mixture (the good). This comparative approach isolates the deterioration mechanism from background material characteristics. A minimum of three cores from any area of concern and three from comparison areas is the standard recommendation per ASTM C856.
Thin Sections
A petrographic thin section is a slice of concrete mounted on a glass slide and ground to a precise thickness that allows light to pass through for transmitted-light microscopy. The preparation follows a sequence of steps:
Step 1 — Impregnation: The concrete specimen is dried to remove free water, placed in a vacuum chamber, evacuated to remove air from pores and cracks, and flooded with low-viscosity epoxy under vacuum. The epoxy penetrates the pore structure, stabilizing fragile microstructural features. For fluorescence microscopy, the epoxy is laced with a fluorescent dye — typically Uvitex OB or similar — that emits yellow-green fluorescence (peak ~530 nm) when excited with blue-violet light. Alternative impregnation agents include carnauba wax (recommended in ASTM C457 for air-void analysis), nylon nail hardener in 1:5 solution with acetone or methanol (Roberts and Scali, 1984), and ultra-low viscosity epoxies for intruding extremely fine pore structures.
Step 2 — Mounting: The impregnated specimen is cut to produce a flat surface, which is then mounted onto a standard glass petrographic slide (27 × 46 mm or 27 × 48 mm) using epoxy adhesive. The slide provides mechanical support during subsequent grinding.
Step 3 — Grinding: The mounted specimen is ground to the standard thickness of 30 micrometers (0.03 mm) — the thickness at which quartz exhibits first-order gray interference colors under cross-polarized light, serving as the calibration standard. For fluorescence microscopy, sections are ground to 20–25 micrometers to prevent background haze from the fluorescent epoxy in the uncollimated UV illumination. Grinding proceeds through progressively finer abrasives (typically silicon carbide grits from coarse 60-grit to fine 600-grit) on mechanical lapping wheels with automatic abrasive feed.
Step 4 — Cover slip: For standard polarized light microscopy, a thin glass cover slip (typically #1.5 thickness, 0.16–0.19 mm) is applied over the section with mounting medium. For fluorescence microscopy, the section is left uncovered because the cover slip creates a yellow autofluorescence haze under incident UV light that obscures the image.
The FHWA manual emphasizes that a quality thin section must be free of undercutting — the uneven removal of softer cement paste relative to harder aggregate particles during grinding. Undercutting is minimized by using hard cast-iron lapping plates, applying sufficient specimen weight, and using stabilizing impregnation agents. A properly prepared thin section exhibits no noticeable relief between paste and aggregate.
Polished Sections and Lapped Surfaces
Polished sections (also called lapped surfaces) are flat-ground concrete surfaces used for stereomicroscopy examination and air-void analysis per ASTM C457. Unlike thin sections, polished sections are opaque and examined under reflected light. Preparation involves:
Cutting a slice from the concrete core — typically 20–25 mm thick using an oil-cooled diamond saw
Lapping the surface with progressively finer abrasives on mechanical laps (typical lapping time: ~20 minutes per grit)
Final polishing with fine diamond paste (6 µm to 1 µm) to achieve a mirror-like finish
Cleaning the surface with ultrasonic cleaning in solvent or gentle brushing
Quality check: a properly lapped surface reflects a distant light source clearly with no noticeable relief between paste and aggregate
The quality check for ASTM C457 lapped surfaces is particularly rigorous. The FHWA manual states: “A properly lapped surface should reflect a distant light source clearly. There should be no noticeable relief between paste and aggregate.” Surface relief causes false void identification — depressions at aggregate boundaries can be mistaken for air voids.
Fractured surfaces (fresh breaks through the concrete) provide complementary information about aggregate-paste bond quality, fracture paths (through aggregate versus around aggregate), and the presence of secondary deposits in voids. Fractured surfaces are examined under the stereomicroscope without any preparation beyond cleaning.
Stereomicroscopy Examination
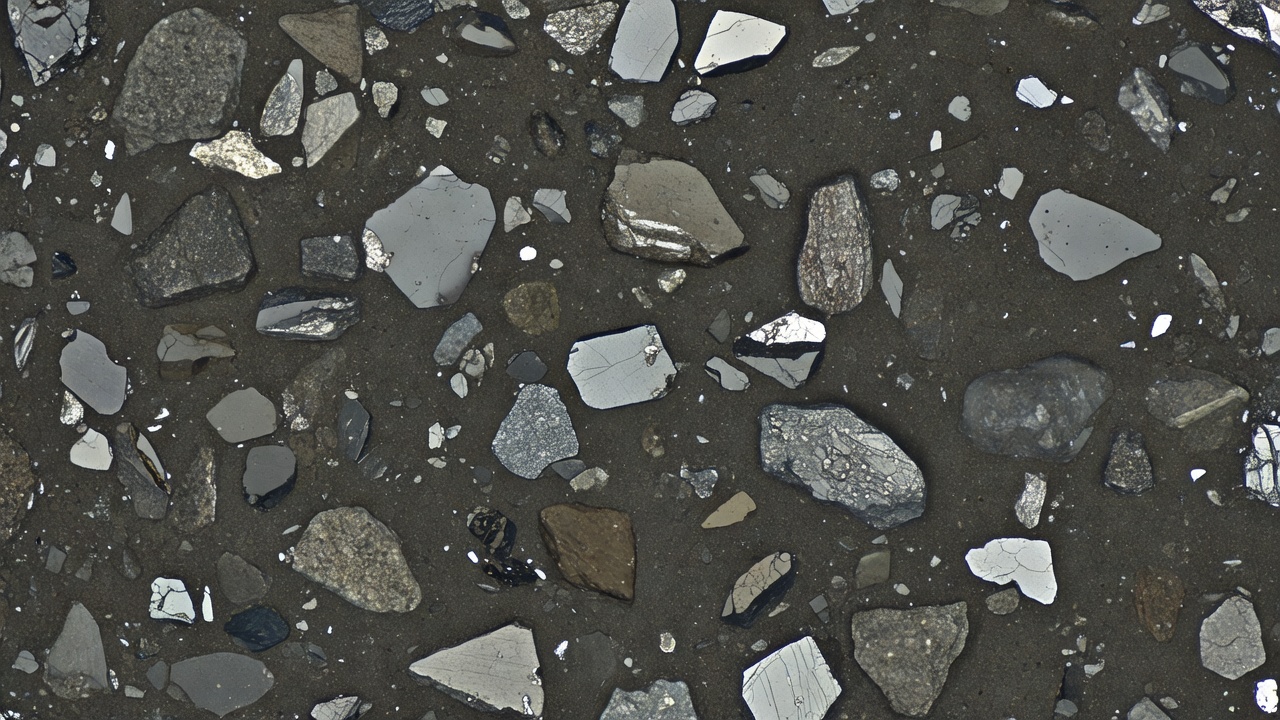
Stereomicroscopy is the first microscopic examination stage in the petrographic sequence, performed after visual inspection of the as-received specimen. The stereomicroscope provides magnifications from 5× to 50× with a three-dimensional view of the concrete surface, making it ideal for examining lapped surfaces, fractured surfaces, and polished sections. Per ASTM C856, the stereomicroscope examination documents the following features:
Aggregate characteristics: Coarse aggregate type (igneous, sedimentary, or metamorphic), color, size, shape (angular, subangular, rounded), surface texture, maximum particle size, gradation, and any evidence of reaction rims, staining, or cracking within aggregate particles. The petrographer estimates the relative proportions of different rock types present and notes any deleterious constituents such as chert, shale, or opal.
Cement paste characteristics: Paste color (gray, brown, dark), uniformity, presence of unhydrated cement particles, evidence of carbonation (beige discoloration at exposed surfaces), and any visible secondary deposits in voids or cracks. The paste-aggregate bond quality is assessed — gaps at the interface indicate debonding from freeze-thaw damage, delayed ettringite formation (DEF), or drying shrinkage.
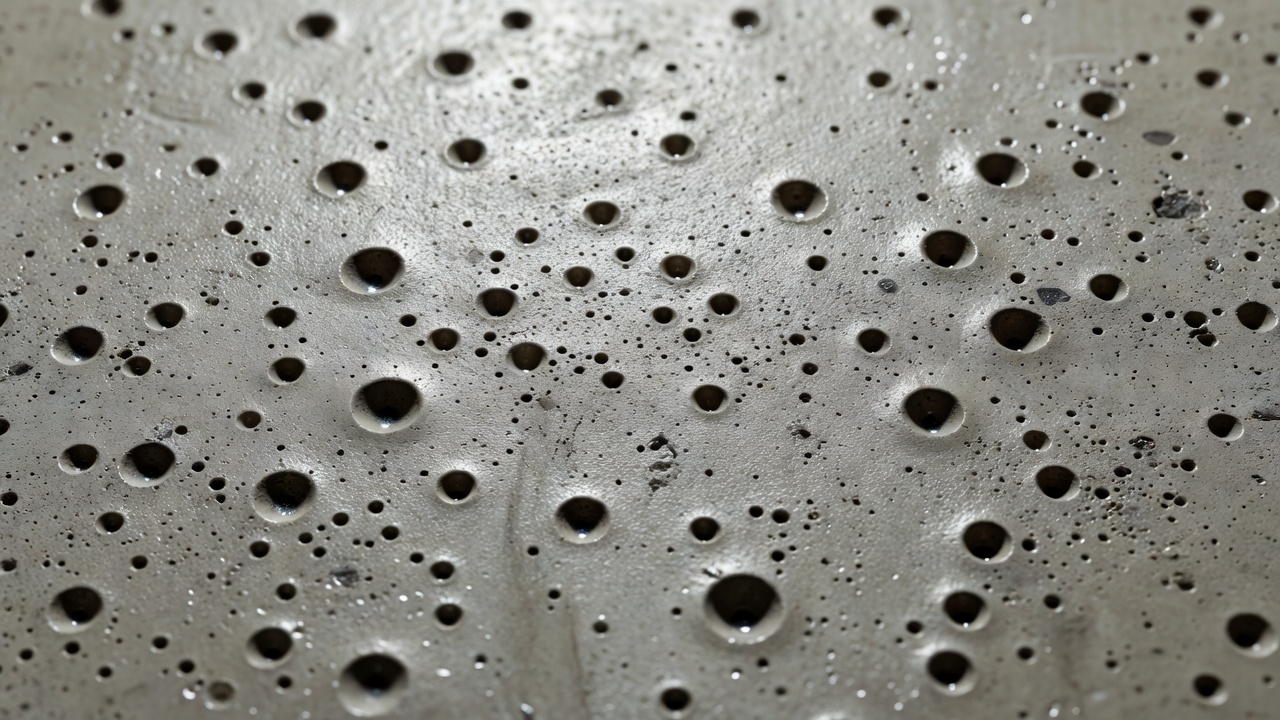
Void system: Air voids are classified by size and shape into entrained air voids (5 µm to 1 mm, spherical, uniformly distributed), entrapped air voids (>1 mm, spherical or irregular, randomly distributed), and capillary voids (<5 µm, part of the paste microstructure). The petrographer notes the total air content visually, the distribution of voids, any void lining or filling by secondary deposits (ASR gel, ettringite, thaumasite, or calcium carbonate), and boundary voids — voids flattened at the aggregate-paste interface indicating poor consolidation or bleed water accumulation.
Cracking: Cracks are documented by location (in aggregate, in paste, at the aggregate-paste interface), orientation (surface-parallel, random, radiating from aggregate), width, and whether they are filled with secondary deposits. The distinction between pre-existing cracks (formed in-service) and preparation cracks (induced during sampling or specimen preparation) is critical and is confirmed by fluorescence microscopy.
Secondary deposits: The stereomicroscope reveals ASR gel (translucent to white, sometimes clear, lining or filling air voids and cracks), ettringite (white to pale-yellow needle-like crystals in voids), thaumasite (white fibrous masses), efflorescence (white powdery deposits on surfaces), and corrosion products (red-brown rust staining around embedded steel).
The stereomicroscope examination produces a written description and photographic record of all observed features. This record guides the selection of areas for thin section preparation and the focus of the higher-magnification examination. Per the FHWA manual, the stereomicroscope examination is where the petrographer “develops the initial hypothesis about the causes of deterioration” which is then tested through polarized light microscopy and other advanced techniques.
Fluorescence Microscopy
Fluorescence microscopy — also called epifluorescence microscopy or P/EF (Polarizing/Epifluorescence) microscopy — is a specialized technique that uses incident ultraviolet or blue light to excite a fluorescent dye previously impregnated into the concrete specimen. The dye-filled pores, voids, and cracks fluoresce brightly (yellow-green at ~530 nm) against a dark background of non-impregnated solids. The FHWA manual identifies fluorescence microscopy as “the single most powerful petrographic technique for evaluating the microstructure of hardened concrete.”
The P/EF microscope combines two illumination systems: a transmitted halogen light source for standard petrographic modes (plane-polarized PPL and cross-polarized XPL), and an incident UV light source (typically a 200 W mercury arc lamp) for fluorescence. The operator can switch between modes without moving the specimen, allowing direct comparison of the same field of view under different illumination conditions. Filter systems include exciter filters (UG-5 for UV, BG-3 for violet, BG-12 for blue-violet, IF-545/BG-36 for green), dichroic mirrors (DM-455), and barrier filters (Y-485, Y-495, O-515).
The FHWA manual (Chapter 13) identifies seven primary applications of fluorescence microscopy in concrete petrography:
1. Crack detection: All cracks are visible under fluorescence regardless of orientation. In transmitted light, only cracks oriented perpendicular to the thin section plane are visible — cracks parallel to the section are invisible. Fluorescence reveals the complete crack network. Crucially, pre-existing cracks (formed in-service) are filled with fluorescent epoxy during impregnation and appear bright, while preparation cracks (formed during thin section grinding) remain empty and appear dark. This distinction is the definitive method for identifying whether observed cracking is a real in-service deterioration feature or a laboratory artifact.
2. Capillary porosity assessment: The fluorescent dye penetrates the entire capillary pore network of the cement paste. Higher fluorescence intensity indicates higher capillary porosity and thus higher water-cement ratio. Lower fluorescence intensity indicates denser paste with lower permeability. Comparison of fluorescence intensity between the surface zone and interior of a specimen reveals carbonation gradients (carbonated paste is denser and fluoresces less) and near-surface porosity variations from bleeding or inadequate curing.
3. Air-void system evaluation: Fluorescence provides good correlation with the linear traverse method (ASTM C457) for specific surface and spacing factor, though correlation for total air content is less reliable. The fluorescent dye clearly outlines void boundaries, making automated image analysis feasible for void detection and measurement.
4. Water-cement ratio indication: Higher w/cm produces more capillary porosity and greater fluorescence intensity. This allows the petrographer to qualitatively assess whether the w/cm is uniform throughout the specimen or varies with depth (e.g., higher w/cm at the top surface from bleeding).
5. Hydration assessment: The degree of cement hydration affects capillary porosity — well-hydrated paste has lower porosity and lower fluorescence. Unhydrated cement clinker particles (alite, belite, ferrite) are visible as dark angular grains within the fluorescent paste.
6. Carbonation detection: Carbonated areas exhibit lower fluorescence because calcium carbonate (CaCO₃) precipitated in the pores reduces porosity. The boundary between carbonated and non-carbonated paste is clearly visible as a fluorescence intensity transition, providing a more precise carbonation depth measurement than phenolphthalein alone.
7. Aggregate-paste bond: The fluorescent epoxy fills any gap at the aggregate-paste interface, making debonding immediately visible as a bright halo around aggregate particles. This is diagnostic for freeze-thaw damage and delayed ettringite formation.
Air-Void System Analysis (ASTM C457)
ASTM C457 — Standard Test Method for Microscopical Determination of Parameters of the Air-Void System in Hardened Concrete is the definitive quantitative method for evaluating the air-void system that protects concrete from freeze-thaw damage. The method produces six parameters that collectively characterize the air-void system quality:
Parameter
Symbol
Description
Threshold for Freeze-Thaw Protection
Air content
A
Percentage of air voids by volume in hardened concrete
4–8% (varies with aggregate size and exposure)
Specific surface
α (alpha)
Surface area of voids per unit volume of voids (mm⁻¹)
>24 mm⁻¹ preferred; 16–32 mm⁻¹ acceptable
Spacing factor
L̄ (L-bar)
Half the average distance between air voids (mm)
<0.20 mm required; 0.10–0.20 mm ideal
Void frequency
n
Number of voids per unit length of traverse
Varies with air content and void size
Average chord length
Ī
Sum of void chords divided by number of voids
~0.10–0.25 mm for well-entrained concrete
Paste-air ratio
p/A
Ratio of paste volume to air volume
4–10 (ACI 201.2R)
The spacing factor (L̄) is the single most critical parameter. It represents the theoretical maximum distance that water in the cement paste must travel to reach the nearest air void for pressure relief during freezing. The Powers hydraulic pressure theory demonstrates that when water freezes in capillary pores, the 9% volume expansion generates hydraulic pressure that can exceed the tensile strength of the paste (~3–5 MPa). Air voids spaced sufficiently close together act as expansion chambers that relieve this pressure. The critical threshold of L̄ < 0.20 mm is based on decades of research correlating laboratory freeze-thaw testing (ASTM C666) with field performance. A spacing factor of 0.20 mm means that no point in the paste is more than 0.20 mm from an air void — short enough for the hydraulic pressure to dissipate before damage occurs.
The ASTM C457 test requires a lapped surface prepared to mirror quality with no relief between paste and aggregate. Two methods are available:
Linear Traverse Method: The microscope is moved along a series of parallel lines (traverses) across the lapped surface. The operator records the length of each intercept through an air void, the length of each intercept through cement paste, and the number of voids intersected. The total traverse length must meet minimum requirements specified in ASTM C457 Table 1 — typically 1500–2500 mm for concrete with 19 mm nominal maximum aggregate size. The traverse is performed at a magnification of 50× to 150×.
Modified Point-Count Method: A grid of points is superimposed on the field of view, and the operator classifies each point as falling on void, aggregate, or paste. The number of points classified as voids provides the air content. Void frequency is determined for spacing factor calculation. The point-count method requires fewer operator decisions than the traverse method but requires more points for equivalent statistical precision.
Per ASTM C457, samples must be selected according to a rigorously random plan from a minimum of three locations in the concrete body, with at least one section prepared from each of the three samples. For specification compliance evaluation, areas of extreme deterioration should be sampled separately from sound areas because the deteriorated zone may have a different air-void system than the parent concrete (air voids may become filled with secondary deposits or the void structure may be damaged by cracking).
The air-void classification system per ASTM C457 distinguishes:
Void Type
Size Range
Shape
Origin
Freeze-Thaw Relevance
Entrained air voids
5 µm to 1 mm
Spherical
Air-entraining admixture + mixing
Beneficial — provide pressure relief
Entrapped air voids
>1 mm
Spherical or irregular
Incomplete consolidation
Not beneficial — too large and too few
Capillary voids
<5 µm
Irregular
Original water-filled space in paste
Part of paste microstructure, not air-void system
Water voids
Variable
Irregular
Bleed water accumulation
Indicate poor consolidation
The relationship between fresh concrete air content (measured by ASTM C231 pressure method or ASTM C173 volumetric method) and hardened air content (ASTM C457) should agree within ±1%. Discrepancies larger than 1.5% suggest either air loss during transport and placement, poor sample preparation, or sampling from non-representative locations.
Identifying ASR, ACR, Freeze-Thaw, and Sulfate Attack
Petrography is the definitive method for distinguishing between the major concrete deterioration mechanisms. Each mechanism produces a characteristic microstructure that the trained petrographer identifies through a combination of stereomicroscopy, polarized light microscopy, fluorescence microscopy, and when necessary, SEM/EDS and XRD.
Alkali-Silica Reaction (ASR)
Alkali-silica reaction (ASR) occurs when hydroxide ions (OH⁻) from the alkaline pore solution (pH typically >13.5 in fresh concrete) attack reactive forms of silica (SiO₂) in the aggregate. The reaction produces a hydrophilic alkali-silica gel that absorbs water and swells, generating internal expansion pressures that crack the aggregate and surrounding paste.
Petrographic identification of ASR requires convergent evidence from multiple criteria per FHWA and ASTM C856:
SEM/EDS confirmation of gel composition (Si + Ca + K/Na)
Microscopic features in thin section: Reactive aggregate particles show internal cracking that radiates from the aggregate into the surrounding paste. The cracks contain ASR gel that is isotropic (remains dark under cross-polarized light) — this is a key diagnostic because crystalline phases show birefringence colors. The gel appears in PPL as clear to brownish amorphous material lining or filling cracks and air voids. In advanced cases, the gel extends throughout the paste as “gel-soaked paste” — the cement paste adjacent to reacting aggregates appears darkened and densified. Under fluorescence microscopy, ASR-affected concrete shows cracks filled with fluorescent epoxy in both aggregate and paste, with characteristic radiating patterns from reactive particles.
SEM/EDS characteristics: ASR gel exhibits a distinctive “cracked mud” texture — desiccation cracks within the gel caused by vacuum drying during SEM preparation. EDS analysis reveals an elemental signature of primarily Si with lesser Ca and traces of K and Na. Fresh gel (higher swelling potential) contains higher K and Na relative to Ca. Aged gel (lower swelling potential, reaction may be complete) shows higher Ca content as Ca replaces Na and K over time.
Reactivity ranking of silica forms (FHWA, most to least reactive): Amorphous silica/volcanic glass > Opal > Tridymite/Cristobalite > Chalcedony > Cryptocrystalline silica > Metamorphically granulated/distorted quartz > Stressed quartz > Imperfectly crystallized quartz > Pure crystalline quartz (essentially non-reactive).
Alkali-Carbonate Reaction (ACR)
Alkali-carbonate reaction (ACR) is a far less common but highly destructive reaction first identified by Swenson (1957) in Kingston, Ontario. It involves the de-dolomitization of specific impure dolomitic limestones: dolomite (CaMg(CO₃)₂) reacts with hydroxide ions to produce brucite (Mg(OH)₂) and calcite (CaCO₃). The expansion mechanism differs from ASR — it is driven by the growth of brucite crystals within a confined space rather than by gel swelling.
Petrographic identification of ACR requires:
Reactive carbonate aggregate: Impure dolomitic limestone with calcite and dolomite in nearly equal amounts; dolomite content may reach ~90% of the carbonate fraction. The insoluble residue (clay, iron sulfides, quartz) constitutes 10–25% of the mass.
Geologic age: All known reactive ACR rocks are from the Ordovician period — a critical clue for narrowing the investigation.
Reaction rims: Dedolomitization rims around reactive carbonate aggregate particles, with spotted brucite crystals (<3 µm) and calcite within the rim.
Myrmekitic texture: Intergrown brucite and calcite within the reaction rim.
Cracking: Cracks radiating from reacting particles into the paste, similar to ASR but without gel exudation.
Alkali threshold: Cement with alkali content below ~0.45% Na₂Oeq is generally considered low enough to prevent significant ACR expansion (Swenson and Gillott, 1960).
Distinction from ASR: ACR does not produce gel exudation; the reaction products are crystalline (brucite and calcite) rather than amorphous gel; the reactive aggregates are impure dolomitic limestones rather than siliceous aggregates; and ACR is geographically restricted to areas where specific Ordovician carbonate rocks are used as aggregate.
Freeze-Thaw Deterioration
Freeze-thaw (FT) damage occurs when concrete is critically saturated — typically when more than approximately 91% of the pore volume is filled with water. Water expands 9% upon freezing; without closely spaced air voids to accommodate this expansion, internal hydraulic and osmotic pressures exceed the tensile strength of the paste and cause cracking.
Petrographic indicators of freeze-thaw damage:
Surface-parallel microcracking: Cracks run parallel to the exposed surface, reflecting the freezing front progression from the surface inward.
Aggregate debonding: Gaps around aggregate particles at the paste-aggregate interface — cracks all the way around the aggregate in the interface zone.
Un-cracked aggregate: A critical distinction from ASR — in classic freeze-thaw damage, the aggregate particles remain uncracked while the paste debonds from them. If aggregates are cracked, ASR or D-cracking should be suspected as a contributing mechanism.
Exposed aggregate: On the concrete surface, aggregate particles are exposed and intact, with the surrounding paste eroded away.
Poor air-void system: The root cause — spacing factor >0.20 mm, specific surface <16 mm⁻¹, or total air content <4% for the given maximum aggregate size.
Popouts: Individual aggregate particles near the surface expand from freeze-thaw and pop out a conical fragment, leaving a shallow depression.
FT damage often co-occurs with ASR. The petrographer must determine the relative contribution of each mechanism by assessing which features dominate: aggregate cracking (ASR) or paste-aggregate debonding (FT).
Sulfate Attack
Sulfate attack encompasses several distinct deterioration mechanisms involving the reaction of sulfate ions (SO₄²⁻) with hydration products of portland cement. Petrography identifies the specific sulfate phase by its morphology, optical properties, and elemental composition.
Ettringite (3CaO·Al₂O₃·3CaSO₄·32H₂O) : Needle-like (acicular) crystals, colorless in PPL, low birefringence (0.010–0.020), length-slow under PLM. In the stereomicroscope, ettringite appears as white to pale-yellow needle crystals lining or filling air voids. Primary ettringite forms during early hydration and is harmless. Secondary ettringite forms later in hardened concrete and may be expansive if space-restricted. Ettringite in air voids is generally harmless because the void provides space for crystal growth. Ettringite filling gaps at aggregate boundaries is characteristic of delayed ettringite formation (DEF) .
Thaumasite (CaSiO₃·CaSO₄·CaCO₃·15H₂O) : Fine fibrous/needle-like crystals similar to ettringite but with moderate birefringence (0.022–0.030) and lower refractive index. Thaumasite requires three conditions for formation: low temperatures (typically <15°C), a carbonate source (from aggregate or carbonation), and a silica source (from aggregate or cement paste). XRD is essential for definitive identification because thaumasite and ettringite are visually similar under the optical microscope.
Delayed Ettringite Formation (DEF) : A specific form of internal sulfate attack caused by high-temperature heat curing or high internal hydration temperatures. The diagnostic petrographic feature is gaps around aggregate particles — cracks observed all the way around aggregate in the interface zone, with gap width positively correlated with aggregate size. The gaps may be empty or filled with ettringite. DEF is caused by the decomposition of primary ettringite at temperatures above approximately 70°C during curing, followed by re-formation of ettringite in the hardened concrete after the paste has gained sufficient stiffness to be damaged by the expansive crystal growth.
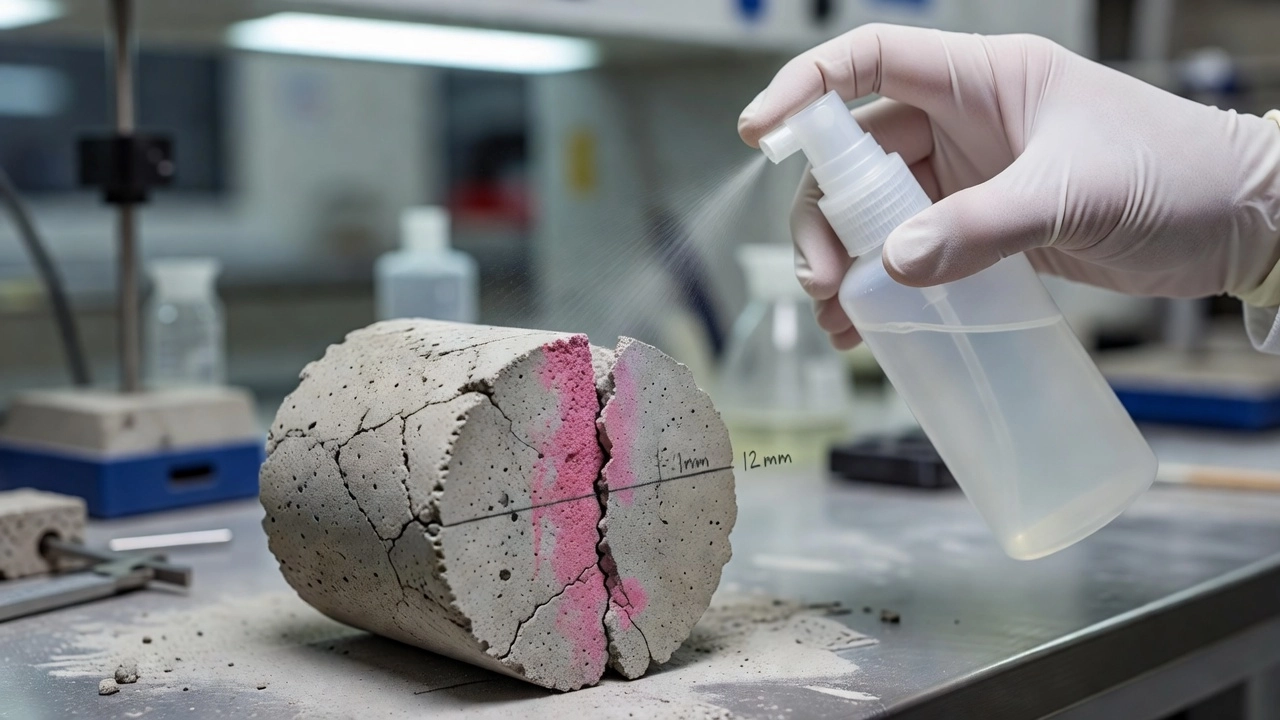
Carbonation Depth by Phenolphthalein
Carbonation is the chemical reaction between atmospheric carbon dioxide (CO₂) and calcium hydroxide (portlandite, Ca(OH)₂) in the cement paste: Ca(OH)₂ + CO₂ → CaCO₃ + H₂O. The reaction consumes portlandite, lowers the pore solution pH from ~12–13 to below 8–9, and advances from the exposed surface inward over time. When the carbonation front reaches embedded steel reinforcement, the passive protective layer is destroyed and corrosion initiates if moisture and oxygen are present.
The phenolphthalein indicator test is the standard method for measuring carbonation depth and is specified in ASTM C856 and RILEM CPC-18. Phenolphthalein is a pH indicator that undergoes a color change from colorless to pink/magenta at a pH threshold of approximately 8–9.5. When applied to a freshly fractured or saw-cut concrete surface:
Pink/magenta color → pH > 8–9.5 → non-carbonated (alkaline) concrete
Prepare a freshly saw-cut or fractured surface — the test must be performed within 15 minutes of cutting to minimize further carbonation from laboratory air exposure
Remove surface bleed water with a hair dryer or fan to prevent stain migration
Spray or apply a 1% phenolphthalein solution in 70% ethanol (isopropyl alcohol is also used)
Wait 1–2 minutes for full color development
Measure the distance from the exposed surface to the pink/colorless boundary at multiple points
Report the maximum, minimum, and average carbonation depth in millimeters
Interpretation considerations per WJE: Phenolphthalein is a pH indicator, not a direct carbonation indicator. The color-change threshold (~pH 8–9.5) is conservative for corrosion risk assessment because steel depassivation occurs at approximately pH 9.5. Other chemicals present in the concrete (surface hardeners, sealers, deicing chemicals) may raise pH and cause false results. Historic concrete (pre-1940s) contains large unhydrated cement particles that may raise local pH when wetted, leading to ambiguous results.
Thin section confirmation by polarized light microscopy is the most accurate method for evaluating carbonation when phenolphthalein results are ambiguous. Under cross-polarized light (XPL) , carbonated cement paste appears golden bright due to the high birefringence of calcite (0.172) compared to the near-isotropic dark appearance of non-carbonated paste. Under fluorescence microscopy, carbonated areas show reduced fluorescence because precipitated calcium carbonate fills capillary pores, densifying the paste and reducing dye penetration.
Carbonation depth relationships: The depth of carbonation is approximately proportional to the square root of concrete age (d ∝ √t), as the process is diffusion-controlled. The most rapid carbonation occurs at 50–70% internal relative humidity — below 50% RH the reaction rate is limited by insufficient water for CO₂ dissolution; above 90% RH the rate is limited by slow CO₂ diffusion through water-filled pores. Dense, well-designed concrete (w/cm ≤ 0.40, properly cured) carbonates very slowly — decades may pass before the carbonation front reaches typical reinforcement depths. Porous, poor-quality concrete may carbonate significantly within months. Carbonation is typically deeper along cracks and porous zones than in sound paste.
Aggregate Identification and Quality
Aggregate identification is a core component of concrete petrography because aggregates constitute approximately 70% of concrete by volume and their characteristics govern both fresh and hardened concrete properties. Per ASTM C295 — Standard Guide for Petrographic Examination of Aggregates for Concrete, the petrographer identifies rock types, mineral composition, physical characteristics, and deleterious constituents.
Classification by Rock Type
The petrographer classifies aggregate particles into their parent rock categories per ASTM C294 — Standard Descriptive Nomenclature for Constituents of Concrete Aggregates:
Igneous rocks: Granite and granodiorite (quartz + feldspar + mica — generally sound if not strained); rhyolite, andesite, basalt (fine-grained to glassy — potentially reactive if volcanic glass is present); tuff (volcanic ash — potentially reactive).
Sedimentary rocks: Limestone and dolomite (carbonate — check chert content and ACR potential); sandstone and quartzite (largely quartz — check cement type and interstitial material); chert (cryptocrystalline silica — potentially reactive); shale and siltstone (may contain reactive opal or clay).
Metamorphic rocks: Gneiss and schist (foliated — may contain strained quartz); metaquartzite (metamorphosed sandstone — potentially reactive); phyllite, argillite, slate (fine-grained — potentially reactive); marble (metamorphosed limestone — generally sound).
Deleterious Constituents
Per ASTM C295, the petrographer specifically identifies:
Opal, chalcedony, cristobalite, tridymite — ASR-reactive forms of silica
Pyrite, marcasite, pyrrhotite — iron sulfides that oxidize in concrete, producing rust staining and potentially expansive reaction products
Soluble sulfates — source of internal sulfate attack
Clay coatings on aggregate surfaces — weaken the aggregate-paste bond
Organic matter — may interfere with cement hydration
Soft, friable particles — reduce concrete strength and abrasion resistance
Identification Techniques
The petrographer uses multiple techniques in sequence per ASTM C295:
Hand specimen examination: Hardness (Mohs scale), acid solubility (effervescence with dilute HCl distinguishes limestone from quartzite), visual features using a hand lens at 10×
Stereomicroscopy: Examination of aggregate surfaces at 5×–50× for particle shape, surface texture, coatings, and fracture type
Polarized light microscopy of thin sections: Optical properties — refractive index, birefringence, extinction angle, crystal form — for precise mineral identification
Staining techniques: Alizarin red S distinguishes calcite (stains red) from dolomite (does not stain)
SEM/EDS: Elemental composition for definitive mineral identification
XRD: Positive identification of crystalline phases and quantitative phase abundance
The petrographic report per ASTM C295 includes: identification of rock types and their relative percentages; description of physical characteristics (shape, texture, coatings, porosity); notations concerning potentially deleterious constituents; and recommendations for further testing if warranted (ASTM C1260 accelerated mortar bar test, ASTM C1293 concrete prism test, ASTM C227 mortar bar expansion test, ASTM C289 chemical test).
Petrography in Forensic Investigation
Forensic petrography applies petrographic methods to legal and engineering failure investigations. It answers the critical question: why did this concrete fail? The FHWA manual describes forensic petrography as “a kind of detective work that begins with the big picture and progresses to smaller details” — moving from the structure scale to the microscopic scale in a systematic narrowing of hypotheses.
The forensic workflow per ASTM C856 and FHWA guidelines follows a progressive sequence:
Problem definition: The investigating engineer defines the observed distress — cracking pattern, location, severity, extent, exposure conditions, construction history, and service environment
Visual examination: As-received cores are photographed, measured, and described for macroscopic features — crack patterns, staining, surface condition, aggregate exposure
Stereomicroscopy: Polished sections and fractured surfaces are examined at 5×–50× for aggregate condition, void system, paste characteristics, and secondary deposits
Polarized light microscopy: Thin sections are examined at 20×–1000× in PPL and XPL for mineral identification, ASR gel detection, carbonation assessment, and cracking path analysis
Fluorescence microscopy: Epifluorescence examination for crack detection, water-cement ratio assessment, and capillary porosity evaluation
SEM/EDS and XRD: Advanced techniques applied when specific phase identification is needed — ettringite vs. thaumasite, gel composition, chloride detection, crystalline phase confirmation
The FHWA petrographic manual illustrates the forensic value with a case study (RJ Lee Group): A state DOT considered replacing a 55-year-old bridge at an estimated cost of $100 million based on visual inspection suggesting severe corrosion of embedded steel. Petrographic analysis of 38 cores revealed that corrosion was not the cause of cracking. The cracks were confined to a 6-foot section near joints where air entrainment was inadequate for freeze-thaw protection. Freeze-thaw damage had allowed moisture ingress that triggered localized ASR, but the ASR was confined to a small perimeter. Outcome: The bridge was repaired rather than replaced, extending service life by approximately 25 years.
Key Forensic Questions Answered by Petrography
Forensic Question
Petrographic Method
Specific Finding
Was the concrete properly air-entrained?
ASTM C457 air-void analysis
Spacing factor > 0.20 mm indicates inadequate entrainment
Did ASR cause the cracking?
PLM + SEM/EDS
Isotropic gel in cracks with Si+Ca+K/Na signature
Is the aggregate reactive?
ASTM C295 petrography of aggregate
Reactive silica forms identified (opal, strained quartz, etc.)
What is the water-cement ratio?
Fluorescence microscopy + SEM
Capillary porosity intensity indicates w/cm range
Has carbonation reached the steel?
Phenolphthalein + PLM
Depth of golden-bright paste under XPL
Is sulfate attack occurring?
PLM + XRD
Ettringite needles vs. thaumasite fibers vs. gypsum
What caused the joint deterioration?
Stereomicroscopy + PLM
D-cracking (aggregate freeze-thaw) vs. ASR vs. inadequate consolidation
The FHWA and ASTM C856 emphasize the “good, bad, and ugly” sampling approach: extract cores from areas showing significant distress (ugly), areas with intermediate conditions (bad), and sound areas of the same concrete mixture (good). A minimum of three cores is required from each category. Core locations are documented on plan drawings with precise coordinates and orientation markings. The core orientation relative to the exposed surface is marked using P-numbers (e.g., P-1222) with graphite pencil — the most durable marking medium per FHWA. Chain of custody is documented for legal proceedings.
Correlating Petrography with Field Inspection
The correlation between field visual inspection findings and petrographic laboratory results is essential for accurate diagnosis of concrete deterioration. The FHWA Three-Volume Framework (Van Dam et al., 2002) formalized this integration:
Volume 1: Systematic guide to field surveying and sampling of pavements
Volume 2: Detailed approach to laboratory analyses of field specimens
Volume 3: Case studies applying the guidelines
Field-to-Lab Correlation Rating System
The British Cement Association framework (Table 23 in FHWA-HRT-04-150) provides a systematic rating approach that bridges field observation and petrographic findings:
Extent Rating (area or length affected):
Rank
Criteria
1
Not significant
2
Slight (<5% of area or length)
3
Moderate (5–20%)
4
Extensive (>20%, not all)
5
Total (all areas affected)
Severity Rating (impact of deterioration):
Rank
Criteria
1
Not significant
2
Minor / cosmetic
3
Unacceptable — requires attention
4
Severe — requires immediate attention
5
Structurally unsafe
Correlations Between Surface Features and Microstructural Causes
Field Observation During Pavement Inspection
Correlated Petrographic Finding
Diagnostic Confirmation
Map cracking / pattern cracking on concrete surface
ASR gel in cracks, isotropic under XPL, radiating from reactive aggregate particles
SEM/EDS confirms Si + Ca + K/Na gel signature; reactive silica minerals present in aggregate
Can be D-cracking (aggregate freeze-thaw), poor consolidation at joint, or ASR
Cores through joint reveal whether aggregate or paste is deteriorated; cracking path analysis
Practical Correlation Workflow
The integration of field inspection and petrography follows a structured workflow:
Field inspection documents cracking pattern, surface condition, joint condition, efflorescence, popouts, and staining using the BCA rating system or ASTM D6433/D5340 PCI survey protocols
Field hypothesis lists potential deterioration mechanisms based on visible features — cracking pattern, location relative to joints, exposure conditions, service age
Guided sampling extracts cores from the good, bad, and ugly locations based on the field hypothesis
Petrographic examination tests the field hypothesis by looking for confirmatory or contradictory microstructural evidence
Integration determines whether microstructural evidence supports the field observations
Diagnosis — if convergent evidence exists from both field and laboratory, a definitive diagnosis is established. If contradictory, the hypothesis is revised and additional testing is performed
The FHWA petrographic manual emphasizes that “access to laboratory-produced specimens of hardened concrete and the mixture proportions… can prove to be very useful.” When supplementary data exist — mix design records, fresh concrete test results, curing records, strength test reports, environmental exposure records — the petrographic interpretation becomes more powerful and definitive. The petrographer must have field context to give meaningful interpretation; petrography without context is incomplete.
Limitations and Co-Occurrence
Several limitations affect the correlation between field inspection and petrography. Co-occurrence of mechanisms is the most common challenge — ASR and freeze-thaw damage frequently occur together because the cracking from one mechanism allows moisture ingress that triggers the other. The petrographer must determine the relative contribution of each mechanism by assessing which features dominate: aggregate cracking (ASR) or paste debonding (freeze-thaw). Sampling representativeness is another limitation — cores taken from small areas may not capture the full range of deterioration present in the structure. Preparation artifacts — cracks induced during coring, sawing, or thin section grinding — can be mistaken for in-situ cracking if fluorescence microscopy is not used to distinguish pre-existing from preparation cracks.
Despite these limitations, concrete petrography remains the definitive forensic method for diagnosing concrete deterioration. The integration of field inspection data with microstructural analysis provides the most complete understanding of why concrete structures deteriorate and what corrective actions are appropriate. For airport pavement management under FAA P-501 and ICAO Annex 14 standards, petrographic analysis of distress areas is the essential final step in the condition assessment process — translating visible surface distress into actionable information about material quality, construction practices, and service life expectations.
Frequently Asked Questions
ASTM C856 (Standard Practice for Petrographic Examination of Hardened Concrete) is the overarching procedure covering the complete petrographic examination of concrete specimens including visual inspection, stereomicroscopy, polarized light microscopy of thin sections, and scanning electron microscopy. It is the general diagnostic standard for identifying deterioration mechanisms and material characteristics. ASTM C457 (Standard Test Method for Microscopical Determination of Parameters of the Air-Void System in Hardened Concrete) is a specific quantitative test focused exclusively on measuring the air-void system parameters — total air content, specific surface, spacing factor, void frequency, and paste-air ratio. While ASTM C856 provides a qualitative and semi-quantitative assessment, ASTM C457 produces numerical results used for freeze-thaw durability evaluation. Both standards are often used in combination: C457 provides the air-void parameters, while C856 provides the broader forensic diagnosis.
Thin section preparation begins with extracting a representative sample from a concrete core or slab. The sample is vacuum-impregnated with low-viscosity epoxy — often containing a fluorescent dye for fluorescence microscopy — to stabilize the microstructure and fill pores and cracks. The impregnated sample is mounted on a glass slide and ground to a thickness of 30 micrometers (0.03 mm), which is the standard thickness at which quartz exhibits first-order gray interference colors under cross-polarized light. For fluorescence microscopy, sections are ground to 20–25 micrometers to prevent background haze. The section is lapped with progressively finer abrasives to achieve a flat, scratch-free surface. A cover slip is applied for standard polarized light microscopy, but fluorescence sections are left uncovered because the cover slip creates a yellow haze under incident UV illumination. The entire process requires skilled labor and specialized equipment including diamond saws, lapping machines, and precision grinding apparatus.
Visual field inspection identifies surface cracking, spalling, scaling, popouts, staining, and joint deterioration. Concrete petrography reveals the microstructural causes behind these surface features. Specifically, petrography can: identify the presence and composition of alkali-silica reaction (ASR) gel within cracks and air voids — visible as isotropic (dark under cross-polarized light) deposits; measure air-void system parameters including spacing factor (critical threshold < 0.20 mm for freeze-thaw durability); detect delayed ettringite formation (DEF) characterized by gaps around aggregate particles; confirm alkali-carbonate reaction (ACR) through dedolomitization rims and brucite formation; quantify carbonation depth using phenolphthalein indicator confirmed by golden-bright carbonate paste in XPL; determine water-cement ratio from capillary porosity; assess degree of hydration of cementitious materials; identify unhydrated cement clinker phases; detect sulfate attack phases (ettringite needles, thaumasite fibers); differentiate between pre-existing cracks and preparation-induced cracks using fluorescence microscopy; and evaluate aggregate quality including reactive silica minerals, strained quartz, and deleterious constituents that visual inspection cannot resolve.
The spacing factor (L̄) is a parameter measured per ASTM C457 that represents half the average distance between air voids in the cement paste. It is the theoretical maximum distance that water in the paste must travel to reach an air void during freezing. The spacing factor is the single most important indicator of freeze-thaw durability in air-entrained concrete. A spacing factor less than 0.20 mm (200 micrometers) is generally considered necessary to protect the concrete from freeze-thaw damage. Values between 0.20 and 0.25 mm provide marginal protection, while values above 0.25 mm indicate inadequate air entrainment and high susceptibility to freeze-thaw scaling and paste deterioration. The spacing factor is calculated from three measurements: the specific surface of the air voids (α), the total air content (A), and the paste content (p). For well-entrained concrete, the spacing factor typically ranges from 0.10 to 0.20 mm, with values below 0.10 mm indicating an excessive number of voids that may reduce compressive strength.
Petrography can distinguish between ASR and freeze-thaw damage through several diagnostic criteria. In ASR, cracking typically initiates within reactive aggregate particles and radiates outward into the surrounding cement paste. The cracks contain isotropic ASR gel that appears dark under cross-polarized light and may exhibit desiccation cracks. The gel is identifiable by SEM/EDS with an elemental signature of Si + Ca + traces of K and Na. Reactive aggregate minerals — opal, chalcedony, tridymite, cristobalite, strained quartz, volcanic glass — are present. In freeze-thaw damage, cracking is typically surface-parallel (horizontal near the exposed surface) and follows the cement paste-aggregate interface — aggregate debonding and gaps around aggregate particles are common. Critically, aggregate particles themselves remain uncracked in freeze-thaw damage, whereas they are cracked in ASR. The air-void system in freeze-thaw damage is inadequate (spacing factor > 0.20 mm, total air content < 4%). Both mechanisms can co-exist in the same concrete, and petrography can identify the relative contribution of each.
In airport pavement forensic investigations, petrography serves as the definitive diagnostic tool for determining why concrete has deteriorated. When PCI surveys reveal cracking, joint deterioration, scaling, or popouts, petrographic analysis of extracted cores establishes the root cause. The investigation typically follows a workflow: field inspection identifies distress patterns and locations; cores are extracted from distressed and sound areas (the good, the bad, and the ugly approach per FHWA guidelines); visual examination and stereomicroscopy of polished sections identify macro-features; thin sections are examined under polarized light and fluorescence microscopy for microstructural analysis; SEM/EDS and XRD are applied for phase confirmation when needed. Petrography can determine whether joint deterioration is caused by freeze-thaw of susceptible coarse aggregate (D-cracking), ASR from reactive aggregate, poor air entrainment, or inadequate consolidation. The findings directly inform repair strategies — whether partial-depth repair, full-depth slab replacement, or surface treatment is appropriate. FAA P-501 and ICAO Aerodrome Design Manual Part 3 provide the framework for concrete quality in airport pavements, and petrography verifies compliance with these standards.
Enhance your concrete forensic investigations
TarmacView provides AI-powered pavement inspection solutions that integrate with petrographic laboratory analysis. Automate the correlation between surface distress patterns observed on airport runways and microstructural findings from petrography. Schedule a demonstration to see how our technology connects field inspection to laboratory diagnosis.
Pavement cores are cylindrical specimens extracted from in-service pavements for laboratory evaluation of layer thickness, density, air voids, binder content, c...
Non-Destructive Testing (NDT) encompasses methods to evaluate material properties, detect defects, and assess structural condition without causing damage. For i...
Map cracking (also called crazing) is a network of shallow, fine, interconnected cracks on the concrete surface forming an irregular pattern. In FHWA LTPP, map ...
30 min read
Concrete Defects
Pavement Distress
+3
Cookie Consent We use cookies to enhance your browsing experience and analyze our traffic. See our privacy policy.