Cathodic Protection (CP)
Cathodic protection is an electrochemical corrosion mitigation technique that prevents reinforcement corrosion in concrete structures by making the steel the ca...
21 min read
Reinforcement
Corrosion protection
+3
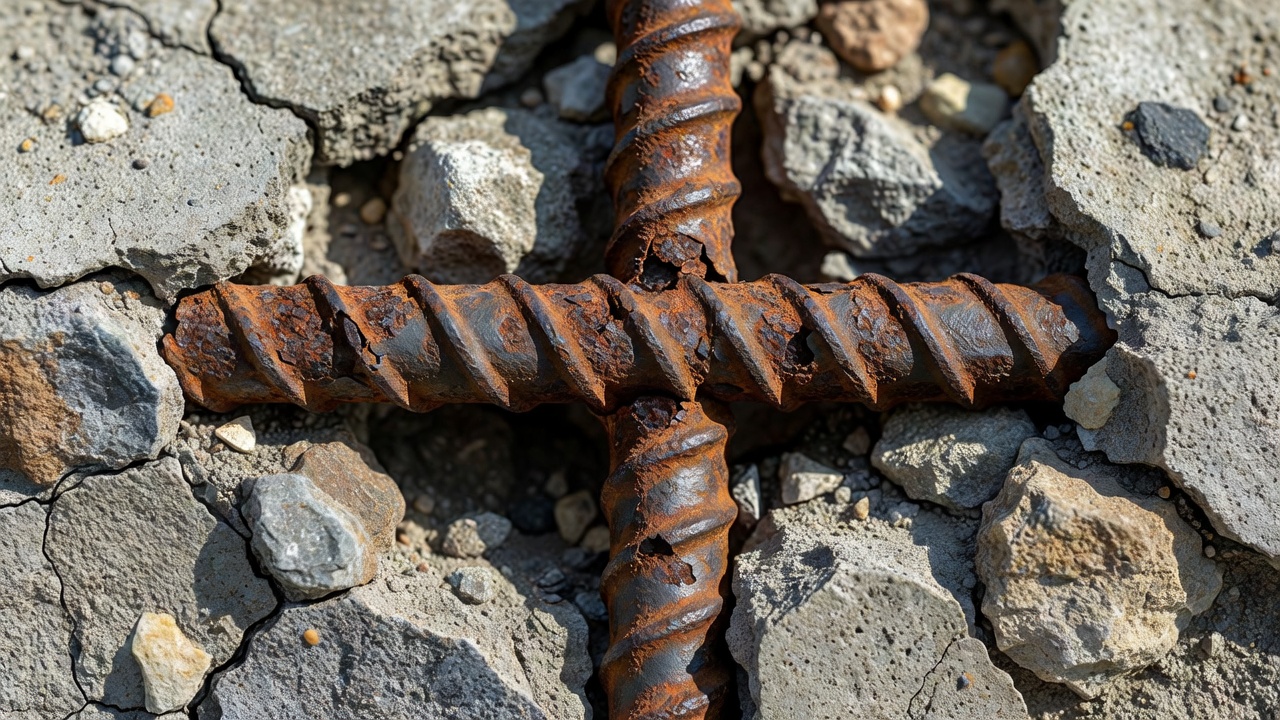
Corrosion of reinforcing steel is the electrochemical deterioration of rebar within concrete, driven by chloride ingress or carbonation destroying the protective passive layer. Corrosion products (rust) occupy 3-6× the original steel volume, causing concrete cracking, spalling, and delamination. Covers mechanism, visible indicators (rust staining, cracking pattern), and NDT assessment methods.
Corrosion of reinforcing steel in concrete is fundamentally an electrochemical process that requires four simultaneous conditions to be present. These four elements constitute what engineers call a corrosion cell. According to ACI 222R-01 (Protection of Metals in Concrete Against Corrosion), the four essential components are the anode — the active corroding steel surface where iron oxidation occurs and electrons are produced; the cathode — a passive or more noble steel surface where oxygen reduction consumes electrons; the electrolyte — the concrete pore water containing dissolved ions that transports ions between anode and cathode; and the electrical connection — the reinforcing steel itself that allows electron flow from anode to cathode. Remove any one of these four elements and active corrosion halts entirely.
The chemical reactions at play are well understood. At the anodic site, iron atoms oxidize to ferrous ions: Fe → Fe²⁺ + 2e⁻. In highly oxidizing environments, ferrous ions further oxidize to ferric ions: Fe²⁺ → Fe³⁺ + e⁻. These ions then react with hydroxyl ions and dissolved oxygen to produce the familiar corrosion products — rust. At the cathodic site, dissolved oxygen and water combine with available electrons: 2H₂O + O₂ + 4e⁻ → 4(OH⁻). This cathodic reaction produces hydroxyl ions that migrate toward the anode through the concrete pore solution, sustaining the electrochemical circuit. The overall reaction can be summarized as iron plus water plus oxygen yielding iron hydroxides and oxides — the rust that eventually destroys the concrete cover.
Corrosion manifests in two distinct forms depending on the spatial relationship between anode and cathode. Macrocell corrosion occurs when the anode and cathode are widely separated — centimeters to meters apart. This is typical in chloride-contaminated structures where localized pitting forms intense anodic zones surrounded by large passive cathodic areas, driving aggressive galvanic currents. Macrocell currents can be measured directly using zero-resistance ammeter techniques and are the dominant mechanism in bridge decks subjected to deicing salts. Microcell corrosion occurs when anode and cathode are at essentially the same location, separated by only millimeters. This is typical of uniform carbonation-induced corrosion where the entire steel surface becomes active simultaneously.
In sound, uncarbonated concrete, the high-alkalinity pore solution (pH 12.5 to 13.5) promotes formation of a tightly adhering passive film on the steel surface — a thin layer of iron oxides (Fe₃O₄ and Fe₂O₃) and hydroxides only nanometers thick. This film acts as an impermeable barrier to further oxidation, reducing the corrosion rate to negligible levels. The passive condition is characterized by a corrosion current density below 0.1 μA/cm², corresponding to a steel section loss rate of less than 0.001 mm per year. Active corrosion begins when the corrosion current density exceeds 1.0 μA/cm² — a tenfold increase from passive conditions. The Pourbaix diagram (potential versus pH) maps the stability regions of iron in aqueous environments and clearly shows that at pH above 12.5, iron lies in the passivation zone where protective oxides are thermodynamically stable. At pH below approximately 9.5, the passive film becomes unstable and active corrosion is thermodynamically possible. At intermediate pH of 9.5 to 10.5, the film is in transition and corrosion state depends on potential.
Chloride-induced corrosion is the most widespread and aggressive form of reinforcement deterioration in modern concrete infrastructure. Chloride ions (Cl⁻) do not directly attack the passive layer through chemical dissolution. Instead, they cause localized breakdown through a multi-step mechanism. Chloride ions migrate through the concrete cover to the rebar surface driven by concentration gradients (Fickian diffusion) and capillary absorption. At the steel surface, Cl⁻ adsorbs onto the passive film at defect sites such as inclusions, mill scale discontinuities, or grain boundaries. Local acidification occurs due to hydrolysis of ferrous ions: Fe²⁺ + H₂O → Fe(OH)⁺ + H⁺. The resulting low-pH environment dissolves the passive film locally, creating an active pit that functions as the anode. Surrounding passive steel acts as the cathode, forming an aggressive macrocell. Pitting corrosion advances through an autocatalytic mechanism — the low pH inside the pit attracts more chloride ions via electromigration, which further accelerates dissolution. Pit growth rates can reach 0.5 to 1.0 mm per year in severe marine environments, leading to rapid localized section loss that is structurally more dangerous than uniform corrosion because it creates stress concentrations in the steel.
The critical chloride threshold (CTL) is the amount of chloride at rebar depth sufficient to initiate corrosion. The threshold varies significantly depending on cement chemistry, concrete quality, and environmental conditions. ACI 222R reports a general range of 0.15 to 0.40 percent chloride by mass of cement for conventionally reinforced concrete. European practice (CEB/Eurocode basis) typically adopts 0.40 percent by mass of cement. In terms of concrete volume, the US practice threshold is approximately 0.6 to 0.9 kg/m³ (1.0 to 1.5 lb/yd³). Research by Hausmann (1967) and Gouda (1970) established that the chloride-to-hydroxyl ratio (Cl⁻/OH⁻) in the pore solution is the controlling parameter — at pH 12.6, the maximum tolerable Cl⁻/OH⁻ ratio is 0.29, while at pH 13.3, it rises slightly to 0.30. The C₃A (tricalcium aluminate) content of cement significantly affects the threshold because C₃A chemically binds chlorides by forming calcium chloroaluminate (Friedel’s salt, 3CaO·Al₂O₃·CaCl₂·10H₂O), removing them from the pore solution and raising the effective threshold. Cements with C₃A content above 8 percent provide substantially better chloride binding than those with low C₃A.
Chlorides enter concrete from both internal and external sources. Internal sources include calcium chloride accelerating admixtures (now restricted to a maximum of 0.1 to 0.5 percent chloride ion by mass of cement in most codes), chloride-contaminated aggregates, and mixing water. The ACI 318 building code has prohibited calcium chloride in reinforced concrete since 1977 for this reason. External sources are far more significant for in-service structures. Deicing salts (sodium chloride NaCl, calcium chloride CaCl₂, magnesium chloride MgCl₂) applied to bridge decks, parking structures, and roadways create the most aggressive chloride exposure in temperate climates. Bridge decks in snowy regions can receive 100 to 500 kg of salt per lane-km per winter season. Marine exposure — sea spray, salt fog, and tidal wet-dry cycling — affects coastal structures with the splash zone being the most severe environment where chloride concentrations can reach 1 to 3 percent by weight of cement within years. Seawater-submerged structures experience slower chloride ingress due to continuous saturation limiting oxygen availability at the rebar, but corrosion can still occur if oxygen is present.
A critical concept in chloride corrosion management is chloride binding. Not all chlorides in concrete contribute to corrosion risk. Chemical binding occurs when calcium aluminates react with chlorides to form Friedel’s salt, immobilizing approximately 40 to 60 percent of total chlorides in ordinary Portland cement concrete. Physical binding involves adsorption of chlorides onto calcium-silicate-hydrate (C-S-H) gel surfaces and entrapment in unconnected pores. Supplementary cementitious materials (SCMs) like fly ash and ground granulated blast-furnace slag increase binding capacity due to their higher aluminate content. Critically, carbonation releases bound chlorides — when CO₂ reacts with Friedel’s salt, it breaks down the chloroaluminate compounds and frees previously immobilized chlorides into the pore solution at the carbonation front. This synergistic effect means that carbonated concrete can have a higher free chloride concentration at the rebar depth than uncarbonated concrete, even when total chloride content is identical.
Carbonation is the chemical reaction between atmospheric carbon dioxide (CO₂) and the alkaline components of hydrated cement paste. The primary reaction is between portlandite — calcium hydroxide Ca(OH)₂ — and dissolved CO₂: Ca(OH)₂ + CO₂ (aqueous) → CaCO₃ (calcite) + H₂O. Secondary reactions consume calcium-silicate-hydrate (C-S-H) gel, calcium aluminates, and calcium aluminoferrites, although more slowly. The precipitation of calcium carbonate fills pores locally, temporarily reducing permeability at the carbonation front — but this benefit is offset by the progressive pH reduction. The reaction reduces the concrete pH from the normal range of 12.5 to 13.5 down to approximately 8.3 in fully carbonated concrete. The depassivation threshold for steel is approximately pH 9.5 — below this value, the passive iron oxide film is no longer thermodynamically stable and begins to dissolve.
Field inspectors use the phenolphthalein indicator test for rapid carbonation detection. A 1 percent phenolphthalein solution in ethanol is sprayed onto a freshly fractured concrete surface. In alkaline concrete (pH above approximately 8.0 to 9.5), the indicator turns pink to magenta. In carbonated concrete (pH below the threshold), the solution remains colorless. The depth of the colorless zone measured from the exposed surface represents the carbonation depth. This test must be performed on a freshly fractured surface, not on cut or sawed surfaces, because the cutting process can smear the alkalinity and produce inaccurate results. The test is immediate, inexpensive, and provides a clear visual boundary between carbonated and uncarbonated concrete.
The depth of carbonation follows a square-root-of-time relationship: d = k × √t, where d is the carbonation depth in millimeters, k is the carbonation rate coefficient in mm/√year, and t is time in years. The rate coefficient k depends strongly on concrete quality and exposure conditions. Dense, well-designed concrete with a low water-cement ratio (below 0.40) exhibits k values of 1 to 3 mm/√year, meaning it would take 70 to 625 years for carbonation to reach a typical 25 mm cover depth. Moderate quality concrete (w/c 0.45 to 0.55) has k of 3 to 5 mm/√year, reaching 25 mm in 25 to 70 years. Poor quality concrete with high w/c ratios (above 0.60) and low cement content has k values of 5 to 10 mm/√year, reaching 25 mm in just 6 to 25 years. Very poor quality concrete exceeds 10 mm/√year, reaching critical cover depths in less than 6 years. These models assume constant exposure conditions — actual field carbonation can be accelerated by cracking, cyclical wetting, and elevated CO₂ concentrations in urban or industrial environments.
The most aggressive relative humidity range for carbonation is 50 to 70 percent. Below 40 percent RH, the pore water is insufficient for CO₂ dissolution and ionic transport. Above 80 percent RH, the water-filled pore network impedes CO₂ gas diffusion because the gas must dissolve and diffuse through water, which is 10,000 times slower than gas-phase diffusion. Wet-dry cycling significantly accelerates carbonation by alternately facilitating CO₂ diffusion during dry periods and providing the necessary water for the carbonation reaction during wet periods. Structures in sheltered, intermittently wetted locations — such as the undersides of bridge decks, parking garage soffits, and interior building columns — are particularly vulnerable to carbonation-induced corrosion.
Unlike chloride-induced corrosion which is localized and pitting in nature, carbonation-induced corrosion tends to be uniform (general) corrosion over large areas. Because the depassivation is widespread — the entire steel surface within the carbonated zone loses protection — anodic and cathodic sites are intimately mixed at the microscale. Corrosion rates in carbonated concrete are typically lower than in chloride-contaminated concrete, rarely exceeding 0.1 mm per year of section loss. However, the large affected area can still lead to significant structural consequences through cumulative section loss and expansive cracking of the cover concrete.
A critical interaction occurs between carbonation and chloride contamination. Carbonation releases bound chlorides from Friedel’s salt, increasing the free chloride concentration at the carbonation front. Simultaneously, the critical chloride threshold decreases as pH drops — at pH 11.5, the threshold may be 2 to 3 times higher than at pH 10.0. The combined effect means that structures with both carbonation and chlorides — such as bridge decks subjected to both deicing salts and atmospheric CO₂ — experience accelerated corrosion at lower total chloride concentrations than either mechanism alone would predict. This synergistic deterioration is one of the most challenging durability problems in existing concrete infrastructure.
The corrosion of iron produces a range of compounds depending on oxygen availability, moisture conditions, and the presence of aggressive ions. Zhao et al. (2011) conducted extensive X-ray diffraction (XRD), thermogravimetric (TG), and differential thermal analysis (DTA) of rust samples collected from reinforced concrete structures in various environments and identified eight distinct compounds. The most common are ferrous oxide (FeO, wüstite) — black in color with a volume expansion of 1.8 times the original iron; magnetite (Fe₃O₄) — also black, expanding to 2.0 times; ferrous hydroxide (Fe(OH)₂) — greenish-white, expanding to 3.75 times; ferric hydroxide (Fe(OH)₃) — red-brown, expanding to 4.2 times; goethite (α-FeOOH) — yellow-brown; akaganeite (β-FeOOH) — brown, chloride-rich; and lepidocrocite (γ-FeOOH) — orange-brown. Fully hydrated ferric hydroxide (Fe(OH)₃·3H₂O) reaches the maximum expansion ratio of 6.4 times the original iron volume. Although Fe₂O₃ (hematite) is frequently detected in rust samples, it is generally considered to originate from mill scale formed during steel manufacturing rather than from the corrosion process itself, as its formation requires temperatures above 200°C.
The volume expansion ratio — the volume of corrosion product divided by the volume of original iron consumed — is the fundamental parameter governing concrete cover cracking. The overall expansion range is 2.0 to 6.4 times, with the specific ratio depending on the corrosion product mix formed under given environmental conditions. The type of corrosion product formed depends primarily on oxygen availability and moisture: in oxygen-rich environments, higher oxides and hydroxides dominate (Fe(OH)₃, γ-FeOOH), producing greater expansion; in oxygen-limited environments, lower oxides dominate (Fe₃O₄, FeO), producing less expansion but potentially deeper corrosion penetration. Interior dry environments typically produce goethite and maghemite with lower expansion coefficients (1.8 to 2.5). Coastal and marine environments produce akaganeite — a chloride-rich phase that forms preferentially in the presence of high chloride concentrations — with expansion coefficients of 2.0 to 3.5. Industrial environments with both chloride and sulfate exposure produce mixed hydroxy-oxides with expansion reaching 2.5 to 6.0.
The expansive pressure generated by rust formation inside confined concrete is on the order of 50 to 100 MPa. This exceeds the tensile strength of most structural concrete by a factor of 10 to 50 — typical concrete tensile strength ranges from 2 to 5 MPa. The consequences are predictable and dramatic: concrete cracking begins at corrosion depths as small as a few tens of micrometers (0.02 to 0.05 mm of uniform steel loss). Research indicates that a volume expansion of just 1.5 to 2 percent is sufficient to crack the concrete cover — meaning the first thin layer of rust formation is already enough to initiate damage. Once cracking occurs, it creates preferential pathways for moisture, oxygen, and additional chlorides to reach the rebar, accelerating the corrosion process in a self-perpetuating cycle. The crack also reduces confinement, allowing more space for corrosion products to expand without generating additional tensile stress — this is why corrosion rates can appear to slow after extensive cracking, even though the underlying section loss continues.
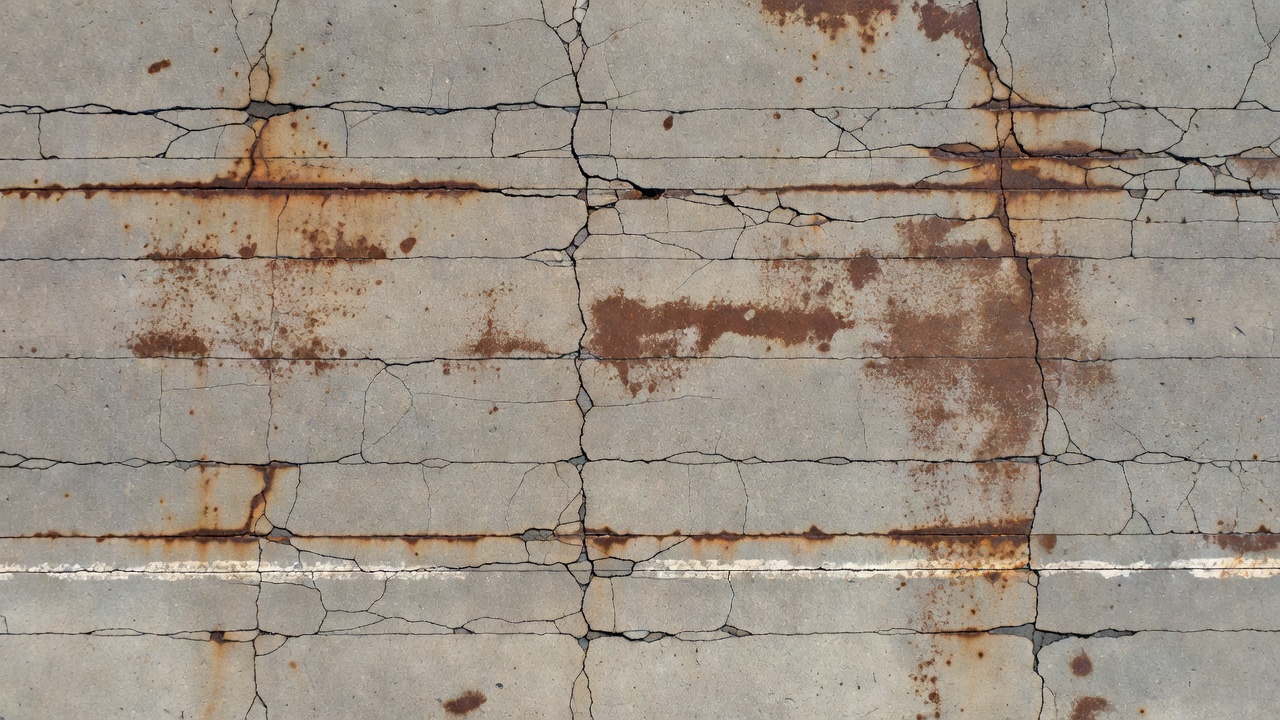
The visible manifestations of reinforcement corrosion follow a characteristic progressive sequence that allows experienced inspectors to assess the severity and extent of damage from the concrete surface. The earliest visible sign is rust staining — reddish-brown to dark brown discoloration on the concrete surface caused by soluble iron compounds (primarily Fe²⁺ and Fe³⁺ ions) migrating through the concrete pore network and emerging at the surface. These stains often follow the geometric pattern of the underlying reinforcement grid, providing a visual map of active corrosion zones. Stain intensity correlates roughly with corrosion activity but not directly with section loss — a small active pit can produce extensive surface staining while advanced uniform corrosion may produce relatively little surface discoloration if the concrete is dense.
Following staining, fine longitudinal cracking develops parallel to the reinforcement direction. These cracks result from the tensile hoop stresses generated by expanding corrosion products around individual bars. The crack orientation follows the rebar layout — longitudinal cracks appear directly above and aligned with underlying bars. Crack widths progress from hairline (below 0.1 mm) to moderate (0.1 to 0.5 mm) to advanced (above 0.5 mm). Crack widths exceeding 1.0 mm indicate severe corrosion where concrete cover integrity is substantially compromised and immediate intervention is likely required. As multiple adjacent bars corrode, a grid pattern cracking emerges — cracks in two orthogonal directions following the rebar grid pattern of the structure.
Delamination represents the next stage, where internal horizontal cracks propagate within the concrete at the level of the reinforcing steel, separating the cover concrete from the underlying sound material. Delamination is often invisible to the naked eye but can be detected by hammer sounding or chain dragging — standard techniques defined in ASTM D4580 (Standard Practice for Measuring Delamination in Concrete Bridge Decks). Sound concrete produces a clear, ringing tone when struck with a hammer or chain. Delaminated concrete produces a hollow, drum-like sound because the separated layer vibrates independently. Chain dragging across a bridge deck produces a distinctive rattle over delaminated areas that is clearly distinguishable from the solid sound over intact concrete. Skilled inspectors can map delamination boundaries with remarkable precision using these simple acoustic methods, and the results can be marked directly on the deck surface with spray paint for documentation and repair planning.
Spalling is the terminal visible stage where delaminated concrete breaks away from the surface, falling in flakes or chunks. Spalling typically begins at corners, edges, and construction joints where concrete cover is thinnest, then progresses inward as corrosion advances. Exposed rebar with visible rust and measurable section loss is the definitive indicator of advanced corrosion. Concrete fragments on the ground beneath the structure are an obvious but often overlooked sign — they represent a safety hazard from falling debris and indicate that the structure requires immediate attention. Other indicators include efflorescence — white crystalline deposits of calcium carbonate — which may accompany carbonation and indicate that moisture is moving through the concrete. Any exposed rebar with visible wastage (reduction in bar diameter) requires structural evaluation by a licensed professional engineer to determine remaining capacity. ACI 222R emphasizes that corrosion must be confirmed via half-cell potential mapping or direct exposure because rust staining alone can originate from shallow iron inclusions, mill scale particles in the aggregate, or surface contamination that does not represent active structural corrosion.
TarmacView’s defect classification system includes corrosion as a distinct defect head label applied to surface-visible manifestations of reinforcement corrosion. The system detects and classifies visible corrosion indicators including rust staining, corrosion-related cracking, and exposed corroded rebar in surface-level photographic data. The corrosion label is applied through TarmacView’s automated visual analysis pipeline when characteristic visual patterns — reddish-brown discoloration, linear staining aligned with expected reinforcement locations, and cracking patterns associated with corrosion-induced expansion — are identified in inspection imagery. The system captures defect location, extent, and severity attributes that can be integrated into condition assessment workflows and bridge management systems (BMS).
TarmacView classifies visible corrosion staining as a high-severity defect consistent with the defect progression models used in industry practice. This classification reflects the fact that visible rust staining indicates that corrosion has already progressed through the initiation stage and is actively producing expansive corrosion products that will eventually crack and spall the concrete cover. The high-severity designation triggers appropriate inspection and maintenance response workflows.
TarmacView’s classification is surface-visible only — it detects corrosion indicators on accessible concrete surfaces. Subsurface corrosion without surface manifestation cannot be detected through visual means alone and requires complementary NDT methods such as half-cell potential mapping, ground-penetrating radar, or infrared thermography. The corrosion label is therefore most valuable as an early-warning indicator for structures where staining first appears and as a damage documentation tool for advanced cases where cracking, spalling, and exposed rebar are already present. When combined with NDT data, TarmacView’s visual corrosion mapping provides comprehensive documentation of both surface and subsurface conditions for effective repair planning.
All visual inspection methods, including TarmacView’s automated classification, share inherent limitations in corrosion detection. The fundamental constraint is that corrosion initiates at the rebar depth — typically 25 to 75 mm below the surface — and may progress for years before any visible manifestation appears. During this initiation phase, chlorides accumulate at the rebar through diffusion, the passive layer breaks down, and active corrosion begins, all without any externally visible indication. The Tuutti model of corrosion service life explicitly divides the structure’s useful life into an initiation period (during which aggressive agents penetrate to the rebar but no damage occurs) and a propagation period (during which corrosion products accumulate and damage becomes visible and progresses). In chloride-contaminated bridge decks with adequate concrete cover (50 to 75 mm), the initiation period can last 10 to 20 years or more, during which no surface signs are present. In carbonated structures, the initiation period is determined by the CO₂ diffusion rate and can similarly span decades for good-quality concrete.
Surface-visible inspection also cannot quantify corrosion rate — the speed at which section loss is occurring. A structure with extensive rust staining may have active corrosion rates of 0.01 mm/year (low) or 0.1 mm/year (high) — the visual appearance alone cannot distinguish between them. Corrosion rate requires electrochemical measurement using linear polarization resistance (LPR) techniques that apply a small voltage perturbation and measure the resulting current response. These measurements are not achievable through visual means alone.
Subsurface delamination — horizontal cracking at rebar depth — is invisible until the delaminated area becomes large enough to produce a detectable acoustic response during chain dragging or hammer sounding. Small delaminations may go undetected during routine visual inspection, and even moderate delaminations may be missed if the inspection does not include systematic sounding. The depth of carbonation and the chloride concentration profile at various depths require destructive sampling (drilling and collecting dust at incremental depths for chemical analysis) or specialized NDT — they cannot be assessed from surface appearance. These limitations mean that visual-only inspection systems, no matter how sophisticated, must be used as part of a multi-method assessment program that includes electrochemical testing and, where warranted, limited destructive investigation.
TarmacView’s defect classification specifically identifies surface-visible corrosion and is intended to complement, not replace, comprehensive NDT assessment. The highest value of automated visual corrosion detection lies in its ability to systematically and consistently document the location, extent, and severity of visible corrosion indicators across large structures — enabling inspectors to focus NDT resources on areas with the greatest likelihood of active subsurface corrosion. This targeted approach optimizes inspection resources while providing complete documentation of visible conditions for condition rating, repair planning, and future reference.
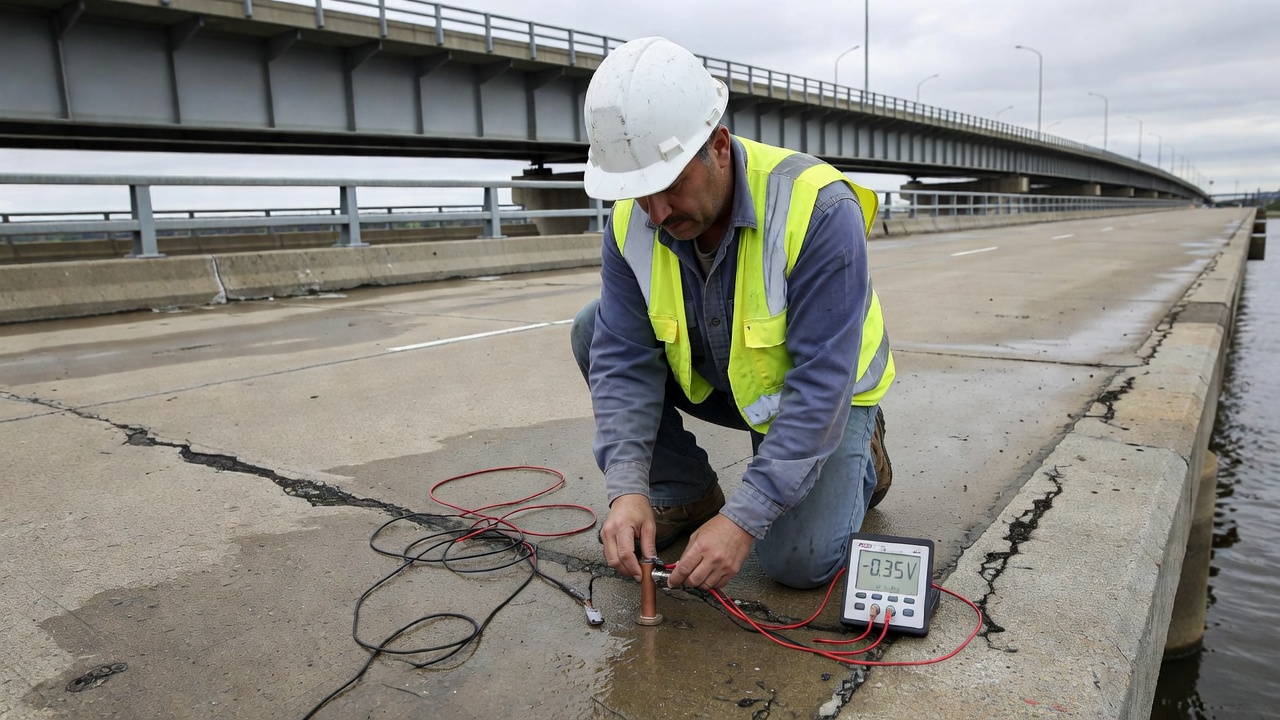
Half-cell potential testing is the most widely used electrochemical method for detecting active corrosion in reinforced concrete. The technique measures the electrochemical potential of the reinforcing steel relative to a reference electrode placed on the concrete surface. The standard reference electrode for field use is the copper/copper sulfate (Cu/CuSO₄) half-cell, commonly abbreviated as CSE. The measurement circuit consists of the reference electrode connected to a high-impedance voltmeter (>10 MΩ), which is connected to the reinforcing steel through an exposed bar or a drilled and tapped connection. Electrical contact at the concrete surface is maintained through a wet sponge or porous plug. The operator moves the reference electrode across the concrete surface in a grid pattern, typically at 1-meter spacing for initial surveys and 0.5-meter or closer for detailed investigation of suspect areas.
Interpretation follows ASTM C876 criteria. Potentials greater than −200 mV (CSE) indicate a less than 10 percent probability of active corrosion. Potentials between −200 and −350 mV represent an uncertain zone where corrosion activity is possible but not confidently predicted. Potentials more negative than −350 mV indicate a greater than 90 percent probability of active corrosion. These criteria apply to uncoated steel reinforcement in atmospherically exposed concrete with normal moisture content. The most valuable output of half-cell testing is a potential contour map — a plan view of the structure showing zones of more negative potential (anodic active areas) and more positive potential (cathodic passive areas). The steepest potential gradients — where potential changes by more than 100 mV over a short distance — indicate the boundaries between active and passive zones where corrosion current is concentrated.
Critical factors influence half-cell readings beyond corrosion activity itself. Concrete moisture content significantly affects readings — wet concrete produces more negative potentials even without active corrosion. Concrete carbonation shifts potentials by −200 to −400 mV. Chloride contamination produces potentials of −400 to −600 mV in wet concrete. Dry concrete produces potentials of 0 to +200 mV regardless of corrosion state. Oxygen availability is a major factor — water-saturated concrete with limited oxygen can produce potentials of −900 to −1000 mV that do not necessarily indicate active corrosion; rather, these readings reflect the low-oxygen condition of submerged or continuously saturated concrete. The RILEM TC 154-EMC technical committee provides comprehensive guidance on interpreting half-cell data accounting for these confounding factors, including tables of expected potential ranges for various concrete conditions.
The electrical resistivity of concrete governs the flow of corrosion current between anodic and cathodic sites. Low-resistivity concrete provides a more conductive path for ionic transport through the pore solution, enabling higher corrosion rates. Resistivity is measured using the Wenner four-probe array — four equally spaced electrodes pressed against the concrete surface. An alternating current is applied between the outer two probes, and the resulting potential difference is measured between the inner two probes. Resistivity ρ is calculated as: ρ = 2πa × V/I, where a is the probe spacing, V is the measured voltage, and I is the applied current. The use of alternating current prevents polarization of the electrodes and avoids the direct current errors that would affect half-cell measurements on the same surface.
Interpretation guidelines classify corrosion risk based on resistivity. Values below 5 kΩ·cm indicate very high corrosion probability — the concrete provides essentially no resistance to ionic current flow. Values of 5 to 10 kΩ·cm indicate high probability. Values of 10 to 20 kΩ·cm indicate low to moderate probability. Values above 20 kΩ·cm indicate low probability — corrosion is unlikely even if other conditions (potential, oxygen, chlorides) are favorable. The dominant factor controlling resistivity is moisture content — saturated concrete can have resistivity below 10 kΩ·cm, while oven-dry concrete can exceed 1000 kΩ·cm. Temperature also significantly affects resistivity, with a 20 to 30 percent decrease for each 10°C increase. Water-cement ratio and pore structure refinement (by SCMs) are secondary but important factors — well-cured, low-w/c concrete with silica fume can have 5 to 10 times higher resistivity than conventional concrete.
Sadowski (2013) proposed a combined assessment methodology using both half-cell potential and concrete resistivity to classify concrete into three area types. Type 1 areas have low potential (below −350 mV) and low resistivity (below 10 kΩ·cm) — indicating greater than 90 percent probability of active corrosion. Type 2 areas have high potential (above −200 mV) but low resistivity (below 10 kΩ·cm) — corrosion is uncertain but the low resistivity means that if depassivation occurs, corrosion rates will be high. Type 3 areas have high potential (above −200 mV) and high resistivity (above 20 kΩ·cm) — corrosion probability is below 10 percent. This combined approach is more reliable than either method alone.
Linear polarization resistance (LPR) is the only field technique that provides a direct quantitative measurement of corrosion rate — the speed at which steel section loss is occurring. The method applies a small voltage perturbation (typically ±10 to 30 mV around the corrosion potential) and measures the resulting current response. The polarization resistance (Rp) is calculated from the slope of the potential-current curve at the corrosion potential. Corrosion current density (icorr) is derived using the Stern-Geary equation: icorr = B / Rp, where B is the Stern-Geary constant (approximately 26 mV for steel in the active state in concrete, ranging from 13 to 52 mV depending on whether the anodic or cathodic reaction is rate-controlling).
The corrosion rate in terms of steel section loss is calculated as: Vcorr (mm/year) = 0.0116 × icorr (μA/cm²). Interpreting icorr values follows established thresholds. Values below 0.1 μA/cm² (0.001 mm/year) indicate passive condition — negligible corrosion. Values of 0.1 to 0.5 μA/cm² (0.001 to 0.006 mm/year) indicate low corrosion. Values of 0.5 to 1.0 μA/cm² (0.006 to 0.012 mm/year) indicate moderate corrosion. Values of 1.0 to 5.0 μA/cm² (0.012 to 0.058 mm/year) indicate high corrosion. Values above 5.0 μA/cm² (above 0.058 mm/year) indicate very high accelerated corrosion. At a corrosion rate of 5 μA/cm², a #4 (12 mm) reinforcing bar would lose approximately 25 percent of its cross-sectional area in 20 years — a rate that clearly requires intervention.
Commercial LPR instruments include the iCOR® (Giatec Scientific), Gecor 8 (James Instruments), and other devices using the confined guard ring configuration. The guard ring confines the polarization current to a known area of steel surface, typically 100 to 200 cm², enabling reliable icorr calculation by preventing the applied current from spreading to an unknown area. Limitations include sensitivity to temperature and humidity (measurements should be taken at relatively stable temperature, ideally 20±5°C), the need for knowledge of the polarized area (which the guard ring addresses), and potential underestimation of localized pitting corrosion (which averages the signal over the measurement area). The maximum effective depth for reliable LPR measurement is approximately 10 cm below the concrete surface. ASTM G59 provides the standard test method for laboratory LPR measurements, while RILEM TC 154-EMC provides guidelines for field application.
| Method | Principle | Application |
|---|---|---|
| Cover meter (pachometer) | Electromagnetic induction to locate rebar and measure concrete cover depth | Verifying adequate cover before accepting new construction; mapping cover for corrosion risk assessment |
| Chloride profiling (ASTM C1152/C1218) | Chemical analysis of dust samples from incremental depth drilling (typically 5 to 10 mm increments) | Determining chloride concentration versus depth; locating chloride front relative to rebar; computing diffusion coefficient |
| Carbonation depth | Phenolphthalein indicator on fresh fracture surface | Measuring depth of carbonation front from exposed surface; verifying cover adequacy against carbonation |
| Ground Penetrating Radar | Electromagnetic wave reflection from rebar and subsurface defects at 900 MHz to 2.6 GHz | Mapping rebar location and cover; detecting voids, delamination, and moisture accumulation over large areas |
| Acoustic emission | Detection of stress waves from active corrosion-induced cracking | Continuous monitoring of damage progression; locating active corrosion sources |
| Infrared thermography | Surface temperature differentials caused by subsurface delamination and moisture | Rapid large-area scanning of bridge decks for delamination |
Corrosion severity is classified using a four-stage model adapted from the Tuutti service life model and FHWA guidance. Stage 1 — Initiation represents the period during which aggressive agents (chlorides or CO₂) penetrate the concrete cover and reach the rebar, but corrosion has not yet initiated. No visible signs are present. Half-cell potentials are above −200 mV. Corrosion current density is below 0.1 μA/cm². Section loss is zero. Stage 2 — Active, No Delamination begins when corrosion initiates. Rust products begin forming but have not yet generated sufficient expansive pressure to crack the concrete. Rust staining may appear on the surface as the first visible indicator. Half-cell potentials drop below −350 mV. Corrosion current density ranges from 0.1 to 1.0 μA/cm². Section loss is less than 1 percent. Stage 3 — Delamination occurs when expansive pressure exceeds the tensile strength of the concrete cover. Longitudinal cracking appears along the rebar. Hammer sounding reveals hollow, delaminated areas. Corrosion current density ranges from 1.0 to 5.0 μA/cm². Section loss reaches 1 to 5 percent. Stage 4 — Spalling is the terminal stage where cover concrete breaks away and rebar becomes exposed. Corrosion current density exceeds 5.0 μA/cm². Section loss exceeds 5 percent. Visible reduction in bar diameter becomes measurable with calipers.
Section loss severity is classified in terms of structural significance. Loss below 5 percent represents low risk with minimal effect on structural capacity. Loss of 5 to 10 percent is moderate — some capacity reduction may occur and bond between steel and concrete may be affected. Loss of 10 to 20 percent is high — significant capacity reduction requiring professional engineering evaluation and likely load rating or strengthening. Loss exceeding 20 percent is critical — structural deficiency requiring urgent intervention, typically including supplemental reinforcement, load restriction, or component replacement. These thresholds are general guidelines — actual structural significance depends on the member type, loading conditions, and the specific location and distribution of section loss along the bar and across the member.
The European standard EN 1504-9 provides a comprehensive framework of 11 principles for concrete repair directly linked to corrosion management. Principle 1 addresses protection against ingress (coatings, sealers, impregnation). Principle 2 covers moisture control. Principle 3 addresses concrete restoration through patch repair. Principle 4 covers structural strengthening. Principles 7 through 11 directly address corrosion: preserving or restoring passivity (realkalization, chloride removal), increasing resistivity (hydrophobic impregnation), cathodic control (limiting oxygen at the cathode), cathodic protection (ICCP or galvanic anodes), and control of anodic areas (coating rebar, inhibitors).
ACI 318-19 defines exposure classes for corrosion (Class C) that establish minimum design requirements for new structures. Class C0 (negligible exposure) has no special requirements beyond minimum structural concrete provisions. Class C1 (moderate exposure such as residential footings, interior slabs not exposed to deicing salts) requires maximum water-cementitious materials ratio of 0.50, minimum compressive strength of 4000 psi, and minimum concrete cover of 1.5 inches (38 mm). Class C2 (severe exposure from deicing salts or seawater spray) requires maximum w/cm of 0.45, minimum strength of 4500 psi, and minimum cover of 2.0 inches (50 mm). Class C3 (extreme exposure from direct salt water, aggressive chemicals, or tidal/marine splash zones) requires maximum w/cm of 0.40, minimum strength of 5000 psi, and minimum cover of 2.5 to 3.0 inches (63 to 75 mm). These design provisions aim to extend the initiation period to the design service life — typically 50 to 75 years for bridges and 75 to 100 years for major infrastructure.
Cathodic protection (CP) is the only corrosion mitigation method that halts active corrosion across the entire treated structure, regardless of chloride content or carbonation depth. The principle is to apply an external current to shift the reinforcing steel potential into the immunity or passivation range, making the entire steel surface a cathode. Two types exist. Impressed Current Cathodic Protection (ICCP) uses an external DC power supply (rectifier) connected to an inert anode system — typically titanium mesh with mixed metal oxide coating (MMO), conductive polymer coatings on a copper bus, or activated titanium ribbons installed in slots cut into the concrete surface. ICCP operates at current densities of 2 to 20 mA/m² of steel surface area and has a life expectancy of 20 to 30+ years with proper monitoring and maintenance. The rectifier allows adjustment of output current to match changing environmental conditions. Galvanic Cathodic Protection (GCP) uses sacrificial anodes (zinc or magnesium) that corrode preferentially to protect the steel, using the naturally occurring potential difference between the anode material and the steel. GCP operates at lower and non-adjustable current densities of 0.5 to 8 mA/m² and has a life expectancy of 10 to 20 years depending on anode mass and consumption rate. GCP is preferred for smaller areas, patch repairs in marine structures, and areas where external power supply is impractical or where the cost of ICCP installation cannot be justified.
The widely accepted criterion for CP effectiveness is the 100 mV polarization decay or 100 mV potential shift (NACE SP0290). After a brief interruption of the applied current (typically 4 to 24 hours), the steel potential should decay by at least 100 mV from its polarized value, indicating that the cathodic reaction is successfully suppressing the anodic corrosion reaction. Alternatively, a potential shift of more than 100 mV in the negative direction from the native (unprotected) potential is also accepted. CP systems require permanent reference electrodes (typically silver/silver chloride or manganese dioxide) embedded in the concrete for ongoing monitoring.
Electrochemical chloride extraction (ECE) applies a high current density — 0.5 to 2 A/m² — between an external anode and the reinforcing steel for a short treatment period of 6 to 8 weeks. This is 10 to 100 times the current density used in CP. The high current drives negatively charged chloride ions away from the rebar toward the external anode at the concrete surface through electromigration. Typical chloride removal efficiency is 30 to 60 percent of total chlorides, with the highest removal from the near-surface concrete and diminishing effectiveness at greater depths. ECE is a one-time treatment, not a permanent installation — the external anode and electrolyte system are removed after treatment.
Critical limitations apply. ECE cannot be used on prestressed or post-tensioned structures due to the risk of hydrogen embrittlement — the high current density can generate atomic hydrogen at the steel surface that diffuses into high-strength steel, causing brittle fracture at stress levels well below design capacity (ACI 222R explicitly warns against this application). ECE may alter the concrete chemistry, potentially increasing alkali-aggregate reaction risk if reactive aggregates are present. The process also generates heat and can cause significant drying of the concrete near the surface, which may require rewetting and extended curing after treatment. ECE requires careful monitoring by qualified operators and is typically performed by specialized electrochemical repair contractors.
Electrochemical realkalization treats carbonation-induced corrosion by applying an electric field between an external anode (metal mesh embedded in an alkaline electrolyte-soaked blanket) and the rebar, while an alkaline electrolyte (typically 1 M sodium carbonate Na₂CO₃ or potassium hydroxide KOH) is maintained at the external anode surface. The treatment restores concrete pH from 8 to 9 up to above 10.5 in 1 to 2 weeks by driving alkaline ions into the concrete. The current density is similar to ECE (approximately 1 A/m²), but the treatment duration is shorter. Realkalization is specifically for carbonation-affected structures and is not effective for chloride-induced corrosion. After treatment, the concrete surface is typically washed to remove residual alkali, and a protective coating is applied to prevent rapid recarbonation.
The standard patch repair procedure per ACI 546R (Guide to Concrete Repair) involves a systematic sequence of operations. First, remove all loose, contaminated, and delaminated concrete to expose sound substrate at least 25 mm behind the rebar. Second, clean exposed rebar to SSPC-SP6 (commercial blast cleaning — removal of all visible contaminants and mill scale) or SSPC-SP10 (near-white blast cleaning — removal of nearly all discoloration) standards, depending on the severity of the exposure. Third, assess the remaining rebar cross-section — bars with greater than 20 percent section loss require supplemental reinforcement. Fourth, apply anti-corrosion primer or coating to the cleaned rebar (typically zinc-rich or epoxy-based). Fifth, apply a bonding agent to the substrate. Sixth, place repair mortar conforming to ASTM C928 with minimum compressive strength of 45 MPa (Class R4) and minimum bond strength of 2.0 MPa. Seventh, cure per material specifications — typically 7 days of wet curing or application of a curing compound. Eighth, apply a protective coating system to the entire repaired area and adjacent concrete to prevent recurrence.
Concrete removal methods include hydro-demolition (high-pressure water jetting at 1000 to 3000 bar) — widely considered the best method for large areas as it selectively removes deteriorated concrete without damaging sound material or the steel-concrete bond, leaving a rough surface profile ideal for repair mortar adhesion. Chipping hammers (pneumatic or electric) are low-cost and widely available for small areas but risk damaging the rebar-concrete bond and creating microcracks in the surrounding sound concrete. Diamond saw cutting provides precise boundaries for removal limits but is slow and linear only — suitable for defining repair boundaries but not for bulk removal.
| Coating | Standard | Thickness | Chloride Tolerance | Service Life |
|---|---|---|---|---|
| Epoxy coating | ASTM A775/AASHTO M284 | 130-300 μm | Moderate; defects critical | 15-30 years |
| Galvanizing (hot-dip) | ASTM A767 | 0.8-1.2 mm | Moderate | 20-40 years |
| Stainless steel clad | ASTM A955 | Full clad (entire bar cross-section) | Excellent | >75 years |
| Fusion-bonded epoxy | ASTM D3963 | 175-300 μm | Good | 20-40 years |
Epoxy coating per ASTM A775 requires a maximum of 6 pinhole defects per meter and a maximum of 2 percent damaged area on the bar surface. Critical note: epoxy-coated bars in the Florida Keys bridges experienced premature failure due to poor surface preparation prior to coating application and coating debonding during handling, transportation, and placement on site. Any damage to epoxy coating during construction creates localized corrosion sites (anodes) that can be more aggressive than uncoated bars because of the severe macrocell formed between the small exposed steel area (anode) and the large coated area (cathode). For this reason, many agencies now require the use of stainless steel or galvanized bars in the most severe exposure classes rather than relying on organic coatings.
Corrosion inhibitors are chemical admixtures added to concrete during mixing or applied as surface treatments that migrate to the rebar through diffusion. Calcium nitrite (Ca(NO₂)₂) is the most widely used anodic inhibitor. Its mechanism involves competition with chloride ions at the steel surface — NO₂⁻ ions react with ferrous ions Fe²⁺ to reform the protective passive layer (γ-Fe₂O₃) while Cl⁻ ions attempt to break it down. The inhibitor must be added at sufficient concentration to exceed the Cl⁻/NO₂⁻ ratio threshold; if the threshold is exceeded, corrosion becomes concentrated at fewer but more aggressive pits. Typical dosage is 2 to 6 L/m³ of 30 percent solution, corresponding to protection against chloride contents up to approximately 0.7 to 1.2 percent by mass of cement. Amine/carboxylate blends (mixed inhibitors that inhibit both anodic and cathodic reactions) and migrating corrosion inhibitors (amine-based compounds that volatilize and diffuse through concrete to the rebar) are also available but have less established long-term field performance data in structural concrete.
The economics of corrosion repair strongly favor early intervention. Applying surface sealers or anti-carbonation coatings costs $50 to $100 per square meter and extends service life by 10 to 20 years. Localized patch repair costs $200 to $400 per square meter with a service life extension of 5 to 15 years. Moderate spalling repair requiring substantial concrete removal and reinstatement costs $500 to $800 per square meter for 10 to 20 years of additional life. Severe spalling requiring full-depth deck or beam replacement costs $1,000 to $2,000 per square meter for 20 to 50 years of service life. Cathodic protection (ICCP) retrofit installation costs $100 to $500 per square meter with 20 to 30+ years of service life at minimal ongoing maintenance cost. These FHWA and industry cost estimates demonstrate that delaying corrosion intervention by even 5 years can double or triple the ultimate repair cost — the classic “5-year delay doubles cost” observation widely cited in bridge management literature.
| Standard | Title | Application |
|---|---|---|
| ASTM C876-15 | Standard Test Method for Corrosion Potentials of Uncoated Reinforcing Steel in Concrete | Half-cell potential testing |
| ASTM G59-97(2020) | Standard Test Method for Conducting Potentiodynamic Polarization Resistance Measurements | Corrosion rate measurement (LPR) |
| ASTM C1152 | Standard Test Method for Acid-Soluble Chloride in Mortar and Concrete | Total chloride content analysis |
| ASTM C1218 | Standard Test Method for Water-Soluble Chloride in Mortar and Concrete | Free chloride content analysis |
| ASTM C928 | Standard Specification for Packaged, Dry, Rapid-Hardening Cementitious Materials for Concrete Repairs | Repair mortar quality requirements |
| ASTM D4580 | Standard Practice for Measuring Delamination in Concrete Bridge Decks | Chain dragging and hammer sounding |
| ASTM A775/A775M | Standard Specification for Epoxy-Coated Steel Reinforcing Bars | Epoxy coating quality requirements |
| ACI 222R | Protection of Metals in Concrete Against Corrosion | Comprehensive guidance on corrosion science, detection, and mitigation |
| ACI 546R | Guide to Concrete Repair | Complete concrete repair methodology |
| ACI 318-19 | Building Code Requirements for Structural Concrete | Design provisions including corrosion exposure classes C0-C3 |
| EN 1504-9 | Products and Systems for Protection and Repair of Concrete Structures — Part 9 | European repair principles and methods |
| RILEM TC 154-EMC | Electrochemical Techniques for Measuring Metallic Corrosion | Standardized test methods for field corrosion assessment |
| NACE SP0290 | Cathodic Protection of Reinforcing Steel in Atmospherically Exposed Concrete Structures | CP design criteria and performance monitoring |
| BS EN 206 | Concrete — Specification, Performance, Production and Conformity | Chloride classes and exposure classes for concrete |
TarmacView provides AI-powered visual inspection and defect classification for reinforced concrete structures. Detect corrosion staining, cracking, and spalling with automated surface analysis. Streamline your condition assessment workflow.
Cathodic protection is an electrochemical corrosion mitigation technique that prevents reinforcement corrosion in concrete structures by making the steel the ca...
Corrosion protection encompasses all strategies, materials, and engineering practices used to prevent or control the deterioration of metals caused by environme...
Chloride attack is the penetration of chloride ions from deicing salts, marine environments, or contaminated materials into concrete, destroying the passive oxi...