Corrosion rate measures the actual rate of reinforcement cross-section loss (µm/year or µA/cm²) using electrochemical techniques — linear polarization resistance (LPR), Tafel extrapolation, or galvanostatic pulse — providing quantitative data for remaining service life prediction. Covers measurement principles, equipment, interpretation, and integration with half-cell and resistivity surveys.
Corrosion Rate Measurement in Reinforced Concrete
Definition and Units
Corrosion rate measurement is a quantitative electrochemical technique used to determine the speed at which steel reinforcement corrodes within concrete structures. Unlike qualitative methods that indicate corrosion probability, such as half-cell potential mapping per ASTM C876, corrosion rate measurement provides direct numerical data on the actual material loss rate of the embedded steel. This makes it an essential tool for structural health assessment, remaining service life prediction, and repair prioritization.
The corrosion rate is expressed through three interrelated units. Corrosion current density (icorr) is the most fundamental electrochemical quantity, measured in microamperes per square centimeter (µA/cm²). This represents the electrical current flowing per unit area of the reinforcing steel surface as a result of the electrochemical corrosion reactions. The conversion to physical section loss follows from Faraday’s Law of Electrochemical Equivalence, which states that the mass of metal lost is directly proportional to the electrical charge transferred. For carbon steel reinforcement, the commonly used conversion factor is that 1 µA/cm² corresponds to a cross-section loss rate of approximately 11.6 µm/year (0.0116 mm/year). In countries using imperial units, corrosion rates are also reported in mils per year (mpy), where 1 mil equals 0.001 inches. The conversion is: 1 µA/cm² ≈ 0.46 mpy for steel.
The RILEM TC 154-EMC recommendation formally defines corrosion rate (Vcorr) as the volumetric loss of metal per unit area per unit time, expressed in mm/year, derived from the corrosion current through the equation: Vcorr (mm/year) = 0.0116 × icorr (µA/cm²). This relationship assumes uniform corrosion across the measured steel surface, which is a critical distinction when interpreting results from chloride-contaminated structures where pitting corrosion dominates.
Linear Polarization Resistance (LPR) Principle
The Linear Polarization Resistance technique is the most widely used and scientifically validated method for measuring corrosion rate of reinforcement in concrete. First introduced in 1957 by Milton Stern and A. L. Geary, the method is based on the observation that the relationship between applied potential and resulting current is approximately linear for small potential shifts (typically ±10 to ±30 mV) around the steel’s free corrosion potential (Ecorr). The slope of this linear region, ∆E/∆I, is defined as the polarization resistance (Rp).
The fundamental relationship is governed by the Stern-Geary equation:
icorr = B / Rp
where icorr is the corrosion current density in µA/cm², Rp is the polarization resistance in Ω·cm², and B is the Stern-Geary constant in volts. The constant B is derived from the anodic and cathodic Tafel slopes (βa and βc) through:
B = (βa × βc) / (2.303 × (βa + βc))
For steel reinforcement in concrete, extensive calibration studies against gravimetric mass loss have established that a B value of 26 mV is appropriate for actively corroding steel, while 52 mV is used for passive steel. The RILEM TC 154-EMC recommendation specifies B = 26 mV as the default value for on-site measurements, with the note that results should be interpreted with caution and that reporting the assumed B value is mandatory.
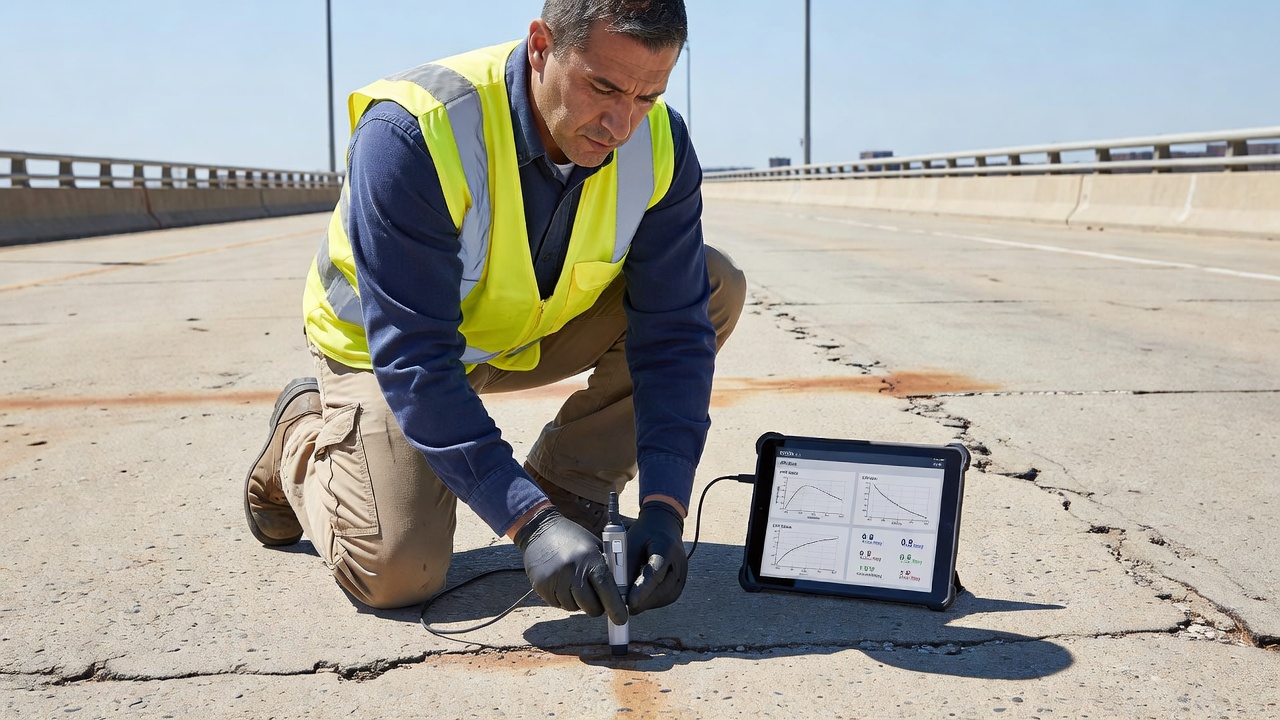
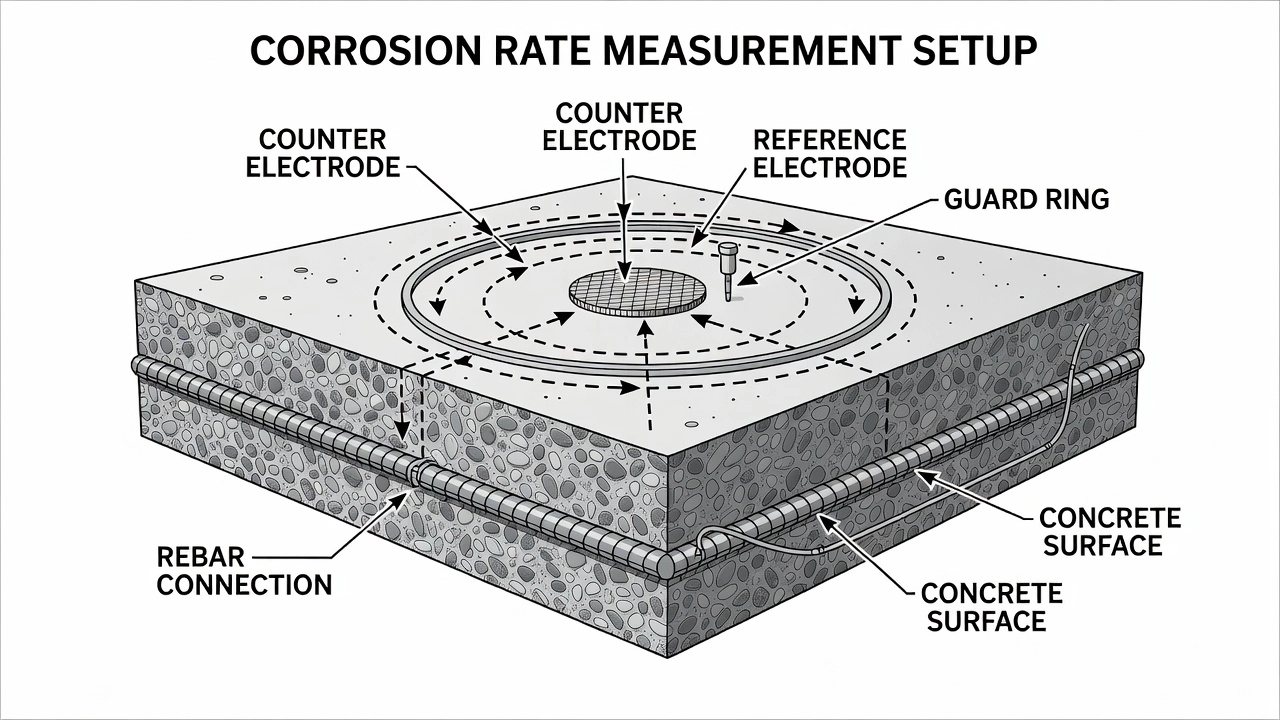
The LPR measurement procedure involves three electrodes: the reinforcing steel acts as the working electrode (WE), a counter electrode (CE) placed on the concrete surface applies the polarization signal, and a reference electrode (RE) — typically copper/copper sulfate (CSE) or silver/silver chloride — measures the potential response. The steel is polarized by a small potential step or sweep, and the resulting current is recorded. Key parameters that affect measurement quality include the polarization range (typically ±10–20 mV from Ecorr), the sweep rate (2.5–10 mV/min in potentiodynamic mode), and the waiting time (15–60 seconds in potentiostatic mode, depending on whether the steel is active or passive).
Equipment and Instrumentation
iCOR (Giatec Scientific)
The iCOR is the most advanced wireless non-destructive corrosion measurement device, distinguished by its patented CEPRA (Connectionless Electrochemical Pulse Response Analysis) technology that eliminates the need for direct electrical connection to the reinforcing steel. This represents a significant advancement over traditional instruments that require localized grinding through the concrete cover to expose the rebar. The iCOR simultaneously measures corrosion potential, corrosion rate, and in-situ electrical resistivity in a single 3–30 second measurement. It received the NACE Corrosion Innovation Award in 2019. The device operates wirelessly via Bluetooth to a tablet running an Android application that generates real-time contour maps of corrosion activity. Technical specifications include a corrosion rate range of 0–500 µm/year, corrosion potential range of -800 to +200 mV (CSE), and resistivity range of 0–10,000 Ω·m.
Gecor (James Instruments)
The Gecor system is a well-established LPR instrument that uses a guard ring electrode to confine the polarization current to a known, well-defined area of reinforcement. The guard ring surrounds the central counter electrode and is held at the same potential, forcing the current to flow vertically into the steel directly beneath the central electrode rather than spreading laterally along the bar. This confinement is essential for accurate calculation of the polarized steel area, which directly affects the corrosion rate computation. The Gecor-8 model can perform multiple measurements automatically, scanning a grid and producing corrosion rate maps. It requires a direct electrical connection to the rebar through a drilled access hole.
GalvaPulse (Germann Instruments)
The GalvaPulse operates on the galvanostatic pulse method, a transient polarization technique that applies a short-duration constant current pulse (typically 5–400 µA for up to 10 seconds) and records the resulting potential transient response. The method is significantly faster than conventional LPR — measurements take 5–10 seconds versus 2–4 minutes for potentiostatic LPR. The potential transient is analyzed using a linearization method or exponential curve fitting to extract polarization resistance (Rp), double-layer capacitance (Cdl), and ohmic resistance (RΩ). The method has been validated through long-term monitoring studies such as the 6-year campaign on a Danish highway bridge exposed to de-icing salts, where corrosion rates increased from below 5 µm/year (passive) to over 60 µm/year (active corrosion) across multiple measurement locations.
Comparison of Corrosion Rate Equipment
Parameter
iCOR (Giatec)
Gecor (James Instruments)
GalvaPulse (Germann)
Method
CEPRA (proprietary)
LPR
Galvanostatic pulse
Rebar Connection
Not required
Required
Required
Guard Ring
No (multi-electrode)
Yes
Yes
Time
3–30 s
2–4 min
5–10 s
Key Advantage
Non-invasive
Confirmed polarized area
Rapid measurement
Measurement Procedure
The measurement procedure for corrosion rate testing follows a strict protocol to ensure reliable and reproducible results. According to RILEM TC 154-EMC, the procedure consists of several critical steps:
Step 1 — Site Preparation and Rebar Location. The reinforcement layout is first identified using a cover meter (electromagnetic rebar locator). A minimum of 3–5 measurement locations per structural element is recommended, with closer grid spacing (0.5 m) in areas of suspected corrosion activity. The concrete surface must be clean, dry, and free of surface treatments that could affect electrical contact.
Step 2 — Electrical Connection. For instruments requiring rebar connection (Gecor, GalvaPulse), the cover concrete is locally ground to expose the reinforcing bar. A connection is established using a self-tapping screw or magnetic clamp. Electrical continuity between multiple exposed bars must be verified using a multimeter (resistance below 1 Ω indicates continuity). For the iCOR, this step is eliminated entirely.
Step 3 — Electrode Placement. The counter electrode and reference electrode are placed on the concrete surface. Good electrolytic contact is achieved using a wet sponge or conductive gel. The reference electrode is typically positioned in the center of the counter electrode to minimize errors from potential gradients. The guard ring (if present) is activated simultaneously to confine the polarization current.
Step 4 — IR Drop Compensation. Concrete has relatively high electrical resistivity (typically 100–1000 Ω·m), which introduces an ohmic (IR) voltage drop that distorts the polarization measurement. Modern potentiostats apply automatic IR compensation through one of two methods: current interruption (rapidly switching off the current and measuring the instantaneous potential change, which represents the IR component) or positive feedback (electronically compensating for the estimated resistance). Without IR compensation, the measured Rp includes both the true polarization resistance and the electrolyte resistance, leading to underestimation of the corrosion rate.
Step 5 — Polarization Measurement. A potential shift of ±10–20 mV from Ecorr is applied (anodic direction is typical). The current response is recorded until a steady state is reached. For corroding steel, stabilization occurs within 15–30 seconds; for passive steel, 30–60 seconds may be required. The polarization resistance is calculated as Rp = ∆E/∆I, multiplied by the estimated polarized steel area.
Step 6 — Data Recording and Quality Control. All measurements must include: date and time, concrete temperature, ambient relative humidity, concrete cover depth, observed cracking or spalling, Ecorr values, Rp values, calculated icorr and Vcorr, and any deviations from standard procedure. Duplicate measurements at selected locations should not vary by more than a factor of 4 under comparable conditions.
Corrosion Rate and Section Loss
The relationship between corrosion rate and actual structural damage is governed by Faraday’s Law, which relates the mass of metal lost to the electrical charge passed through the corrosion cell. For iron corroding to ferrous ions (Fe → Fe²⁺ + 2e⁻), the equivalent mass loss per unit charge is 2.894 × 10⁻⁴ g/C. Using the density of steel (7.85 g/cm³) and converting to penetration depth, the relationship is:
Section Loss (mm/year) = 0.0116 × icorr (µA/cm²)
This means a corrosion current density of 1 µA/cm² causes the steel cross-section to be reduced at a rate of 11.6 µm per year. Over a 50-year period, this would represent a total section loss of 0.58 mm — approximately 8% of a typical #5 (16 mm) reinforcing bar diameter. Table 1 in the RILEM technical literature shows that section loss of 10–50 µm/year is associated with moderate corrosion, while rates above 50 µm/year indicate high corrosion activity requiring intervention.
The conversion assumes uniform corrosion across the entire polarized steel surface. In reality, chloride-induced corrosion produces localized pitting where the actual penetration rate at the pit bottom can be 4–10 times the average rate. RILEM TC 154-EMC introduces the concept of a pitting factor (α), where the maximum pit depth (Ppit) relates to the average penetration (Px) through Ppit = α × Px. Values of α from 4 to 10 have been documented for chloride-contaminated concrete, meaning that a measured average icorr of 1 µA/cm² (11.6 µm/year) could produce local pit depths of 46–116 µm/year.
Corrosion Rate Classification
The RILEM TC 154-EMC provides a widely accepted classification system for interpreting corrosion current density values in reinforced concrete. The classification correlates icorr ranges with expected damage progression over time and is based on extensive laboratory calibration and field validation studies.
Corrosion Level
icorr (µA/cm²)
Vcorr (µm/year)
Expected Damage
Negligible
< 0.1
< 1.2
No corrosion damage expected. Steel remains passive.
Low
0.1 – 0.5
1.2 – 6
Corrosion damage possible in 10–15 years.
Moderate
0.5 – 1.0
6 – 12
Corrosion damage possible in 2–10 years.
High
> 1.0
> 12
Corrosion damage expected in 2–5 years.
These thresholds are not absolute but provide engineering guidance. The negligible threshold of 0.1 µA/cm² is particularly important as it represents the approximate boundary between passive and active steel. Values below 0.1 µA/cm² indicate that the passive film remains intact. The 0.5 µA/cm² threshold (6 µm/year) is often used to define the transition from acceptable to concerning corrosion activity in service life models. Values above 1.0 µA/cm² (12 µm/year) typically require intervention planning.
Corrosion rate must be interpreted in context with other condition data. A structure with icorr of 2 µA/cm² but low chlorides and carbonation may have a different prognosis than one with the same icorr and high chloride content. Temperature significantly affects rates — a commonly used correction factor doubles the corrosion rate for every 10°C increase in temperature. Moisture content also plays a dominant role: concrete at 95% relative humidity can have corrosion rates 5–10 times higher than the same concrete at 50% RH.
Corrosion Rate and Remaining Service Life
The corrosion rate is the single most important input parameter for quantitative service life prediction of corrosion-affected reinforced concrete structures. The Tuutti model, first proposed by K. Tuutti in 1982, divides the service life of a concrete structure into two phases: the initiation phase (time for chlorides to reach the steel or carbonation to depassivate the steel) and the propagation phase (time from depassivation to unacceptable damage, governed by the corrosion rate). Corrosion rate measurements directly quantify the propagation phase kinetics.
The time to corrosion-induced cracking (tcr) can be estimated using:
tcr = tinit + (δcrit / Vcorr)
where tinit is the initiation time (years), δcrit is the critical depth of corrosion product accumulation needed to generate tensile cracking (typically 0.05–0.1 mm for normal cover), and Vcorr is the measured corrosion rate (mm/year). For example, if Vcorr = 0.05 mm/year and δcrit = 0.1 mm, then the time from corrosion initiation to cracking is approximately 2 years. If Vcorr = 0.01 mm/year, the same damage would take 10 years to develop.
More sophisticated service life models (such as Life-52, STADIUM, and DuraCrete) incorporate corrosion rate data along with concrete resistivity, chloride diffusion coefficients, cover depth, and environmental exposure conditions to produce probabilistic service life estimates. The corrosion rate values are entered as time-dependent variables rather than constants, recognizing that corrosion rates vary seasonally and as corrosion products accumulate on the steel surface.
It is critical to note that corrosion rate measured on-site is an instantaneous snapshot of the steel behavior at the time of testing. For reliable service life predictions, corrosion rate measurements should be repeated across different seasons to capture the annual variation. A single measurement in winter may give rates 5–10 times lower than summer measurements at the same location. The RILEM recommendation emphasizes that comparable environmental conditions should produce results within a factor of 4.
Corrosion Rate Mapping
Corrosion rate mapping is the spatial representation of corrosion activity across a structural element, created by collecting measurements on a regular grid (typically 0.5 m × 0.5 m or 1.0 m × 1.0 m spacing) and interpolating the results using contouring software. The resulting isocorrosion maps show the distribution of corrosion rates, enabling identification of hot spots requiring targeted intervention.
The technique has been used successfully on bridge pillars, bridge decks, parking garage slabs, marine structures, and tunnel linings. A study on a Danish highway bridge pillar measured corrosion rates at a grid of 56 points (8 columns × 7 rows) over a 6-year period using the galvanostatic pulse method. The contour maps clearly showed the evolution from uniform passive condition in 1994 (all points below 0.2 µA/cm²) to multiple active corrosion zones in 2000 (peaks exceeding 5.5 µA/cm² or 64 µm/year), demonstrating the method’s sensitivity to temporal changes in corrosion activity.
Corrosion rate mapping provides several advantages over point measurements: it visualizes the spatial extent of corrosion, enables quantitative comparison between different structural elements, supports statistical analysis (percentile values, spatial correlation), and provides the data foundation for reliability-based assessment of remaining service life. The contour maps can be overlaid on structural drawings and combined with cover depth mapping, chloride content contours, and half-cell potential maps for a comprehensive condition assessment.
Integration with Half-Cell Potential and Resistivity
Corrosion rate measurement is most powerful when integrated with complementary electrochemical techniques. Half-cell potential mapping (per ASTM C876) measures the electrochemical potential of the reinforcing steel relative to a reference electrode, typically a copper/copper sulfate half-cell (CSE). Potential values more negative than -350 mV CSE indicate a greater than 90% probability of active corrosion, while values more positive than -200 mV CSE indicate greater than 90% probability of no corrosion. However, this method provides only qualitative information — it indicates likelihood, not rate. A steep potential gradient (difference > 150 mV over a short distance) is often more reliable than absolute values for identifying anodic zones.
Concrete resistivity measurement (using the Wenner four-probe method or embedded sensors) quantifies the ability of the concrete to conduct electrical current. Resistivity values below 100 Ω·m are associated with high corrosion risk (highly conductive concrete), while values above 1000 Ω·m indicate low corrosion risk (concrete is too resistive to support significant electrochemical activity). Resistivity acts as a modifying factor for corrosion rate — even if the steel is depassivated (negative half-cell potentials), corrosion will proceed slowly if the concrete resistivity is high because ionic current flow between anodes and cathodes is restricted.
The three parameters — half-cell potential, corrosion rate, and resistivity — provide a three-dimensional assessment of corrosion condition: half-cell potential indicates thermodynamic probability, corrosion rate quantifies kinetic severity, and resistivity explains the controlling mechanism. The combination enables engineers to distinguish between: (a) depassivated steel with slow corrosion (high resistivity environment), (b) passive steel in aggressive environment (low resistivity but no chloride contamination), and (c) active corrosion with significant section loss (negative potentials, high icorr, low resistivity). This integrated approach is specified in RILEM TC 154-EMC as the recommended protocol for comprehensive field evaluation.
Airport Concrete Structures
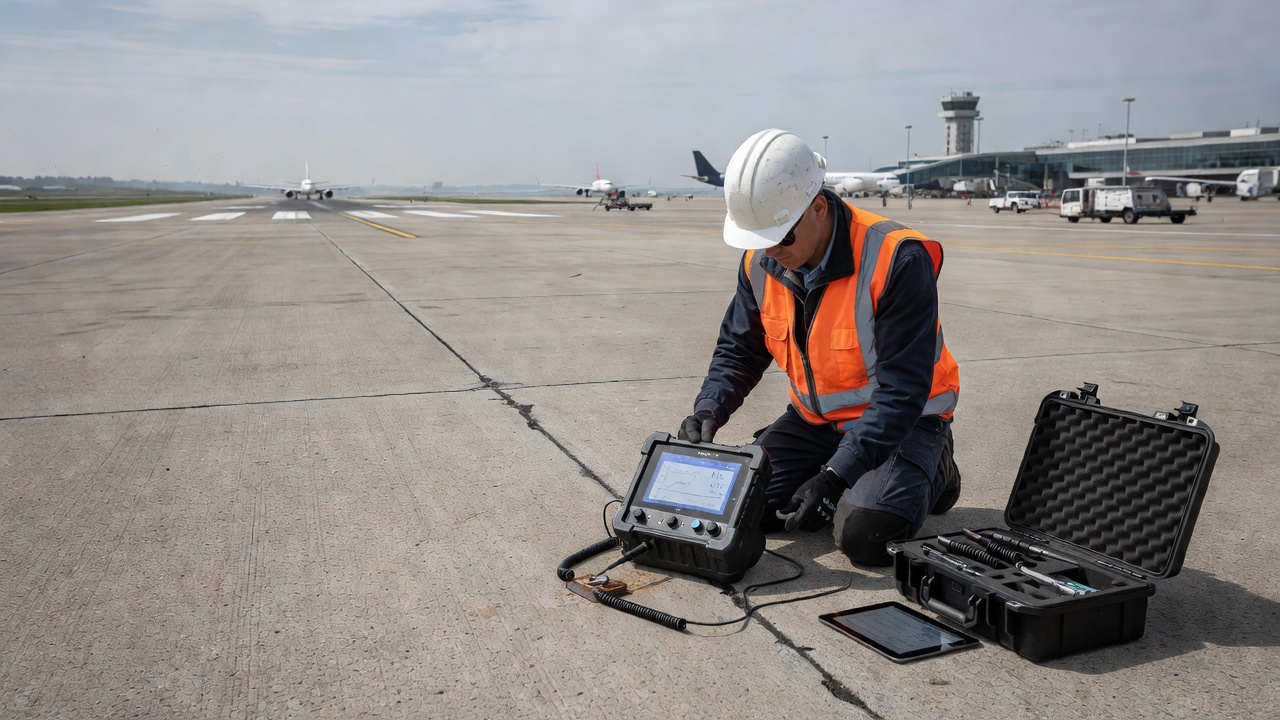
Airport concrete pavements present unique challenges for corrosion management. Jointed reinforced concrete pavement (JRCP) and continuously reinforced concrete pavement (CRCP) used in runways, taxiways, and aprons contain longitudinal and transverse steel reinforcement that can corrode when exposed to deicing chemicals. The FAA Advisory Circular AC 150/5370-11B, “Use of Nondestructive Testing in the Evaluation of Airport Pavements,” provides guidance on NDT methods, though it focuses primarily on deflection-based structural evaluation rather than electrochemical methods.
Airport pavements are particularly vulnerable to corrosion due to: heavy application of acetate- and chloride-based deicing chemicals that penetrate the concrete through joints and cracks, frequent freeze-thaw cycles that accelerate deterioration, aircraft fuel and hydraulic fluid spills that can attack the concrete matrix, and the high structural demand of aircraft loads that amplifies the consequences of reinforcement section loss. The FAA requires pavements supporting aircraft with gross weights above 12,500 lb to have a minimum structural life of 20 years; undetected active corrosion can substantially shorten this life.
Corrosion rate measurement on airport pavements follows the same electrochemical principles as other structures but with specific adaptations. Measurement grids must be designed to avoid joints (where guard ring coupling may be lost) and to capture the typical corrosion distribution pattern near construction and contraction joints. The use of non-invasive devices like the iCOR is particularly advantageous on airside pavements because it avoids the need to drill holes for rebar connection — a significant operational advantage when minimizing foreign object debris (FOD) risk is critical. Measurements should be scheduled during periods of moderate temperature and moisture (typically spring or fall) to obtain representative corrosion rate values.
Equipment Calibration and Verification
Corrosion rate instruments must be regularly calibrated to maintain measurement accuracy. Calibration can be performed using standard resistors of known value to verify the current measurement accuracy, and using known RC circuits (a resistor and capacitor in parallel) to simulate the electrochemical response of a corroding reinforcement. The potentiostat performance should be verified annually against laboratory standards, and field verification should be performed before and after each measurement campaign using a reference cell. The iCOR system, like all precision electrochemical instruments, includes factory calibration procedures traceable to national standards.
The polarized steel area is the largest source of uncertainty in corrosion rate calculation. For instruments using a guard ring, the confined area is calculated from the central counter electrode dimensions and is typically 50–80 cm². For the iCOR, the multi-electrode array and CEPRA algorithm determine the area through signal analysis rather than physical confinement. The user must verify the manufacturer’s specified area and ensure that the test configuration is appropriate for the actual reinforcement spacing and cover depth being tested.
Interpretation and Reporting
Interpretation of corrosion rate data requires an understanding of the electrochemical principles, the limitations of the measurement method, and the specific condition of the structure being tested. The RILEM TC 154-EMC recommendations emphasize that corrosion rate measurements cannot substitute for direct visual inspection of the steel when assessing actual cross-section loss. They provide instantaneous corrosion activity data that must be combined with chloride profiles, carbonation depth, concrete cover measurements, and environmental exposure data for complete condition assessment.
Standard reporting formats should include: date and temperature, instrument type and calibration status, measurement grid and coordinates, Ecorr values, Rp values, calculated icorr and Vcorr, the assumed B value and area, concrete resistivity, cover depth, and any visual observations. Results are typically presented as tables of values for each measurement point, corrosion rate contour maps showing spatial distribution, and statistical summaries (mean, median, 90th percentile) for each structural element or zone.
Application in Structural Health Monitoring Systems
Corrosion rate sensors are increasingly integrated into permanent structural health monitoring (SHM) systems for critical infrastructure. Embedded sensors (such as the post-mounted monitoring system used on the Danish highway bridge study) consist of carbon steel electrodes and titanium reference electrodes installed in the concrete cover at the depth of the reinforcement. These sensors continuously monitor the galvanic current between the carbon steel (which corrodes when chloride levels reach the threshold) and the passive reinforcement.
Long-term monitoring data from the Danish bridge study showed that corrosion rates in the passive state were below 2 µm/year, but after 6 years of deicing salt exposure, rates at some locations exceeded 60 µm/year. The data demonstrated the value of repeated measurements over time for detecting the transition from passive to active corrosion — a transition that would be missed by any single measurement campaign. The monitored data also showed strong seasonal correlations, with peak corrosion currents occurring during periods of heavy rainfall when concrete resistivity dropped below 50 Ω·m.
Modern SHM systems for airport pavements, bridge decks, and parking garages can transmit corrosion rate data wirelessly to cloud-based platforms, enabling real-time condition assessment and early warning of corrosion activation. The integration of corrosion rate data with environmental sensors (temperature, relative humidity, chloride concentration) provides the comprehensive dataset needed for reliability-based service life predictions and optimized maintenance planning.
Limitations and Sources of Error
Corrosion rate measurement, while powerful, has inherent limitations that must be recognized. The most significant limitations include: (1) the measurement represents an instantaneous rate at the time of testing, which may not reflect the long-term average due to seasonal and climatic variations; (2) the method gives an average corrosion rate over the polarized steel area and cannot distinguish between general and pitting corrosion without additional assumptions; (3) the accuracy of the conversion from measured current to section loss depends on the correct estimation of the polarized steel area, which is affected by rebar geometry, concrete cover, and resistivity; (4) the Stern-Geary constant B must be assumed, and an incorrect assumption (using 52 mV instead of 26 mV for active steel) doubles the reported corrosion rate; (5) measurements on epoxy-coated reinforcing steel require special interpretation because the polarized steel area is much smaller than the total bar area; and (6) IR drop compensation must be properly applied — an uncompensated measurement can underestimate the corrosion rate by 50–90% in high-resistivity concrete.
The RILEM TC 154-EMC recommendation specifies the following criteria for reliable measurements: the concrete temperature must be above 0°C, the concrete surface must not be extremely dry (resistivity above 1000 Ω·m makes measurement difficult), the reinforcement must be electrically continuous to the test point, and the cover depth should generally not exceed 100 mm. Pre-wetting of the concrete surface is always necessary to ensure good electrolytic contact between the electrodes and the concrete.
Conclusions
Corrosion rate measurement is an indispensable tool for the quantitative assessment of reinforced concrete structures affected by reinforcement corrosion. The technique provides essential data for condition assessment, service life prediction, and repair prioritization that cannot be obtained from any other non-destructive method. The choice between LPR, galvanostatic pulse, and CEPRA methods depends on the specific requirements of each project, including the need for rebar connection, measurement speed, and environmental conditions.
The integration of corrosion rate data with half-cell potentials and concrete resistivity measurements provides a comprehensive three-dimensional picture of corrosion behavior. This multi-parameter approach, specified in RILEM TC 154-EMC, remains the gold standard for field evaluation of reinforced concrete structures. As sensor technology continues to advance with wireless instrumentation and cloud-based monitoring platforms, corrosion rate measurement will play an increasingly important role in structural health management systems for bridges, airports, marine structures, and buildings worldwide.
Frequently Asked Questions
Half-cell potential measurement (per ASTM C876) provides qualitative information about the probability of corrosion activity by measuring the electrochemical potential of the reinforcement. It indicates whether corrosion is likely occurring but not how fast. Corrosion rate measurement (per RILEM TC 154-EMC and ASTM G59) provides quantitative data on how quickly the steel is losing cross-section, expressed in µA/cm² or µm/year. The two methods are complementary: half-cell potential identifies where corrosion may be active, and corrosion rate measures its severity.
According to RILEM TC 154-EMC recommendations, the corrosion rate classifications are: negligible (icorr < 0.1 µA/cm², < 1.2 µm/year), low (0.1–0.5 µA/cm², 1.2–6 µm/year), moderate (0.5–1.0 µA/cm², 6–12 µm/year), and high (>1.0 µA/cm², >12 µm/year). Corrosion current density below 0.1 µA/cm² typically indicates passive steel. Values above 0.5 µA/cm² suggest corrosion damage may occur within 10–15 years, while values above 1.0 µA/cm² may cause damage within 2–5 years if conditions remain constant.
Traditional LPR equipment requires a direct electrical connection to the reinforcing steel, which means localized exposure of the rebar by grinding through the concrete cover. However, modern devices like the iCOR by Giatec use patented CEPRA technology that eliminates the need for a rebar connection through a multi-electrode array and advanced signal processing. The Gecor system uses a guard ring electrode to confine the current to a known area but still requires a rebar connection. The GalvaPulse system also requires rebar connection but uses a faster galvanostatic pulse method.
Concrete resistivity influences the ohmic drop (IR drop) component of the polarization resistance measurement. High resistivity concrete (above 1000 Ω·m) can significantly distort corrosion rate readings if IR compensation is not applied. Modern corrosion rate instruments include automatic IR compensation using current interruption or positive feedback methods. Without proper IR compensation, the measured polarization resistance includes both the true corrosion resistance and the electrolyte resistance, leading to underestimation of the actual corrosion rate. This is why corrosion rate and resistivity measurements are typically conducted together.
The Stern-Geary constant B (in volts) relates polarization resistance to corrosion current density and is calculated from the anodic and cathodic Tafel slopes. For steel in concrete, extensive calibration against gravimetric weight loss measurements has established that a B value of 26 mV is appropriate for actively corroding steel, while 52 mV is used for passive steel. The choice of B significantly affects the calculated corrosion rate — using 52 mV instead of 26 mV doubles the reported rate. RILEM TC 154-EMC recommends B = 26 mV for on-site measurements of active corrosion.
Using Faraday's Law, the corrosion current density is converted to metal loss. For carbon steel, 1 µA/cm² corresponds to a section loss of approximately 11.6 µm/year (0.0116 mm/year). The conversion assumes uniform corrosion, which is a limitation since actual corrosion in concrete is often localized (pitting). The formula is: Vcorr (mm/year) = 0.0116 × icorr (µA/cm²). For localized corrosion, the actual pit penetration rate can be 4–10 times higher than the uniform rate, requiring a pitting factor (α) to estimate maximum pit depth.
Temperature, humidity, and concrete moisture content significantly influence corrosion rate readings. Corrosion rates are generally higher in warmer, more humid conditions and lower in cold or dry conditions. The RILEM TC 154-EMC recommends that measurements be taken under comparable environmental conditions and that 90% of repeated measurements should not differ more than a factor of 4 from the minimum value recorded. Seasonal variations can produce order-of-magnitude differences. For service life predictions, multiple measurement campaigns over different seasons are recommended to capture the full range of corrosion activity.
Yes, corrosion rate testing is directly applicable to airport concrete pavements. Airport pavements are exposed to deicing chemicals (chlorides), jet fuel spills, and thermal cycling, which can initiate reinforcement corrosion in jointed reinforced concrete pavement. FAA Advisory Circular 150/5370-11B on NDT in airport pavement evaluation covers electrochemical methods. Corrosion rate mapping can identify areas of active corrosion in pavement slabs before visible distress (cracking, spalling) occurs, enabling targeted repairs and minimizing runway downtime. The non-destructive nature of modern equipment allows testing without disrupting airport operations.
The accuracy of on-site corrosion rate measurement depends on several factors: correct estimation of the polarized steel area, proper IR drop compensation, appropriate polarization time, and accurate selection of the Stern-Geary constant B. Laboratory calibration against gravimetric weight loss has shown that LPR measurements can achieve accuracy within ±20% under controlled conditions. On-site, the variability is higher due to environmental factors and the complexity of the reinforcing network. According to RILEM TC 154-EMC, repeatability is considered acceptable when 90% of measurements in comparable conditions do not vary by more than a factor of 4 from the minimum value.
A guard ring is a secondary counter electrode surrounding the central counter electrode in corrosion rate probes. Its purpose is to confine the applied polarization current to a known, well-defined area of the reinforcing steel, preventing current from spreading laterally along the reinforcement. Without a guard ring, the polarized area is unknown and varies with concrete resistivity and rebar geometry, making accurate corrosion rate calculation impossible. The guard ring electrode is held at the same potential as the central counter electrode, forcing the current to flow primarily into the area directly beneath the central electrode.
The primary standards are: RILEM TC 154-EMC (Test methods for on-site corrosion rate measurement of steel reinforcement in concrete by means of the polarization resistance method), ASTM G59-97 (Standard Test Method for Conducting Potentiodynamic Polarization Resistance Measurements), ASTM C876 (Standard Test Method for Corrosion Potentials of Uncoated Reinforcing Steel in Concrete), and ASTM G102 (Standard Practice for Calculation of Corrosion Rates and Related Information from Electrochemical Measurements). For airport pavements, FAA AC 150/5370-11B provides guidance on NDT methods including electrochemical assessments.
Corrosion rate (Vcorr) is the velocity of metal loss, expressed in units of length per time (µm/year, mm/year, or mpy). Corrosion current (Icorr) is the total electrical current flowing between anodic and cathodic sites on the steel surface, expressed in microamperes (µA). Corrosion current density (icorr) normalizes the current to the exposed steel surface area (µA/cm²). The distinction is important: the measured current must be divided by the actual polarized steel area to obtain density, and then converted through Faraday's Law to obtain the penetration rate. The total corrosion current Icorr = icorr × A, where A is the polarized area.
Standard LPR and galvanostatic pulse measurements give an average corrosion rate over the polarized area, assuming uniform attack. They cannot directly distinguish between general and pitting corrosion. When corrosion is localized (as with chloride-induced pitting), the average icorr underestimates the actual local penetration rate. RILEM TC 154-EMC recommends using Icorr (total current, not density) to indicate non-uniform corrosion. A pitting factor α can be applied, where maximum pit depth = α × average penetration. Values of α from 4 to 10 have been reported for chloride-induced corrosion, meaning the local pit penetration rates can be 4–10 times the measured average rate.
Measurement duration varies by method. Traditional LPR requires 2–4 minutes per measurement for stabilization of the polarization response. The galvanostatic pulse method (GalvaPulse) takes 5–10 seconds per measurement, significantly faster than LPR. The iCOR device can perform measurements in 3–30 seconds. The choice of polarization time affects accuracy: longer polarization times generally yield more stable and accurate readings, particularly for passive steel where the response is slower. For comprehensive surveys, a grid spacing of 0.5–1.0 m is typical, meaning a 100-point survey takes 1–4 hours depending on the method.
Corrosion rate measurement is most reliable when the concrete cover is less than 100 mm (4 inches). Beyond this depth, the polarization current becomes increasingly attenuated, and the guard ring effectiveness decreases. However, the RILEM TC 154-EMC notes that depths greater than 1 meter have been successfully tested when the reinforcement bars are electrically isolated. For the typical bridge deck or building slab with 25–75 mm cover, the methods are generally reliable. Cover thickness must be recorded as part of the test documentation, and results should be interpreted with caution when cover exceeds 100 mm.
Assess Corrosion Risk in Your Structures
Corrosion rate testing provides the quantitative data needed for informed maintenance decisions and service life predictions. Our team specializes in electrochemical corrosion assessment using state-of-the-art equipment.
Corrosion of reinforcing steel is the electrochemical deterioration of rebar within concrete, driven by chloride ingress or carbonation destroying the protectiv...
Concrete electrical resistivity measures the material's resistance to ionic current flow, providing an indirect indication of corrosion risk — low resistivity c...
Chloride content testing determines the concentration of chloride ions at various depths in concrete, indicating corrosion risk to reinforcement. Total chloride...
30 min read
Concrete Testing
Corrosion
+3
Cookie Consent We use cookies to enhance your browsing experience and analyze our traffic. See our privacy policy.