Concrete Cover
Concrete cover is the minimum depth of concrete between the outer surface and the nearest reinforcing steel, providing corrosion protection through physical bar...
24 min read
Reinforcement
Construction
+3
A cover meter, also known as a pachometer or rebar locator, is an electromagnetic NDT device that detects the position, depth, and diameter of reinforcing steel in concrete. It operates on eddy current or magnetic reluctance principles to measure concrete cover depth, map rebar layout, and support corrosion assessment before coring, drilling, or structural evaluation.
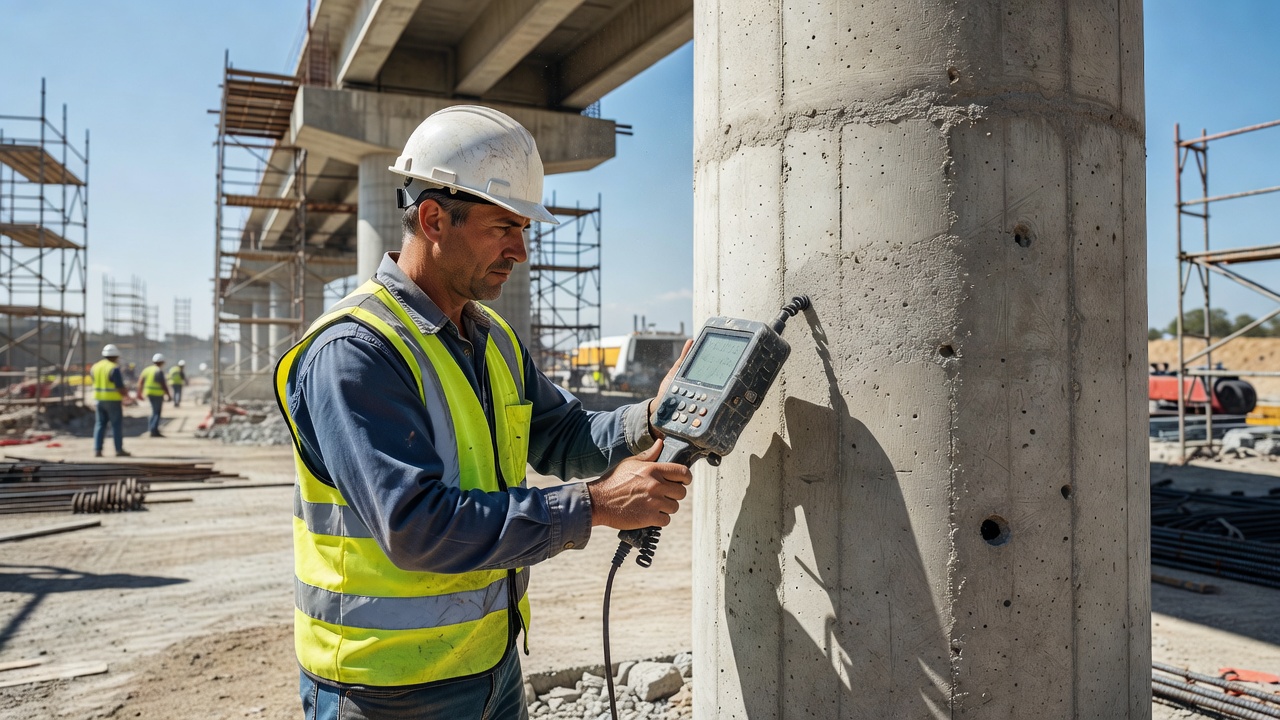
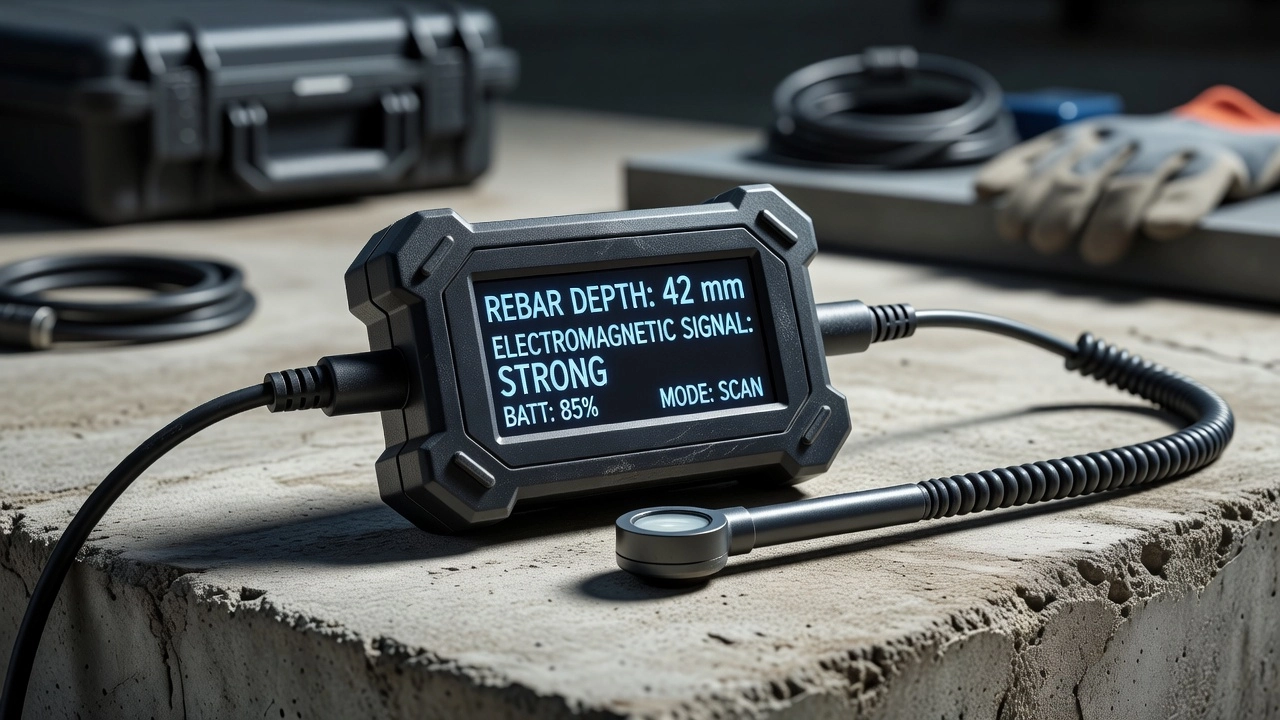
A cover meter — also referred to as a pachometer, rebar locator, or rebar detector — is a non-destructive testing (NDT) instrument designed to detect, locate, and characterize steel reinforcement embedded in concrete structures. The device measures the thickness of the concrete cover (the distance from the concrete surface to the nearest surface of the reinforcing bar), determines the spatial position and orientation of reinforcing bars, and estimates the bar diameter under favorable conditions. Cover meters operate on well-established electromagnetic principles and represent one of the most widely used NDT tools in civil engineering for reinforced concrete condition assessment.
The term “pachometer” derives from the Greek pachys (thick) and metron (measure), literally meaning “thickness measurer.” While “pachometer” is used interchangeably with “cover meter” in many regions, some practitioners reserve “pachometer” specifically for instruments measuring concrete cover over reinforcement, distinguishing them from general-purpose metal detectors. The first commercial cover meters appeared in the 1950s based on magnetic reluctance technology, followed by eddy current instruments in the following decades. Today’s digital instruments combine pulse-induction technology, advanced signal processing, and integrated data visualization to deliver real-time rebar mapping and cover assessment on concrete structures ranging from bridge decks to high-rise columns.
Primary applications include quality control verification of cover depth on new construction to ensure compliance with durability specifications and building codes, locating reinforcement before destructive operations such as coring, cutting, or drilling to prevent damage to structural steel and cutting hazards, mapping unknown reinforcement layouts in existing structures where design documentation is unavailable, supporting half-cell potential corrosion surveys by precisely locating bars for electrical connection, and assessing concrete cover for corrosion risk evaluation in aggressive environments such as marine structures, parking garages, and bridges exposed to de-icing salts.
The operating principle of a cover meter is rooted in electromagnetic induction, first described by Michael Faraday in 1831. An alternating current flowing through a coil within the instrument’s probe generates a primary magnetic field that propagates outward through the concrete. When this time-varying magnetic field encounters a conductive ferromagnetic object — such as a steel reinforcing bar — it induces circulating electrical currents, called eddy currents, within the bar according to Faraday’s law. These eddy currents flow in closed loops around the circumference of the bar and, in accordance with Lenz’s law, produce a secondary magnetic field that opposes the primary field.
The cover meter measures the change in impedance of the probe coil caused by the interaction between the primary and secondary magnetic fields. The magnitude of this impedance change depends on several factors:
Most modern cover meters employ pulse induction (PI) technology rather than continuous-wave electromagnetic induction. In a PI system, the probe coil transmits short, high-current pulses (typically lasting 10-100 microseconds) at a repetition rate of several hundred pulses per second. During the pulse, a strong magnetic field builds up. When the pulse ends, the field collapses, and the receiver circuit measures the decay of the secondary magnetic field induced by any eddy currents still circulating in nearby metal objects. The decay characteristic — specifically the time constant and amplitude of the decay curve — encodes information about the size, depth, and conductivity of the detected object.
The key advantage of pulse induction over continuous-wave systems is its ability to discriminate the signal from the transmitted pulse. Because the receiver measures the magnetic field after the transmitted pulse has ended, there is no interference from the primary field. This allows detection of metal at greater depths and with higher signal-to-noise ratios. Additionally, pulse induction is inherently less sensitive to ground effects and concrete variability than continuous-wave systems.
An older but still relevant operating principle is magnetic reluctance, used in early cover meters such as the “Covermeter” line. In a reluctance-based system, a permanent magnet or electromagnet creates a steady magnetic field. Ferrous reinforcement in the concrete distorts this field, and a Hall-effect sensor or magnetometer measures the resulting change in magnetic flux density. The change in reluctance (the magnetic equivalent of electrical resistance) is correlated to the proximity and size of the steel.
The NIST study by Carino (1992) compared magnetic reluctance and eddy current meters and found that while both technologies effectively locate rebar and measure cover depth, they differ in key aspects: reluctance meters show less sensitivity to bar diameter variation but greater sensitivity to bar spacing effects, while eddy current meters generally provide better resolution for distinguishing individual bars in congested reinforcement and superior performance for locating bar ends. Modern instruments have largely adopted eddy current or pulse induction technology due to their superior dynamic range and discrimination capabilities.
Cover meters range from simple handheld devices for spot-check measurements to sophisticated systems with multi-sensor arrays, integrated data logging, and wireless connectivity to tablet computers for real-time visualization.
| Device Category | Example Models | Key Capabilities | Typical Cover Range |
|---|---|---|---|
| Basic / Spot-check | Profometer PM8000 Lite, Elcometer 331 Model T | Rebar detection, single-point cover measurement, audio-visual indication | 0-80 mm |
| Advanced / Scanning | Profometer PM8000, Hilti Ferroscan PS300 | Grid scanning, line scanning, diameter estimation, data logging, Neighboring Rebar Correction | 0-100 mm |
| Expert / Imaging | Profometer PM8000 Pro | Area scanning, 2D/3D visualization, remote operation via tablet, corrosion potential integration | 0-120 mm |
| Corrosion Integration | Profometer PM8500 Corrosion Kit | Cover measurement + half-cell potential mapping, multi-electrode wheel probes | 0-100 mm |
Key components common to all cover meters include:
Cover meters offer several measurement modes depending on the inspection objective:
Spot-check mode — The operator places the probe at a single location and reads the cover depth directly. This is used for quick verification of cover at specific points, such as checking cover at beam mid-spans or column faces before drilling anchor bolt holes.
Line scanning mode — The operator moves the probe along a predefined line while the instrument continuously records cover readings. The device produces a profile showing cover variation along the scan line, allowing identification of individual bars as peaks in the signal response. The probe must be moved perpendicular to the target rebar direction, and the strongest signal occurs when the probe axis is parallel to the bar.
Grid scanning (area scanning) mode — The operator performs multiple parallel line scans at regular spacing to create a two-dimensional cover map of a structural element. The instrument interpolates between scan lines to produce contour plots, color-coded cover maps, and 3D representations of the reinforcement layout. Grid scanning is essential for comprehensive deck surveys, wall assessments, and slab investigations.
Rebar mapping mode — Dedicated to locating and documenting the full reinforcement layout. The operator scans in two orthogonal directions, and the instrument automatically identifies bar positions, spacing, and orientation. The resulting map shows the complete reinforcement grid with measured cover values at each bar intersection.
The fundamental measurement performed by a cover meter is the determination of concrete cover — the distance from the exposed concrete surface to the nearest surface of the embedded reinforcing steel. This parameter directly controls the durability of reinforced concrete structures because the cover provides the primary barrier against ingress of chlorides, carbon dioxide, moisture, and oxygen that initiate and propagate reinforcement corrosion.
The measurement process follows a systematic procedure prescribed by BS 1881-204:1988 and manufacturer recommendations:
Surface preparation: The concrete surface must be clean, dry, and free of debris, loose material, and surface moisture that could affect probe contact or signal propagation. Form oil residues, curing compounds, or surface coatings may need to be removed.
Calibration verification: Before each survey session, the operator verifies the instrument calibration against a calibration block with known bar diameter and cover depth. The reading must fall within the ±5% or ±2 mm tolerance specified by BS 1881-204. If not, the instrument must be recalibrated per the manufacturer’s instructions.
Bar location: The operator sweeps the probe across the concrete surface in a systematic pattern to locate the reinforcing bars. The maximum signal (peak reading) indicates the probe is directly above the bar. Most instruments provide both audio (varying pitch) and visual (bar graph, numeric readout) feedback.
Cover measurement: Once a bar is precisely located, the probe is held stationary at the peak signal position, and the cover depth reading is recorded. For maximum accuracy, the operator should take multiple readings (typically 3-5) at the same location and record the average.
Bar diameter input: Accurate cover measurement requires the correct bar diameter to be entered into the instrument. If the bar diameter is unknown, the operator must either use the spacer method (see section on diameter estimation) to determine it or accept reduced accuracy using an assumed diameter.
The relationship between signal amplitude (S) and cover depth (d) follows a characteristic inverse power law. The NIST study by Carino established that for eddy current cover meters, the relationship can be modeled as:
S = a × d⁻ⁿ
where a is a calibration constant depending on bar diameter and instrument sensitivity, and n is an exponent typically ranging from 1.5 to 3.0 depending on probe geometry. For a typical probe with a 50 mm coil diameter, n ≈ 2.5, meaning a 20% increase in cover reduces the signal by approximately 44%. The practical consequence of this steep signal decay is that the measurement sensitivity decreases rapidly with depth — an instrument that can resolve 1 mm cover variation at 20 mm depth may only resolve 5 mm at 80 mm depth.
The maximum cover depth that can be reliably measured depends on several factors: instrument design and probe power, bar diameter, bar spacing (closer spacing reduces maximum measurable depth), configuration of secondary reinforcement, and presence of adjacent steel elements (embedded plates, conduits, anchors). For standard probes, practical maximum measurable covers are:
The Barnes & Zheng (2008) study found that with 100 mm bar spacing and 24-28 mm diameter bars, a Proceq Profometer 5 could reliably measure covers up to 85-90 mm — exceeding the manufacturer’s stated maximum for low-range operation. However, measurement errors increased significantly when operating in high-range mode, with the study recommending that high-range settings only be used when low-range detection fails.
One of the more challenging capabilities of a cover meter is the estimation of reinforcing bar diameter. The fundamental difficulty arises because the signal amplitude depends on both cover depth and bar diameter — two unknowns that must be decoupled.
The standard technique for diameter estimation is the spacer method (also called lift-off method). The operator takes two cover readings at different distances from the concrete surface: one directly on the surface (cover reading C₁ with unknown bar diameter D₁), and a second reading with a non-conductive spacer of known thickness t placed between the probe and the concrete surface (resulting in cover reading C₂ with the same unknown bar diameter D₂, but at an effective cover of C₁ + t). Since the relationship between signal and cover depends on bar diameter, solving the two equations simultaneously yields both the true cover and the bar diameter.
Modern digital cover meters automate this process. The operator places the probe on the concrete surface, presses a button to take the first reading, then places a spacer (typically 10-20 mm thick, made of acrylic or polypropylene) under the probe and takes the second reading. The instrument’s microprocessor solves the two simultaneous calibration equations and displays both the estimated cover and bar diameter on the screen.
Factors affecting diameter estimation accuracy:
The Hoki (2011) thesis at Brigham Young University demonstrated that, for bridge deck surveys, if the operator inputs a bar size within one US standard size of the actual bar (e.g., inputting #5 when the bar is actually #4 or #6), the cover measurement error remains within 0.125 inches (3.2 mm). This tolerance means that even an educated guess of bar diameter can yield acceptable cover accuracy for many applications.
Beyond point measurements of cover depth, cover meters serve a critical function in rebar mapping — creating a comprehensive spatial representation of the reinforcement layout within a concrete element. This is essential for several scenarios: assessing structures with missing or unreliable design documentation, verifying as-built reinforcement against design specifications, locating reinforcement for structural capacity evaluation and load rating, and mapping rebar for corrosion assessment correlation with half-cell potential surveys and delamination surveys.
The mapping process typically follows a grid-based approach:
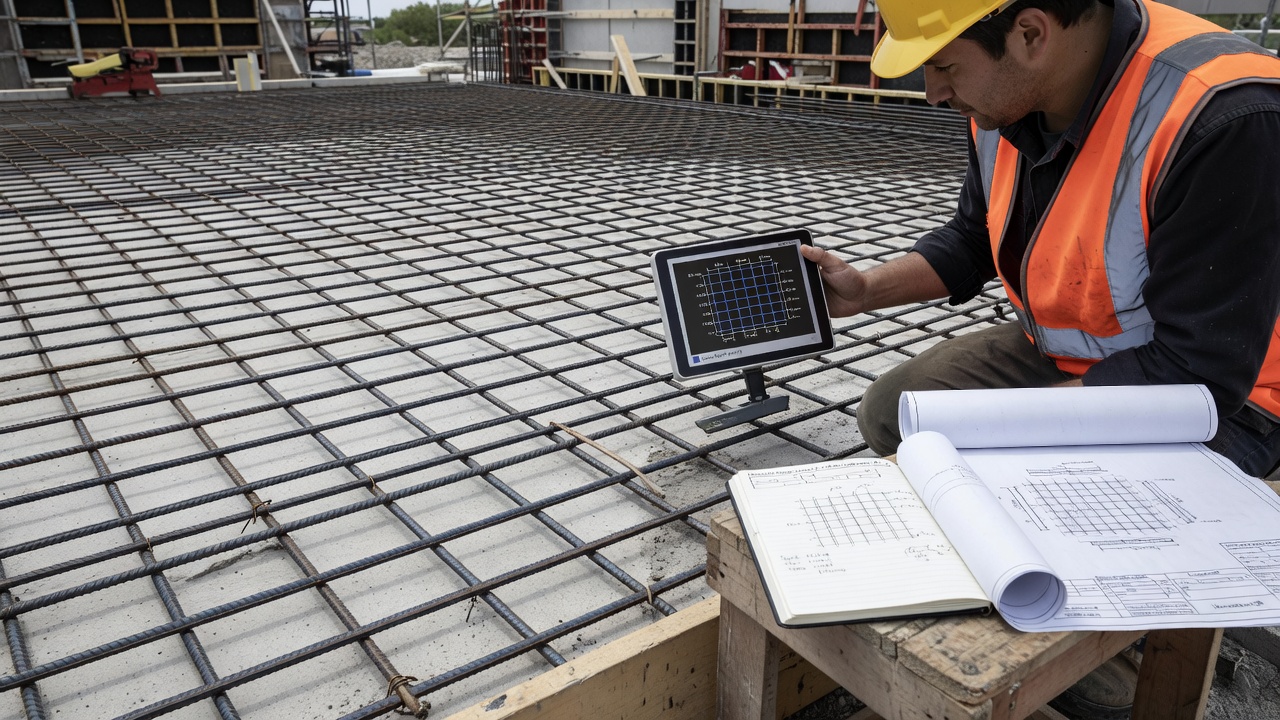
Modern cover meters with area scanning capability, such as the Profometer PM8000 Pro, use multi-sensor arrays and integrated odometry (wheel encoders on the scanning cart) to automate data collection. The operator pushes the scanning cart along the concrete surface, and the instrument continuously records probe position and cover readings, building a dense data set that software interpolates into high-resolution cover maps. This technology dramatically reduces inspection time for large-area surveys — a 50 m² bridge deck can be mapped in 1-2 hours compared to a full day using manual grid methods.
Cover meter accuracy is governed by a complex interplay of instrument factors, site conditions, reinforcement configuration, and operator procedure. The authoritative reference for accuracy expectations is BS 1881-204:1988, which specifies:
Bar diameter setting — The most significant operator-controllable factor affecting cover measurement accuracy. Barnes & Zheng demonstrated that setting an incorrect bar diameter can shift cover readings by 10-20% of the measured value. Specifically, setting a smaller bar diameter than actual causes the meter to underestimate the cover, while setting a larger diameter causes overestimation. For example, measuring #8 (25 mm) bars with the meter set to #3 (10 mm) can produce cover readings 15-25% below true cover. This has critical implications for durability assessment — an operator who underestimates cover may incorrectly judge a structure as having inadequate protection.
Adjacent parallel bars — When bars are spaced closer than approximately 100 mm (4 inches), the magnetic fields from adjacent bars overlap, causing the measured signal to be stronger than for an isolated bar at the same depth. This produces cover readings that are systematically lower than true cover. The Hoki study found that at bar spacings greater than 100 mm, the interference effect diminishes to within the practical importance threshold of 0.125 inches. For closer spacings, the error increases non-linearly.
Secondary (perpendicular) bars — Transverse bars beneath the target longitudinal bars create additional magnetic field interactions. Research shows that scanning directly above a secondary bar can introduce errors of 1-4% in cover readings, with the effect being more pronounced at greater cover depths. The effect is mitigated by modern probe designs that are most sensitive to bars parallel to the probe axis and least sensitive to perpendicular bars.
Probe range selection — Using the high-range setting on a universal probe when the low range could achieve detection introduces measurement errors. Barnes & Zheng found that high-range readings are systematically lower (by 5-15%) than low-range readings for the same bar at the same depth. Manufacturers explicitly recommend that high range should only be used when low range cannot detect the bar.
Concrete properties — The concrete matrix generally does not affect electromagnetic signal propagation at cover meter frequencies. However, certain exceptions exist: aggregates containing magnetite (common in heavy-weight concrete for radiation shielding), steel fiber reinforcement, carbon fiber reinforcement, and high moisture content in immature concrete can all introduce minor signal perturbations.
Steel variability — Variations in steel permeability due to differences in chemical composition, cold-working history (e.g., threaded bars vs. smooth bars), and corrosion state can affect signal strength. Ribbed bars produce a slightly different signal response than smooth bars, though modern instruments are typically calibrated against standard ribbed reinforcing bars.
Surface roughness — Irregular concrete surfaces can cause inconsistent probe-to-surface contact, introducing air gaps that effectively increase the probe-to-bar distance. This produces erroneously high cover readings. For rough surfaces, using a spacer or ensuring firm probe contact is essential.
Cover meters play an indispensable supporting role in corrosion assessment of reinforced concrete structures. The most widely used electrochemical technique for evaluating corrosion risk is the half-cell potential mapping method, standardized in ASTM C876. This technique measures the electrical potential difference between a reference electrode (typically copper/copper sulfate, Cu/CuSO₄) placed on the concrete surface and the embedded reinforcing steel. Potential values more negative than -350 mV (vs. CSE) indicate a greater than 90% probability of active corrosion.
For half-cell measurements, the operator must:
The integration of cover measurement and half-cell potential data provides powerful diagnostic insight:
Manufacturers now offer integrated systems that combine cover measurement and half-cell potential mapping in a single instrument. The Profometer PM8500 Corrosion Kit includes a cover meter probe and a multi-electrode wheel (four-wheel or one-wheel electrode) that simultaneously collects cover and potential data. The data is merged in software to produce composite maps showing cover depth contours overlaid with corrosion potential contours — enabling engineers to directly correlate reinforcement protection level with corrosion activity.
Ground Penetrating Radar (GPR) is the primary alternative to cover meters for rebar detection in concrete. While both technologies serve overlapping purposes, they operate on fundamentally different physical principles and have distinct capabilities, advantages, and limitations.
| Parameter | Cover Meter | Ground Penetrating Radar |
|---|---|---|
| Operating principle | Electromagnetic induction (eddy current / magnetic reluctance) | Electromagnetic wave reflection (radar) |
| Detection capability | Ferrous metal only | Any material with dielectric contrast (metal, plastic, voids, tendons, delamination) |
| Maximum detection depth | 100-180 mm (depending on probe and bar spacing) | 400-800 mm (with 1.5-2.7 GHz antenna) |
| Cover measurement accuracy | ±1-5 mm (depending on conditions) | ±5-15 mm (depending on dielectric calibration) |
| Bar diameter estimation | Yes, with spacer method (±1 bar size) | No |
| Spatial resolution | High for individual bars at close spacing | Moderate; hyperbolic reflections can overlap at close bar spacing |
| Data interpretation | Simple, direct numeric readout | Complex; requires trained interpreter for radargram analysis |
| Surface condition sensitivity | Low; works through coatings, tile, thin toppings | Moderate; affected by surface moisture, high conductivity, chloride contamination |
| Operator expertise required | Low to moderate | High |
| Speed of large-area surveys | Moderate (grid-by-grid scanning) | Fast (continuous rolling surveys) |
| Equipment cost | $2,000-$10,000 | $15,000-$40,000 |
The Tešić et al. study (2021), “Comparison of cover meter and ground penetrating radar performance in structural health assessment: case studies,” examined both methods across nine different concrete structures including bridge decks, columns, beams, walls, and slabs. Key findings included:
The practical guidance for engineers is: use a cover meter when precise cover measurement is required (durability compliance, corrosion risk assessment, pre-drilling verification), bar spacing is relatively wide (>75 mm), cover is less than 100 mm, and bar diameter estimation is needed. Use GPR when deep penetration is required (>100 mm), non-metallic objects or voids need detection, rapid large-area scanning is necessary, or multi-layer reinforcement configuration must be determined.
BS 1881-204:1988 — “Testing concrete — Recommendations on the use of electromagnetic covermeters” — is the primary international standard governing cover meter practice. Published by the British Standards Institution, it provides comprehensive guidance on:
Calibration procedures: Three calibration methods are described:
Accuracy requirements: The standard specifies that a calibrated cover meter should achieve ±5% or ±2 mm accuracy under laboratory conditions and ±15% or ±5 mm under average site conditions for covers less than 100 mm. For site conditions meeting specific criteria, the ±5% or ±2 mm target can be approached.
Measurement methodology: The standard details requirements for surface preparation, probe placement, scan procedure (recommended speed of 0.5 m/s maximum), data recording (minimum three readings per location), and instrument maintenance.
Reporting format: Required information includes instrument make and model, probe type and serial number, calibration date and validity, bar diameter setting, bar spacing, date of survey, operator identity, weather conditions (temperature, humidity), and all measured cover values with statistical summary.
Limitations: The standard explicitly cautions about accuracy degradation under: congested reinforcement (bar spacing < bar diameter × 6), covers exceeding probe working range, presence of multiple layers of reinforcement, steel with rust or scaling, and magnetic aggregates.
Other relevant standards and guidance documents include:
Cover meter testing is integrated into a multi-tier inspection workflow for reinforced concrete structures. Typical protocols, such as those published by ACI Committee 228 and various state DOT bridge inspection manuals, follow a hierarchical approach:
Tier 1 — Preliminary survey: Visual inspection combined with chain drag or hammer sounding to identify areas of surface distress. Cover meter spot-checks at representative locations (typically 10-20 points per structural element) provide initial cover data. This tier is often sufficient for routine inspections of structures in good condition.
Tier 2 — Detailed inspection: Systematic cover meter survey using grid scanning (typically 150-500 mm grid) over the entire accessible surface of the element. Cover contour maps are generated, and areas of substandard cover are identified for focused investigation. Rebar layout is documented, and diameter is estimated at representative locations. This tier is appropriate for structures with known deterioration, structures approaching design life, or structures scheduled for major rehabilitation.
Tier 3 — Comprehensive investigation: Full cover meter survey combined with complementary NDT methods: half-cell potential mapping for corrosion risk, ultrasonic pulse velocity for internal quality, ground penetrating radar for deep reinforcement and void detection, and core sampling with petrographic and chemical analysis for material properties. Cover meter data provides the spatial framework for correlating all other NDT results. This tier is reserved for critical structures (major bridges, lifeline infrastructure), structures with advanced deterioration, forensic investigations of failures, and structures requiring load rating or remaining service life assessment.
Practical workflow for a typical bridge deck inspection:
The cover meter remains one of the most practical, cost-effective, and widely deployed NDT tools in the concrete inspection engineer’s arsenal. When used properly — with correct calibration, appropriate probe selection, accurate bar diameter input, and awareness of limitations — it provides reliable data essential for durability assessment, structural evaluation, and informed maintenance and repair decisions across the entire infrastructure lifecycle.
Professional cover meter surveys and rebar mapping for airports, bridges, and infrastructure. Our NDT specialists use advanced Profometer systems with Neighboring Rebar Correction technology for ±1 mm accuracy.
Concrete cover is the minimum depth of concrete between the outer surface and the nearest reinforcing steel, providing corrosion protection through physical bar...
Rebar is steel reinforcing bar embedded in concrete to carry tensile loads that concrete alone cannot resist. In infrastructure inspection, rebar condition is p...
The Schmidt rebound hammer is a spring-driven device that impacts concrete surfaces and measures rebound distance, providing a quick approximate indication of s...