Crack Area Percentage in Pavement and Structural Assessment
Crack area percentage (crack_area_pct) is the ratio of crack mask area to total analyzed image area, expressed as a percentage. It is a key quantitative severity metric in TarmacView’s condition assessment, with thresholds at 1% and 5% triggering higher condition grades and repair priorities. Covers calculation from segmented masks, interpretation, and comparison with other crack severity metrics (width, length, ratio).
What is Crack Area Percentage?
Crack area percentage — represented in TarmacView as the parameter crack_area_pct — is the ratio of the crack mask area to the total analyzed image area, expressed as a percentage. It is the foundational quantitative severity metric in automated pavement and structural surface condition assessment. In pixel-based terms, the calculation is expressed as: Crack Area % = (Crack Pixels / Total Pixels) × 100.
The crack mask itself is the binary output of a semantic segmentation neural network — typically a deep convolutional neural network (CNN) such as U-Net, DeepLab, or a specialized pavement crack segmentation architecture. Each pixel in the input image is classified as either crack (value 1 in the mask) or non-crack / intact surface (value 0). The segmentation model operates on high-resolution images captured by specialized survey vehicles equipped with line-scan cameras, 3D laser profilers, or area-scan imaging systems. The total pixel count in the analyzed region depends on the image resolution and the region of interest (ROI) mask that excludes non-pavement areas such as lane markings, shoulders, gutters, and shadow regions.
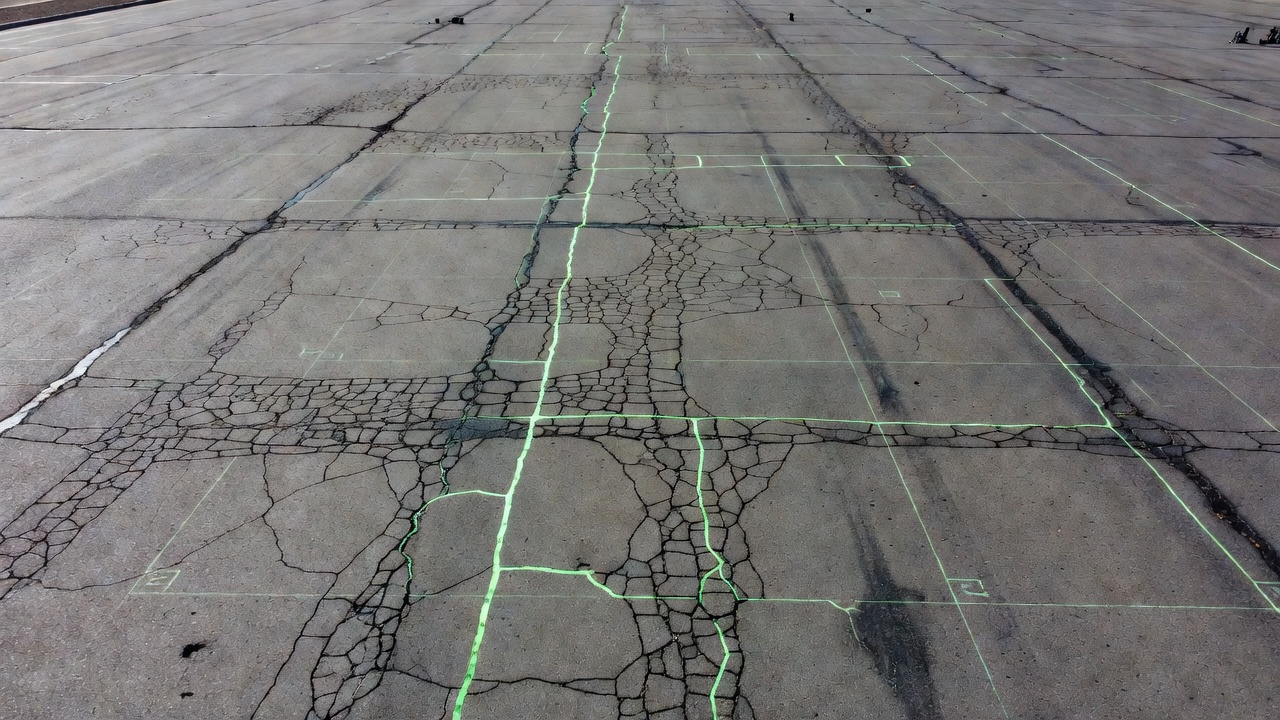
The metric is used across multiple infrastructure domains: flexible and rigid pavements (asphalt and concrete roads), bridge decks (reinforced concrete slabs), runway surfaces (airfield pavements), taxiways and aprons (airport pavements), and concrete structures (dams, retaining walls, and tunnel linings). In each domain, the crack area percentage provides a directly comparable, repeatable, and objective measure of crack severity that eliminates the subjectivity inherent in manual crack surveys.
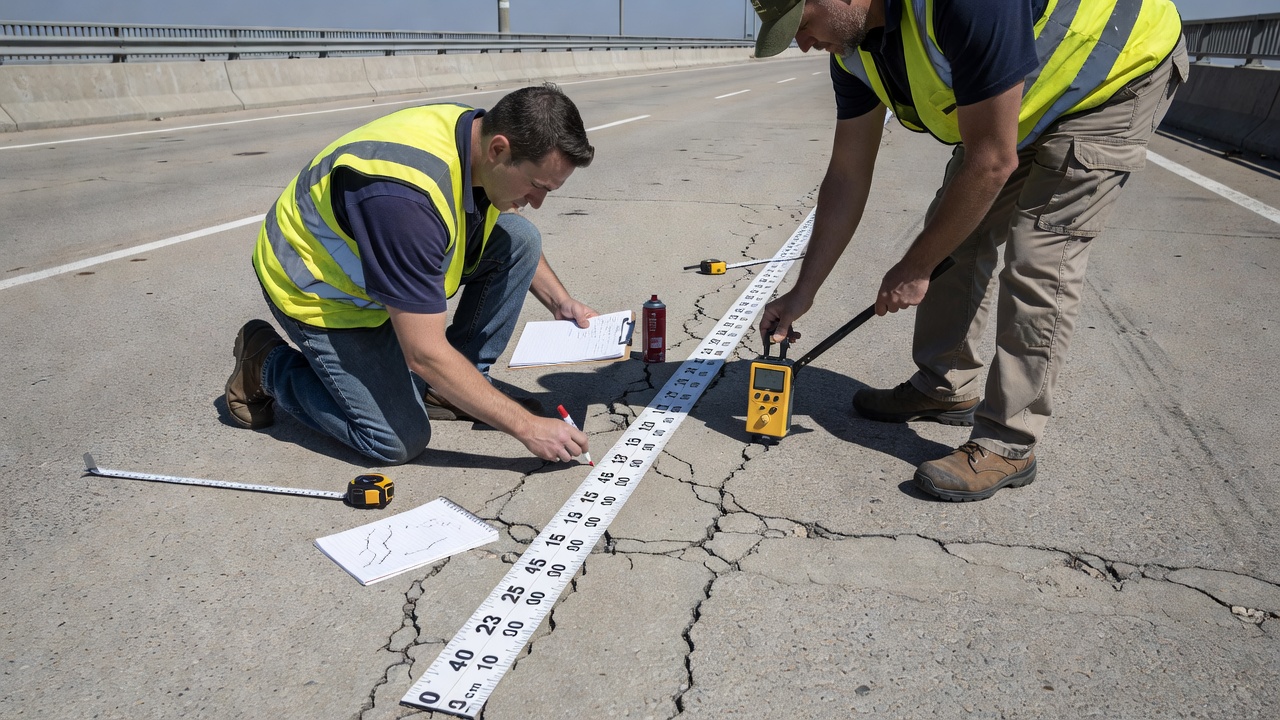
Unlike traditional manual methods where a technician estimates cracked area by visual approximation or by applying a cracking grid template, TarmacView’s crack_area_pct measurement is deterministic for a given segmentation model and input image. This repeatability is essential for trend monitoring — comparing crack area percentage values from successive survey campaigns to quantify deterioration rates with statistical confidence.
Calculation from Segmentation Masks
The derivation of crack area percentage from segmentation involves a systematic pipeline of image acquisition, preprocessing, model inference, post-processing, and metric computation. Each stage affects the accuracy, precision, and reliability of the final crack_area_pct value.
Image Acquisition — Survey vehicles capture pavement surface images using line-scan cameras with typical resolutions of 4,096 pixels (1 mm crack detection), 2,048 pixels (2 mm detection), or 1,300 pixels (3 mm detection) per scan line. The AASHTO R 86-18 standard specifies that the minimum detectable crack dimension for automated pavement surveys should be 1 mm in width and 25 mm in length. Higher resolution enables detection of finer cracks but increases data volume and processing time proportionally. Images are captured under controlled lighting conditions using strobe or LED arrays that minimize shadow effects and ensure consistent illumination across the survey width.
Preprocessing — Raw images undergo geometric correction (lens distortion removal), radiometric normalization (brightness and contrast equalization), and region of interest (ROI) masking. The ROI mask excludes gutters, shoulders, lane markings, and shadow boundaries from the analysis area. This step prevents non-pavement features from artificially reducing the crack area percentage by inflating the total pixel count denominator. Some systems also apply illumination correction to compensate for lighting gradients across the image width, which can affect segmentation accuracy near the image edges.
Semantic Segmentation Inference — The preprocessed image is passed through a trained neural network that outputs a pixel-wise classification. Modern segmentation architectures for pavement crack detection achieve Intersection over Union (IoU) scores of 70-85% on benchmark datasets such as Crack500, DeepCrack, and GAPS384. The network outputs a probability map where each pixel receives a value between 0.0 (intact surface) and 1.0 (crack). A threshold (typically 0.5) converts this probability map into a binary crack mask. More sophisticated approaches use conditional random fields (CRF) or morphological post-processing to refine the mask boundaries and remove isolated false-positive pixels.
Post-Processing — The binary mask undergoes cleaning operations: removal of small connected components below a minimum area threshold (typically 10-50 pixels to eliminate noise), morphological closing to connect fragmented crack segments, and optional skeletonization to compute crack width distributions. These post-processing steps directly affect the final crack_area_pct value — aggressive noise removal reduces the percentage, while conservative filtering preserves it. The choice of post-processing parameters must be documented and consistent across all surveys in a trend monitoring program.
Metric Computation — The final crack area percentage is computed as:
Where pixel_count_crack is the number of pixels classified as crack in the post-processed binary mask, and pixel_count_total is the number of pixels within the ROI. The result is typically reported to two decimal places for research applications or one decimal place for routine network-level surveys.
Measurement Units — Crack area percentage is dimensionless — it represents the proportion of the surface area that is cracked, not a specific physical area. To convert to physical area (square meters or square feet), multiply the percentage by the total surveyed area. For example, a 3.2% crack area percentage on a 100 m² pavement section corresponds to 3.2 m² of cracked surface. This conversion is useful for work quantity estimation in maintenance planning.
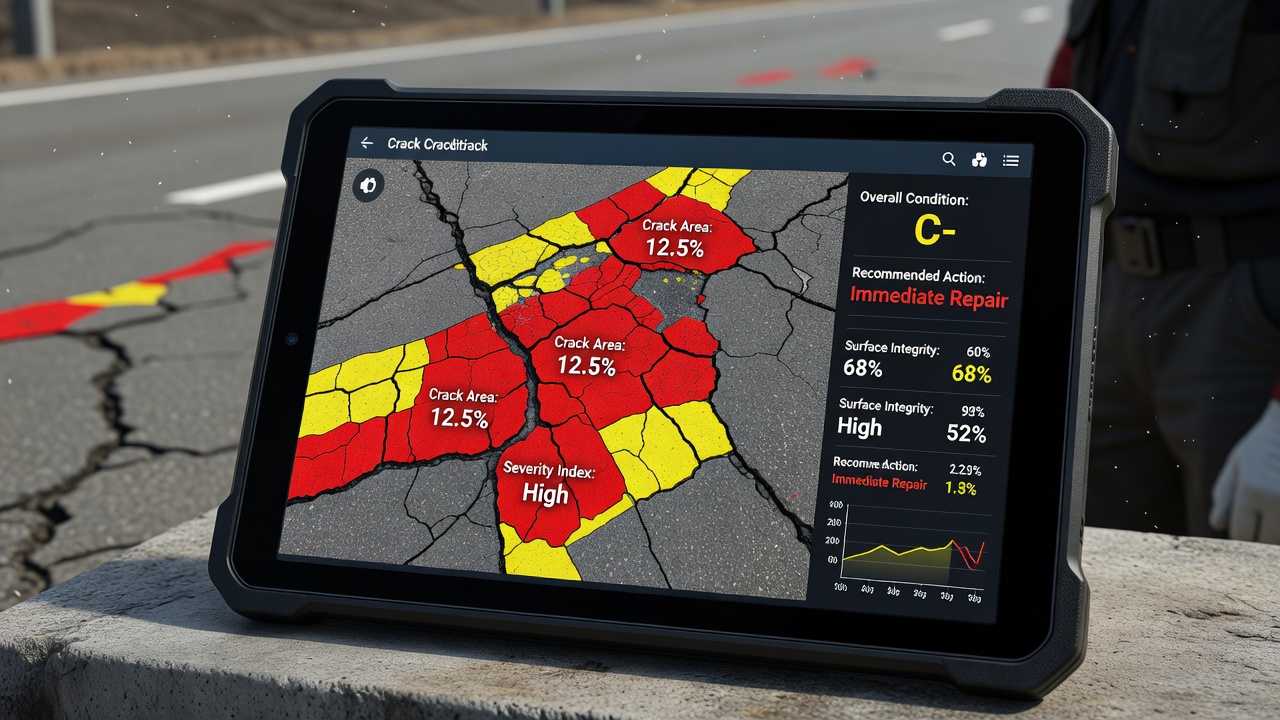
TarmacView Thresholds
TarmacView’s condition assessment system uses crack_area_pct as a primary driver for automated condition grading and repair priority assignment. The system defines two critical thresholds that trigger escalation of the condition grade:
crack_area_pct Range
Condition Grade
Condition Description
Repair Priority
< 1.0%
Grade 1-3
Good to Fair
Routine monitoring
1.0% - 5.0%
Grade 4
Warning
Preventive maintenance
> 5.0%
Grade 5
Critical
Immediate repair
The 1.0% threshold represents the transition from acceptable surface condition to a warning level. Below this threshold, the pavement or structural surface is considered to have only incidental cracking — typically isolated thermal or shrinkage cracks that do not compromise structural integrity or ride quality. At 1-5% crack coverage, the cracking pattern may include interconnected longitudinal and transverse cracks that begin to affect water infiltration resistance and load distribution capacity. This zone triggers Grade 4 in TarmacView’s grading system, which corresponds to a recommendation for preventive maintenance interventions such as crack sealing, surface treatment, or thin overlay.
The 5.0% threshold represents the transition to critical condition. Above this level, the surface exhibits extensive cracking that may include alligator (fatigue) cracking patterns, block cracking, or interconnected crack networks. At crack area percentages exceeding 5%, water infiltration through the crack network accelerates base and subgrade deterioration, stripping of asphalt binder, and freeze-thaw damage in cold climates. This zone triggers Grade 5 — the highest condition grade — and corresponds to a recommendation for structural rehabilitation, thick overlay, or reconstruction.
These thresholds are calibrated against established pavement condition indices. The ASTM D6433 Pavement Condition Index (PCI) classification maps approximately as follows: Pavements with crack area percentages below 1% typically correspond to PCI scores of 71-100 (Satisfactory to Good). The 1-5% range aligns with PCI 56-70 (Fair condition). Above 5% crack area aligns with PCI below 55 (Poor to Failed condition), where structural rehabilitation is typically warranted.
It is important to note that the thresholds are not absolute — local calibration is recommended based on pavement type, traffic level, climate zone, and agency-specific performance criteria. A pavement section on a low-volume rural road may tolerate higher crack area percentages than an interstate highway or an airport runway before requiring intervention. TarmacView allows agencies to adjust threshold values through configuration parameters while maintaining the default values as a starting point.
Crack Area vs Crack Ratio
Crack area percentage and crack ratio are complementary metrics that capture different dimensions of crack severity. Understanding the distinction between them is essential for comprehensive condition assessment.
Crack Area Percentage (crack_area_pct) operates at the pixel level. It divides the total number of crack-classified pixels by the total number of image pixels within the ROI. This metric is sensitive to both the spatial extent of cracks (how much of the surface is cracked) and the thickness of individual cracks (how wide each crack is). A surface with many wide cracks will have a higher crack_area_pct than a surface with the same linear crack length but narrower cracks. This makes crack_area_pct a combined measure of crack intensity and crack geometry.
Crack Ratio operates at the tile level. The surveyed image is divided into a grid of equal-sized tiles (typically 50×50 pixels, 100×100 pixels, or physical dimensions such as 50×50 mm depending on image resolution). Each tile is classified as either cracked (if it contains any crack pixels above a threshold) or intact. The crack ratio is the number of cracked tiles divided by the total number of tiles. This metric captures the spatial distribution of cracking across the surveyed area without regard to crack width — a tile is counted as cracked regardless of whether it contains a hairline crack or a wide fissure.
Feature
Crack Area Percentage
Crack Ratio
Granularity
Pixel-level
Tile-level
Sensitive to crack width
Yes
No
Sensitive to crack density
Yes
Yes
Minimum detection
1 pixel
1 crack pixel per tile
Computational cost
Low (single division)
Moderate (tiling + counting)
Primary use
Severity quantification
Extent mapping
The two metrics provide different but complementary information. A pavement section with widespread hairline cracking may have a high crack ratio (many tiles contain cracks) but a low crack area percentage (each crack occupies very few pixels). Conversely, a section with isolated but wide cracks may have a low crack ratio (few tiles affected) but a moderate crack area percentage (each affected tile has substantial crack pixel coverage).
For optimal condition assessment, both metrics should be evaluated together. TarmacView’s condition matrix combines crack_area_pct and crack ratio to produce a two-dimensional severity-extent classification that more accurately reflects the full condition picture than either metric alone. This combined assessment is particularly important for distinguishing between:
Surface cracking (high crack ratio, low crack area) — typically caused by thermal cycling or aging and treatable with surface seals
Structural fatigue cracking (moderate to high crack ratio, moderate to high crack area) — caused by traffic loading and requiring structural rehabilitation
Progressive deterioration (increasing both metrics over successive surveys) — indicating accelerating damage that requires priority intervention
Crack Area in FHWA LTPP Context
The Federal Highway Administration (FHWA) Long-Term Pavement Performance (LTPP) program is the most comprehensive pavement performance research initiative in the world, having monitored thousands of pavement test sections since 1987. The LTPP program established standardized protocols for measuring and reporting pavement cracking, including cracking percent as a key performance indicator. However, it has been widely recognized that the LTPP manual itself lacks a standard formula for converting linear crack measurements to area percentages, a gap that has required individual agencies to develop their own conversion methodologies.
HPMS Cracking Percent Definitions — The Highway Performance Monitoring System (HPMS) Field Manual defines three pavement-type-specific methods for computing cracking percent, published as Item 52: Cracking Percent.
For asphalt (flexible) pavements, cracking percent is defined as the percentage of total area exhibiting visible fatigue-type cracking in the wheel path at all severity levels. The HPMS protocol standardizes the wheel path width at 39 inches (per the HPMS Field Manual) with wheel path centerlines located 2.5 feet from the lane centerline, representing an average vehicle track width of 5 feet. The calculation multiplies the lineal length of wheel path cracking by 39 inches to derive the total cracked area in square inches. The formula is:
Cracking % = (Area of wheel path cracking / Total section area) × 100
The lane width is standardized at 12 feet for HPMS reporting uniformity across all agencies. The HPMS Field Manual imposes a capping threshold — cracking percent should not generally exceed 54% for 12-ft lanes, 59% for 11-ft lanes, or 65% for 10-ft lanes. Values beyond these caps indicate that the measurement methodology may need review. Cracking percent is reported to the nearest 1%.
For jointed concrete pavements (JCP), cracking percent is defined as the percentage of slabs exhibiting transverse cracking. The protocol excludes longitudinal cracks, corner breaks, D-cracking, and ASR cracking from the calculation. The HPMS reports two values: the total number of slabs in the section and the number of slabs with at least one transverse crack extending at least one-half the lane width. The formula is (Cracked slabs / Total slabs) × 100.
For continuously reinforced concrete pavements (CRCP), cracking percent is the percentage of area with longitudinal cracking, punchouts, and/or patching. Transverse cracks at or near right angles to the direction of travel are explicitly excluded from the calculation. Longitudinal cracked area is computed as crack length multiplied by a 1-foot width. Punchout area is the area bounded by two transverse cracks and the pavement edge or longitudinal joint. The formula is (Area of cracking, punchouts, patches / Total section area) × 100.
Louisiana DOTD Extent Conversion Factors — In response to the lack of standardization in how linear crack length is converted to area, the Louisiana Department of Transportation and Development (DOTD) proposed severity-based extent width multipliers as an interim standard. For fatigue (alligator) cracking in wheel paths with 3-ft wheel path widths, the multipliers are: Low severity — 1 ft width multiplier; Medium severity — 2 ft; High severity — 3 ft. The resulting formula is:
For composite and non-wheel path asphalt pavements, the proposed multipliers are: Low severity (crack width < 0.25 in.) — 0.5 ft (6 in.); Medium severity (0.25-0.5 in.) — 0.83 ft (10 in.); High severity (> 0.5 in.) — 1.17 ft (14 in.) plus pattern crack area. Jointed concrete pavements use the same width thresholds with spalling defined as 10% or more of crack length spalled to a width of 1 inch or greater. Blowups in concrete pavements trigger an automatic 100% cracking percent assignment.
The LTPP program’s crack severity thresholds for width classification are: Low severity — crack width < 0.25 in. (6.35 mm); Medium severity — 0.25-0.5 in. (6.35-12.7 mm); High severity — > 0.5 in. (12.7 mm) or pattern cracks forming polygons smaller than 3×3 ft. These severity tiers directly influence the extent width multipliers used in area conversion.
Area Measurement Accuracy
The accuracy of crack area percentage measurements is influenced by a cascade of factors spanning image acquisition, segmentation model performance, and post-processing choices. Systematic errors in any stage propagate through the pipeline and affect the final metric value.
Image Resolution Effects — The minimum detectable crack width is directly determined by the image ground sampling distance (GSD), measured in millimeters per pixel. A system with 1 mm/pixel resolution can theoretically detect cracks as narrow as 1 mm (one pixel wide), while a 3 mm/pixel system requires cracks to be at least 3 mm wide for detection. This resolution-dependent detection threshold introduces a systematic bias: lower-resolution systems will consistently under-report crack area percentage because they miss finer cracks entirely. The FHWA has established that the minimum detectable crack dimension for automated surveys per AASHTO R 86-18 is 1 mm width by 25 mm length. Surveys conducted at resolutions coarser than this standard will produce crack area percentages that are not directly comparable to those from higher-resolution systems.
Segmentation Model Performance — The accuracy of the crack mask is characterized by two standard metrics: precision (the fraction of detected crack pixels that are truly crack) and recall (the fraction of true crack pixels that are detected). A model with high precision but low recall will produce crack masks that contain mostly real cracks but miss many crack pixels, resulting in an under-estimated crack_area_pct. Conversely, a model with low precision but high recall will over-detect cracks (including false positives from shadows, oil stains, sealed cracks, or texture variations), resulting in an over-estimated crack_area_pct.
The F1 score — the harmonic mean of precision and recall — provides a combined quality measure. For pavement crack segmentation, published F1 scores on benchmark datasets range from 0.70 to 0.85 depending on architecture, training data quality, and crack complexity. A model with F1 = 0.80 means that approximately 20% of the mask is either missed cracks or false detections, introducing a corresponding uncertainty in the crack_area_pct value.
Environmental Factors — Lighting conditions, surface moisture, and temperature all affect measurement accuracy. Wet pavements reduce contrast between cracks and the surrounding surface, causing segmentation models to under-detect cracks. Surface shadows from trees, structures, or neighboring vehicles can produce false-positive detections if not properly masked. Sun angle relative to the survey direction affects crack visibility — cracks oriented perpendicular to the sun direction appear more prominent than those oriented parallel. Consistent survey protocols that control for time of day, weather conditions, and vehicle orientation are essential for repeatable measurements.
FHWA Acceptance Tolerances — The FHWA has established vendor acceptance tolerances for automated cracking measurement systems through research documented in FHWA-RC-20-0005. The reported tolerances range from ±4% to ±7.5% for HPMS cracking percent measurements, depending on pavement type, severity level, and survey system capabilities. These tolerances represent the expected agreement between automated measurements and ground truth (manual) surveys. Agencies procuring automated survey services typically specify acceptance criteria that require the vendor’s crack area measurements to fall within these tolerance bands.
Quality Assurance Protocols — Validating crack area percentage measurements requires a standardized ground truth methodology. The current best practice involves:
Manual crack mapping on a subset of pavement sections (typically 5-10% of the total survey length)
Crack template comparison using printed templates or digital overlays to compare automated and manual crack maps
Statistical analysis of the differences, including bias (mean error) and precision (standard deviation of error)
Calibration adjustment of segmentation thresholds or post-processing parameters if systematic bias is detected
The AASHTO PP 79-14 standard provides a framework for validating automated pavement distress measurement systems, including requirements for test sections, distress types, and statistical acceptance criteria.
Crack Area and Structural Significance
Crack area percentage is not a direct structural capacity metric — it does not measure the remaining strength or load-carrying capacity of a pavement or structural element. However, extensive research has established correlations between crack coverage and structural performance that make crack area percentage a valuable proxy for structural condition assessment.
Pavement Structural Capacity — In flexible pavements, the relationship between crack area and structural capacity follows a characteristic progression. The onset of fatigue cracking typically occurs when the tensile strain at the bottom of the asphalt layer exceeds the material’s fatigue endurance limit. As cracking propagates upward through the asphalt layer (bottom-up fatigue cracking), the crack area percentage at the surface increases. Research from the AASHTO Guide for Design of Pavement Structures and the Mechanistic-Empirical Pavement Design Guide (MEPDG) has established that:
Crack area percentages below 5% typically indicate the pavement is in the initiation phase of fatigue cracking where cracks have reached the surface but have not yet interconnected
Crack area percentages between 5% and 20% indicate the propagation phase where cracks interconnect to form alligator patterns, and the structural capacity may be reduced to 60-80% of the original design value
Crack area percentages above 20% indicate the deterioration phase where the pavement structure is severely compromised, often requiring reconstruction rather than rehabilitation
Concrete Structural Members — For reinforced concrete bridge girders, columns, and slabs, the relationship between crack area and structural significance is more complex. Research at the University of Texas at Austin under TxDOT Project 0-6919-1 developed two methods for crack-based structural assessment:
The Cracked Continuum Shear Strength Assessment uses measured crack widths, inclinations, and patterns as inputs to mechanical models based on Modified Compression Field Theory (MCFT) . The research found that diagonal crack widths alone are not reliable indicators of shear distress — the crack area coverage and crack pattern geometry provide more meaningful information. The project developed field aids including nomographs and charts that relate measured crack parameters to the percentage of ultimate structural capacity.
The Fractal Analysis for Crack Pattern Quantification applies fractal and multifractal analysis to images of cracked concrete to derive a Damage Index (DI) from the fractal dimension (D) of the crack pattern. Experimental validation on prestressed girders and reinforced concrete panels under shear loading showed linear correlations between crack fractal dimension and structural damage level. This research demonstrated that crack pattern geometry — not just total crack area — is critical for structural assessment.
Critical Crack Width Benchmarks — Prior empirical work by Birrcher et al. (2009) established approximate relationships between diagonal crack width and remaining capacity in reinforced concrete beams:
Diagonal Crack Width
Approximate % of Ultimate Capacity
0.01 in. (0.25 mm)
50-60%
0.02 in. (0.51 mm)
70-80%
0.03 in. (0.76 mm)
80-90%
However, these relationships vary significantly by member geometry, reinforcement ratio, and shear span-to-depth ratio. Crack area percentage alone cannot determine the structural capacity — it must be combined with crack orientation, member type, loading conditions, and material properties for meaningful structural assessment.
Crack Area in Bridge Deck Assessment
Bridge deck cracking is one of the most critical deterioration mechanisms in concrete bridge infrastructure. The crack area percentage on a bridge deck surface directly correlates with chloride diffusion rates, corrosion initiation time, and long-term service life. Unlike pavement applications where cracking primarily affects ride quality and structural load distribution, bridge deck cracking directly impacts the durability and safety of the entire bridge structure.
AASHTO LRFD Crack Control Limits — The AASHTO LRFD Bridge Design Specifications establish maximum allowable crack widths for reinforced concrete bridge decks based on exposure conditions. The allowable limits are:
Exposure Condition
Maximum Allowable Crack Width
Exposure Factor
Dry air or protective membrane
0.017 in. (0.43 mm)
1.00
Deicing chemicals or seawater spray
0.013 in. (0.33 mm)
0.75
Seawater (submerged)
0.010 in. (0.25 mm)
0.75
Epoxy-coated reinforcement bridges
0.007 in. (0.18 mm)
FHWA study
While these limits are expressed in terms of crack width, the cumulative effect of multiple cracks across the deck surface is captured by crack area percentage. A deck with many cracks at the allowable width limit may accumulate a significant crack area percentage that allows chloride ingress across a substantial portion of the deck surface.
FHWA / VTRC Bridge Deck Research — A landmark study by the Virginia Transportation Research Council (VTRC) conducted on 37 bridge decks (10 with ordinary Portland cement concrete and 27 with supplementary cementitious materials) produced several findings directly relevant to crack area percentage interpretation:
No strong correlation was found between individual surface crack width and chloride diffusion rates. This challenges the traditional emphasis on crack width control for durability.
Significant correlation was found between crack depth and chloride diffusion — deeper cracks provide shorter pathways for chloride ions to reach the reinforcement.
Crack frequency — measured as the number of cracks per unit area, closely related to crack area percentage — was found to be the more critical durability factor than individual crack width.
Service life impact: Decks constructed with supplementary cementitious material (SCM) concrete achieved approximately 100 years of service life in uncracked condition. The presence of cracking reduced service life to levels comparable to ordinary Portland cement concrete, regardless of concrete quality.
These findings have significant implications for crack area percentage assessment on bridge decks. The TarmacView thresholds (1% and 5%) provide appropriate screening levels for bridge deck inspection. Decks with crack_area_pct above 1% warrant closer investigation including half-cell potential mapping, chloride content profiling, and delamination sounding to assess corrosion risk.
Distress Density in ASTM PCI for Bridges — The ASTM D6433 standard for Pavement Condition Index (PCI) on bridge decks uses distress density as the foundational calculation for condition assessment. The formula is:
Density (%) = (Measured Quantity of Distress) / (Total Sample Unit Area) × 100
For area-based distresses (alligator cracking, block cracking, patching), the measured quantity is in square feet. For linear distresses (longitudinal and transverse cracking), the measured quantity is in linear feet, converted to equivalent area via severity-dependent conversion factors. The distress density feeds into deduct value curves that map density plus severity to deduct points, which are then combined into the Corrected Deduct Value (CDV) and finally PCI = 100 − CDV.
Service Life Modeling — The relationship between crack area percentage and bridge deck service life is modeled using Fick’s second law of diffusion for chloride ingress:
C(x,t) = C_s × [1 − erf(x / 2√(D_c × t))]
Where C(x,t) is the chloride concentration at depth x and time t, C_s is the surface chloride concentration, erf is the Gaussian error function, and D_c is the apparent chloride diffusion coefficient. Cracks increase the apparent diffusion coefficient by providing preferential pathways for chloride ingress. The effective D_c for a cracked deck is a function of the crack area percentage, crack width distribution, and crack depth. Higher crack area percentages produce higher effective diffusion coefficients, accelerating the time to corrosion initiation at the reinforcement depth.
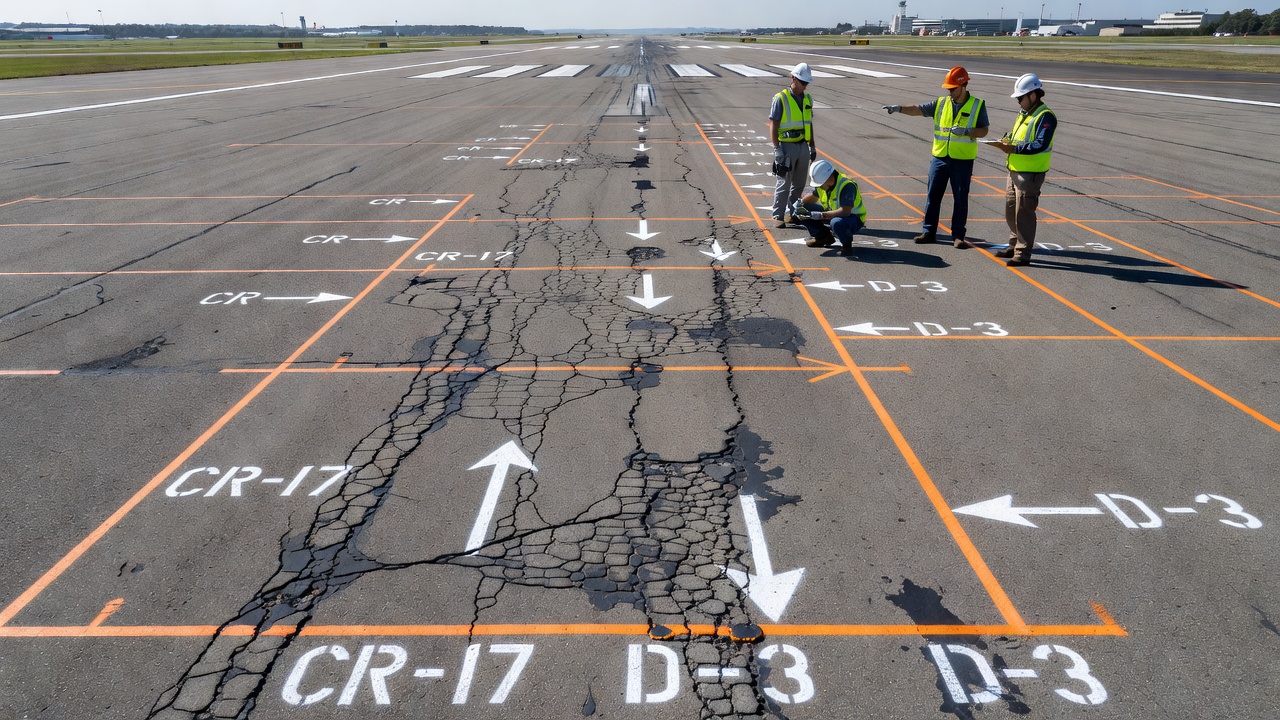
Crack Area in Runway Assessment
Runway pavement condition assessment places the most stringent requirements on crack quantification because of the safety-critical nature of aircraft operations. The International Civil Aviation Organization (ICAO) , through its Annex 14 — Aerodromes and the Aerodrome Design Manual (Doc 9157, Part 3 — Pavements) , establishes standards for runway surface condition assessment that directly relate to crack area measurement.
ICAO ACR-PCR Method — The Aircraft Classification Rating — Pavement Classification Rating (ACR-PCR) method for pavement strength reporting references cracking condition as a determining factor in pavement classification. Specifically, the ICAO guidance provides that if the rigid element of a composite pavement is “not severely distressed by closely spaced cracking,” the pavement may be classified as rigid for load-rating purposes. If severe cracking is present, the pavement must be classified as flexible, which carries different load restrictions. This binary classification directly depends on crack area percentage — closely spaced cracking over a significant percentage of the pavement surface triggers the reclassification.
Subgrade Strength Reduction — Section 3.3.3 of ICAO Doc 9157 Part 3 explicitly warns that severely cracked surfacing can substantially reduce the effective subgrade strength during wet periods. Water infiltrating through the crack network saturates the subgrade, reducing its California Bearing Ratio (CBR) by 30-70% depending on soil type and crack density. This strength reduction must be accounted for in the ACR-PCR evaluation. Crack area percentage above TarmacView’s 5% threshold on runway surfaces would typically trigger this subgrade strength reduction consideration.
ASTM D5340 — Airport Pavement Condition Index — The airport-specific PCI standard, ASTM D5340, governs condition assessment for airfield pavements. Like the road PCI (ASTM D6433), it uses distress density as the foundational metric:
Density (%) = (Measured Quantity of Distress) / (Sample Unit Area) × 100
For linear cracking on airport pavements, the measured quantity is in linear feet. The conversion to equivalent area uses severity-dependent extent width multipliers specific to airport pavement distress definitions. The deduct value curves in ASTM D5340 are calibrated specifically for aircraft loading conditions and differ from those used in ASTM D6433 for highway pavements. The Corrected Deduct Value (CDV) is computed through an iterative m-procedure, and PCI = 100 − max CDV.
The ICAO/Airport PCI rating scale is:
PCI Range
Condition
Implication for Operations
86-100
Good
No restrictions
71-85
Satisfactory
Normal operations
56-70
Fair
Increased maintenance monitoring
41-55
Poor
Load restrictions may apply
26-40
Very Poor
Load restrictions
11-25
Serious
Limited operations
0-10
Failed
Closed to traffic
Crack area percentage below 1% typically corresponds to PCI 71-100 (Satisfactory to Good). Between 1% and 5%, PCI falls to 41-70 (Fair to Poor), where load restrictions may start to apply for the heaviest aircraft. Above 5%, PCI falls below 40 (Very Poor to Failed), typically triggering weight restrictions or operational limitations.
Tire Pressure Considerations — Airport pavements experience tire pressures of 100-250 psi (compared to 80-120 psi for highway trucks). The higher tire pressures concentrate load over smaller contact areas, increasing the stress intensity at crack tips and accelerating crack propagation. Runway surfaces with elevated crack area percentages are particularly vulnerable to pumping — the ejection of water and fine material through cracks under aircraft tire loading. The pump-out of subgrade material creates voids beneath the pavement that accelerate structural deterioration. Crack area percentage trend monitoring on runways is therefore more time-sensitive than on highway pavements, with shorter intervention windows.
Crack Area for Work Quantity Estimation
Crack area percentage directly informs work quantity estimation for maintenance and rehabilitation projects. The metric provides a data-driven basis for material quantity calculations, cost estimation, and contractor bid preparation.
Crack Sealing Operations — For crack sealing projects, the required quantity of sealant material is proportional to the crack area percentage. Using automated crack area measurements, the required sealant volume can be estimated as:
Sealant Volume = Crack Area × Average Crack Depth × Fill Factor
Where the crack area is derived from the measured crack_area_pct multiplied by the total pavement area, the average crack depth is determined from core sampling or ground-penetrating radar calibration, and the fill factor accounts for the fraction of crack volume that will be filled by the sealant (typically 0.6-0.8 for hot-applied rubberized sealants). For a pavement section of 10,000 m² with a crack_area_pct of 3.2%, the crack area is 320 m². With an average crack depth of 15 mm and a fill factor of 0.7, the required sealant volume is approximately 3.36 m³.
Pavement Patching Quantities — For full-depth patching of deteriorated areas, crack area percentage provides an initial screening metric. Pavement sections with crack_area_pct above the threshold values typically require patching of the worst areas. The relationship between crack area and required patch area is non-linear — patch areas are typically larger than the crack area because patches must extend to sound material and form rectangular or trapezoidal shapes. Typical patch area multipliers range from 1.5 to 3.0 times the crack area, depending on crack distribution and agency patching standards.
Overlay Thickness Design — Crack area percentage on the existing pavement surface influences overlay thickness design. Pavements with low crack area percentages (below 1%) can typically accept a thin overlay (25-50 mm) for surface restoration. Pavements with moderate crack area (1-5%) require intermediate overlay thickness (50-100 mm) with potential crack relief interlayer (CRL) or stress-absorbing membrane interlayer (SAMI). Pavements with high crack area (above 5%) typically require structural overlays (100 mm or thicker) or mill-and-fill operations where the cracked surface layer is removed before overlay placement.
Budget Allocation and Prioritization — At the network level, crack area percentage provides a defensible basis for budget allocation. Pavement sections sorted by crack_area_pct produce a prioritized ranking that can be compared against available budget to determine the optimal intervention year for each section. The area-weighted average crack percentage for a network provides a network-level performance indicator that can be tracked over time and used for high-level budget advocacy:
Network Crack % = Σ(Section Area × Section Crack Area %) / Σ(Section Area)
A network-level crack area percentage trending upward over successive surveys indicates a deteriorating asset base requiring increased maintenance investment. The rate of change provides a deterioration rate that can be used for long-term financial planning.
Crack Area Trend Monitoring
Longitudinal trend monitoring of crack area percentage is one of the most powerful applications of automated crack measurement. By comparing crack_area_pct values from successive survey campaigns, agencies can quantify deterioration rates, evaluate the effectiveness of maintenance interventions, and predict future condition with statistical confidence.
Deterioration Curve Modeling — Crack area percentage over the pavement lifecycle typically follows a characteristic sigmoidal (S-shaped) curve with three phases:
Phase 1 — Initiation (first 20-40% of service life): Crack area percentage remains near zero. The pavement structure is intact and traffic loading has not yet generated surface-visible cracking. This phase duration depends on structural design strength, traffic loading, and environmental conditions.
Phase 2 — Propagation (40-80% of service life): Crack area percentage begins to increase, initially slowly and then accelerating. Individual cracks initiate at the surface (top-down cracking from thermal and oxidation effects) or propagate from the bottom of the asphalt layer (bottom-up fatigue cracking). The rate of increase in crack_area_pct during this phase is the deterioration rate, expressed as percentage points per year.
Phase 3 — Deterioration (80-100% of service life): Crack area percentage increases rapidly as cracks interconnect into alligator patterns. The pavement structure loses load distribution capacity, and maintenance interventions become increasingly ineffective. The deterioration rate in this phase is typically 2-5 times the rate in Phase 2.
The deterioration rate is influenced by several factors:
Factor
Effect on Crack Area Progression
Traffic loading (ESALs)
Higher ESALs accelerate crack propagation rate
Freeze-thaw cycles
Each cycle can increase crack width by 0.01-0.05 mm
Asphalt binder aging
Increased stiffness reduces fatigue resistance
Base/subbase drainage
Poor drainage accelerates deterioration by 2-4x
Initial construction quality
Poor compaction reduces fatigue life by 30-50%
Maintenance interventions
Crack sealing can slow progression by 50-70%
Intervention Effectiveness Evaluation — Trend monitoring of crack area percentage before and after maintenance interventions provides objective measurement of treatment effectiveness. A successful crack sealing program should show:
A plateau or reduction in crack_area_pct in the year following treatment
A reduced deterioration rate (slope of crack_area_pct vs. time) compared to the pre-treatment trend
Extended service life — the time to reach the 5% threshold should be delayed by 3-7 years depending on treatment type
Comparative analysis of treated and untreated control sections provides the most rigorous evaluation. Agencies implementing crack management programs typically designate 5-10% of treated sections as untreated controls for performance comparison.
Predictive Modeling — Historical crack_area_pct time series data enables predictive modeling of future condition. The simplest approach is linear extrapolation of the deterioration rate, though this underestimates the acceleration in Phase 3. More sophisticated approaches use:
Logistic regression models that fit the sigmoidal deterioration curve to historical data
Markov chain models that predict the probability of transitioning between condition states (defined by crack_area_pct thresholds) from one survey to the next
Machine learning models that incorporate traffic, climate, structural, and maintenance variables to predict future crack_area_pct
The output of predictive modeling is an estimated remaining service life (RSL) for each pavement section — the projected time to reach the critical 5% crack_area_pct threshold. RSL estimates form the basis for multi-year maintenance program planning, budget optimization, and life-cycle cost analysis.
Survey Frequency Recommendations — The optimal survey frequency for crack area trend monitoring depends on the deterioration rate:
Deterioration Rate (points/year)
Recommended Survey Interval
Typical Pavement Type
< 0.5% per year
3-5 years
Low-volume roads, good structural capacity
0.5-2.0% per year
2-3 years
Medium-volume roads, adequate capacity
2.0-5.0% per year
1-2 years
High-volume roads, deteriorating
> 5.0% per year
Annual or more frequent
Critical pavements, rapid deterioration
The recommended interval maintains at least three data points in the Phase 2 propagation period to establish a reliable deterioration rate before the pavement reaches the critical 5% threshold. Agencies with large networks may use a stratified sampling approach — surveying critical and rapidly deteriorating sections more frequently while surveying stable sections less frequently — to optimize inspection budget allocation while maintaining trend monitoring coverage across the entire network.
Frequently Asked Questions
Crack area percentage (crack_area_pct) is the ratio of crack mask area to total analyzed image area, expressed as a percentage. It is calculated by dividing the number of pixels classified as crack in the segmented mask by the total number of pixels in the analyzed image region, then multiplying by 100. In pixel-based terms: Crack Area % = (Crack Pixels / Total Pixels) × 100. The crack mask comes from a semantic segmentation neural network that classifies each pixel as either cracked surface or intact surface.
TarmacView uses two critical thresholds: 1% and 5%. When crack_area_pct is below 1%, the condition is considered good. When it reaches between 1% and 5%, the condition grade escalates to Grade 4 (warning level). When it exceeds 5%, the condition grade escalates to Grade 5 (critical level), triggering the highest repair priority. These thresholds are calibrated against established pavement condition indices such as ASTM D6433 PCI ratings.
Crack area percentage (crack_area_pct) operates at the image level — it divides total crack pixels by total image pixels across the entire captured image. Crack ratio is a tile-level metric that divides the number of tiles containing cracks by the total number of tiles in the survey. Crack area percentage provides a finer-grained severity measure sensitive to crack thickness and density, while crack ratio captures spatial extent across the surveyed area. Both metrics are used together for a complete condition picture.
Under the FHWA Long-Term Pavement Performance (LTPP) program, cracking percent is defined differently by pavement type. For flexible pavements, cracking percent is the percentage of total area exhibiting visible fatigue-type cracking in the wheel path. The HPMS Field Manual uses a default wheel path width of 39 inches with centerlines located 2.5 ft from the lane centerline. The calculation multiplies lineal length of wheel path cracking by 39 inches to derive cracked area. Maximum reported cracking percent is capped at 54% for 12-ft lanes per HPMS standards.
Crack area percentage on bridge decks directly correlates with chloride diffusion rates and long-term durability. Research by the Virginia Transportation Research Council (VTRC) on 37 bridge decks found that crack frequency (measured as area coverage) had stronger correlation with chloride diffusion than individual crack widths. High crack area percentages on bridge decks accelerate corrosion initiation by providing multiple pathways for chloride ingress through the concrete cover, reducing service life from 100 years (uncracked SCM concrete) to levels comparable to ordinary Portland cement concrete.
Runway surface crack area percentage is measured using high-resolution imagery collected by survey vehicles at typical speeds of 30-50 mph. ASTM D5340 governs airport Pavement Condition Index (PCI) surveys using distress density as the foundational calculation. For linear cracking on airport pavements, crack length is measured in linear feet and converted to area via severity-dependent extent width multipliers. The ICAO Aerodrome Design Manual (Doc 9157 Part 3) explicitly warns that severely cracked surfacing can substantially reduce subgrade strength during wet periods, making crack quantification critical for airport safety.
Measurement accuracy depends on several factors: image resolution (pixels per millimeter), segmentation model precision and recall, lighting conditions during image capture, surface moisture, the presence of sealed cracks versus active cracks, and the minimum detectable crack width. Modern systems with 4,096-pixel line-scan cameras detect cracks as narrow as 1 mm. The FHWA has established vendor acceptance tolerances ranging from ±4% to ±7.5% for HPMS cracking percent measurements. Calibration against ground truth surveys using standardized crack templates is essential for quality assurance.
Crack area percentage typically follows a non-linear progression over the pavement lifecycle. In the first 20-40% of service life, crack area remains near zero. As the pavement enters the deterioration phase, crack area percentage increases slowly at first, then accelerates as cracks propagate and interconnect (alligator cracking). The progression rate is influenced by traffic loading (ESALs), environmental factors (freeze-thaw cycles, thermal gradients), structural capacity (SN or thickness), and maintenance interventions. Trend monitoring of crack_area_pct over successive surveys enables predictive modeling of remaining service life.
Crack area percentage serves as a PCI proxy in automated condition assessment systems. While the full ASTM D6433 PCI calculation requires 19 distinct distress types with severity ratings, crack area percentage provides a quantifiable surrogate that correlates strongly with overall pavement condition, particularly for flexible pavements where cracking is the dominant distress. TarmacView's threshold mapping — Grade 4 (1-5%) and Grade 5 (>5%) — aligns with PCI ranges of 56-70 (Fair) and 0-55 (Poor to Failed) respectively.
Need Automated Pavement Crack Assessment?
TarmacView provides AI-powered crack area percentage analysis for pavements, bridge decks, and runway surfaces. Our automated segmentation and condition grading system delivers repeatable, quantitative severity metrics for infrastructure asset management.
Automated crack width measurement derives the opening width of detected cracks from segmented pixel masks using Euclidean distance transform from crack edges to...
Crack segmentation is the computer vision task of classifying every pixel in an image as either crack or non-crack, producing a binary mask that enables precise...
32 min read
Computer Vision
Deep Learning
+2
Cookie Consent We use cookies to enhance your browsing experience and analyze our traffic. See our privacy policy.