Ultrasonic Testing (UT)
Ultrasonic Testing (UT) uses high-frequency sound waves (typically 20 kHz–200 MHz) to detect internal flaws, measure thickness, and assess material properties i...
31 min read
Non-Destructive Testing
Concrete Inspection
+2
Crosshole Sonic Logging (CSL) is an ultrasonic non-destructive testing method for evaluating the integrity of drilled shafts, bored piles, and slurry walls by transmitting ultrasonic pulses between water-filled access tubes and analyzing wave speed, first arrival time, and signal energy to detect voids, soil inclusions, necking, honeycombing, and other anomalies in deep foundations.
Crosshole Sonic Logging (CSL), also referred to as ultrasonic crosshole testing or cross-hole sonic logging, is a non-destructive testing (NDT) method standardized under ASTM D6760 for evaluating the structural integrity of cast-in-place concrete deep foundations. CSL is the most widely specified ultrasonic method for quality assurance of drilled shafts, bored piles, caissons, and slurry walls in major infrastructure projects worldwide.
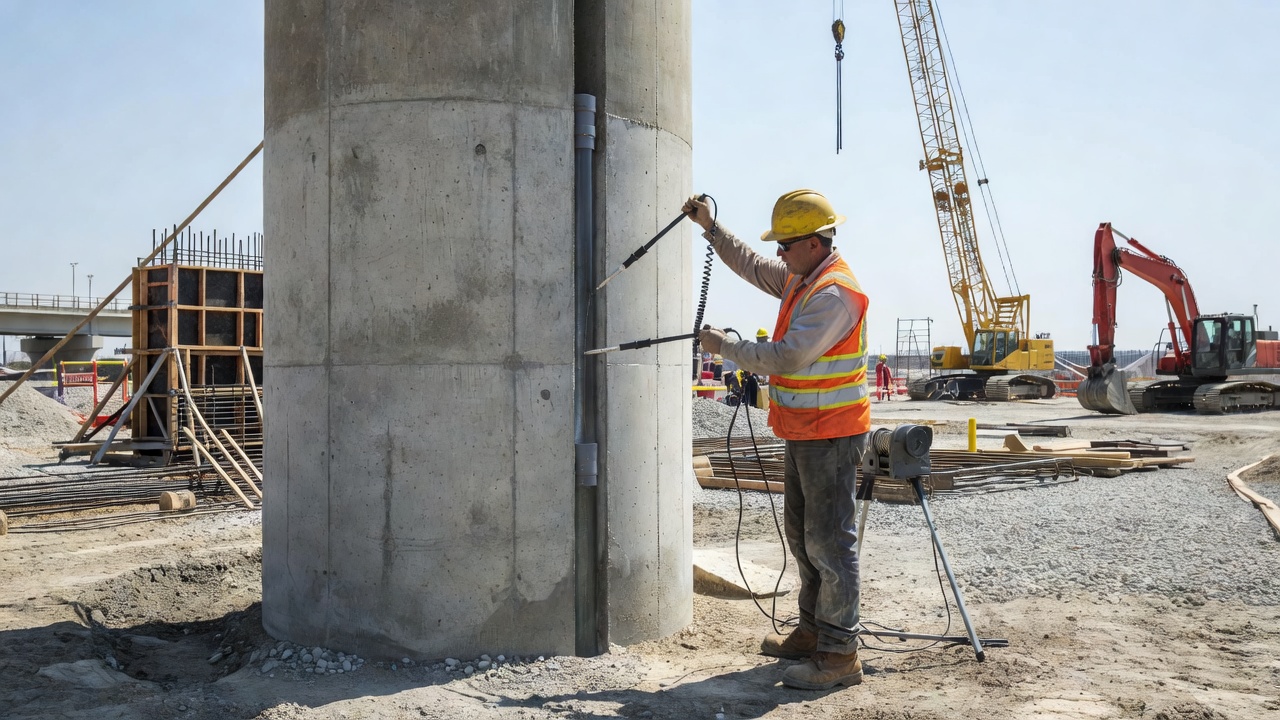
CSL uses ultrasonic pulses transmitted between parallel access tubes pre-installed within the reinforcement cage of a foundation element before concrete placement. The tubes are filled with water to provide acoustic coupling between the ultrasonic transducers and the surrounding concrete. A transmitter probe emits ultrasonic pulses at frequencies typically between 25 and 50 kHz, while a receiver probe in an adjacent tube detects the signals after they travel through the concrete. The pulse velocity, first arrival time (FAT), and signal energy or amplitude are recorded at regular depth intervals as the probes are pulled simultaneously from the base to the top of the foundation element.
The method is applicable to any length of foundation element — there is no theoretical depth limitation as long as access tubes extend to the full depth of the shaft. CSL is widely applied to bridge foundations, high-rise building piles, marine structures, wind turbine foundations, transmission tower bases, and other critical infrastructure where foundation failure would have severe consequences. According to the Federal Highway Administration (FHWA) Geotechnical Engineering Circular No. 10 (GEC-10) on Drilled Shafts (FHWA-NHI-18-024), CSL is specified on virtually all major transportation projects involving drilled shaft foundations in the United States.
The intent of CSL testing, as defined by the Deep Foundations Institute (DFI) Task Force on CSL Terminology and Evaluation Criteria, is to identify irregularities such as soil intrusion, necking, soft bottom conditions, segregation, voids, honeycombing, and other anomalies that could result in poor structural performance of the foundation. The DFI task force emphasizes that CSL test results alone should not be the sole basis for accepting or rejecting a shaft — they are one component of a comprehensive evaluation framework that includes construction records, concrete test results, and engineering judgment.
The fundamental principle of CSL is based on the relationship between ultrasonic pulse velocity and concrete quality. The velocity of a compressional (P-wave) ultrasonic pulse through concrete is a function of the material’s elastic modulus, density, and Poisson’s ratio, as described by the following relationship:
Vp = √[E(1-ν) / ρ(1+ν)(1-2ν)]
Where Vp is the compressional wave velocity, E is the dynamic modulus of elasticity, ρ is the material density, and ν is Poisson’s ratio. In practical terms, higher-quality concrete with greater density and stiffness transmits ultrasonic pulses faster than low-quality, deteriorated, or defective concrete.
For normal structural concrete, pulse velocities typically range between 3,500 and 4,500 meters per second (m/s). Values above 4,000 m/s generally indicate good-quality concrete. Velocities between 3,000 and 3,500 m/s suggest questionable quality, while values below 3,000 m/s are strongly indicative of poor-quality concrete, voids, or other significant defects. A local reduction in velocity of 15-25% or more compared to the average velocity of the sound concrete in the same shaft is typically considered indicative of an anomaly requiring further investigation.
Signal attenuation — the reduction in amplitude or energy of the ultrasonic pulse as it travels through concrete — provides a second independent indicator of concrete condition. The amplitude of the received signal decreases due to scattering at aggregate boundaries, absorption by the cement paste matrix, and reflection or diffraction at defect interfaces. Inhomogeneities such as cracks, voids, honeycombing, or soil inclusions cause significant local attenuation of the ultrasonic signal, often more pronounced than the velocity reduction. Modern CSL systems measure both relative energy (RE) and first arrival time (FAT), providing two complementary parameters for anomaly detection.
| Parameter | Sound Concrete | Questionable | Defective |
|---|---|---|---|
| Pulse Velocity (m/s) | > 4,000 | 3,000 - 4,000 | < 3,000 |
| FAT Increase (%) | < 10% | 10 - 20% | > 20% |
| Relative Energy (%) | > 60% | 30 - 60% | < 30% |
| Wave Speed Reduction | < 10% | 10 - 20% | > 20% |
The frequency of the ultrasonic pulse influences the detection resolution and penetration capability. Higher frequencies (40-50 kHz) provide better resolution for detecting smaller defects but have higher attenuation and thus shorter effective penetration distances. Lower frequencies (20-30 kHz) penetrate greater distances between tubes but have poorer resolution. The practical spacing between access tubes is generally limited to approximately 3.6 meters (12 feet) for reliable signal transmission. For larger-diameter shafts, additional tubes must be installed to maintain tube spacing within acceptable limits.
The acoustic impedance mismatch between concrete and air is approximately 100,000:1, meaning that even thin air-filled voids act as almost perfect reflectors of ultrasonic energy. A void as thin as 1-2 mm can block the direct ultrasonic path and cause the signal to travel around it, resulting in measurable delays in first arrival time and significant energy loss. Water-filled voids, by contrast, have a smaller impedance mismatch with concrete and may produce less pronounced attenuation.
The quality and reliability of CSL results depend critically on proper installation of access tubes. The tubes must be installed before concrete placement, attached securely to the reinforcement cage, and maintained in a clean, parallel, and watertight condition throughout construction.
Tube materials are typically Schedule 40 steel or Schedule 40 or 80 PVC with nominal inside diameters of 38 mm (1.5 inches) or 50 mm (2.0 inches) . Steel tubes are preferred for deep shafts and aggressive environments due to their greater stiffness, better resistance to damage during cage handling and concrete placement, and superior acoustic coupling (steel has a closer acoustic impedance match to concrete than PVC). PVC tubes are more economical and adequate for most applications but require thicker walls (Schedule 80) for deep shafts to resist hydrostatic pressure at depth.
Tube layout requirements per ASTM D6760 and FHWA GEC-10:
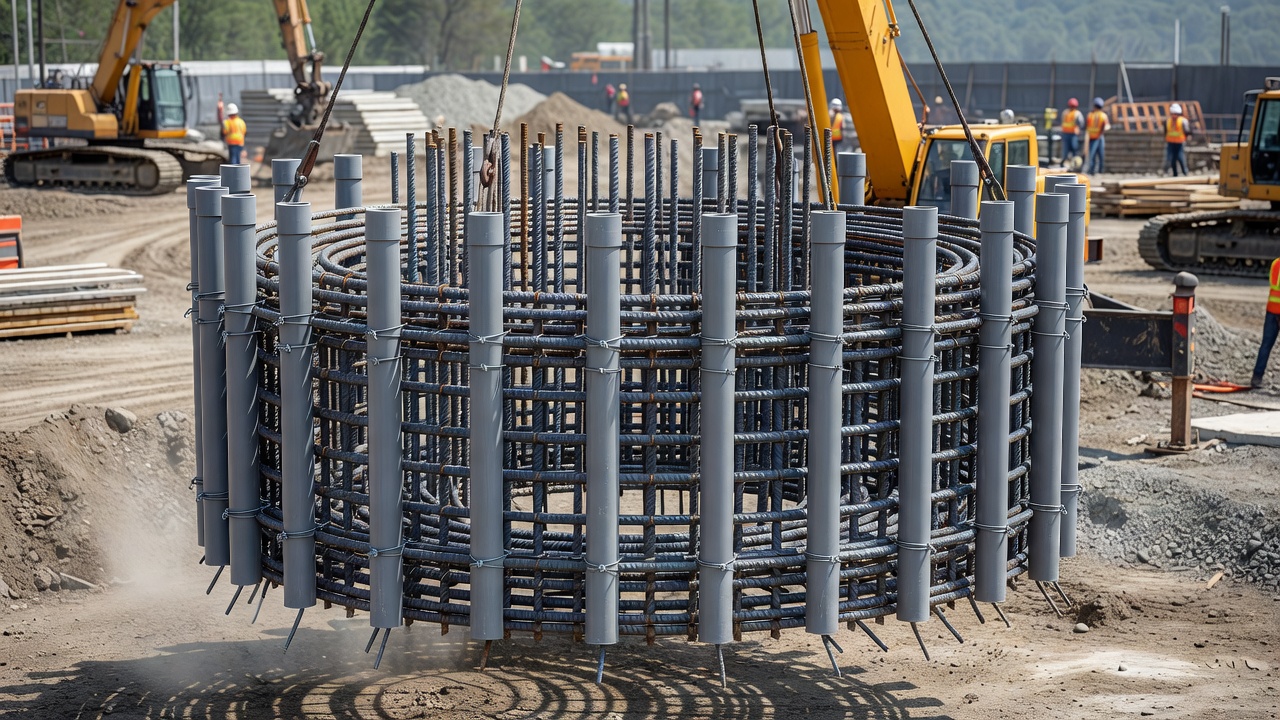
Tube attachment requires careful execution. The tubes are secured to the reinforcement cage using wire ties, U-bolts, or specialty clips at vertical intervals of 1-2 meters (3-6 feet) to prevent movement during cage lifting and concrete placement. The tubes must be kept as parallel as possible; non-parallel tubes introduce geometric uncertainty in the raypath length calculation, which directly affects velocity determination. Cage deformation during lifting or concrete placement can cause tube misalignment that produces false anomalies in CSL data.
Post-installation verification includes:
According to FHWA research and DFI guidance, improper tube installation is the leading cause of unreliable CSL results. Tubes that are crushed, blocked, or displaced during concrete placement can produce data that is difficult or impossible to interpret. The cost of tube installation is small compared to the cost of constructing a defective shaft that goes undetected.
The CSL test procedure is prescribed by ASTM D6760 — Standard Test Method for Integrity Testing of Concrete Deep Foundations by Ultrasonic Crosshole Testing. The standard defines equipment requirements, calibration procedures, testing methodology, and reporting formats.
Pre-test preparation:
Before testing, concrete must have achieved sufficient strength — typically minimum 7 days curing or 70% of design compressive strength, though this varies by specification. The access tubes are flushed with clean water to remove any debris, then filled completely with water for acoustic coupling. A wetting agent may be added to reduce surface tension and improve probe-to-water coupling.
Equipment calibration is performed using a water bath calibration tube — a reference tube of known dimensions filled with water at the same temperature as the field tubes. The transmitter and receiver probes are submerged in the calibration bath, and the system measures the baseline transit time through water. This zero-offset calibration accounts for:
Equipment requirements per ASTM D6760:
| Component | Specification |
|---|---|
| Transmitter frequency | 25 - 50 kHz (typically 40-50 kHz for standard testing) |
| Receiver frequency response | 20 - 60 kHz (matching transmitter range) |
| Sampling rate | Minimum 1 MHz (higher rates provide better time resolution) |
| Depth encoder resolution | ±10 mm or better |
| Pulse repetition rate | Sufficient for continuous data at specified pull rate |
| Amplitude measurement | Minimum 8-bit resolution (12-bit recommended) |
| Data acquisition | Automated with depth-triggered recording |
Testing sequence:
The probes are lowered to the base of the access tubes in adjacent tube pairs (e.g., Tube A-Tube B, Tube B-Tube C, Tube C-Tube A for a three-tube configuration). In a four-tube configuration, diagonal pairs are often tested in addition to adjacent pairs. The standard test uses horizontal raypaths — the transmitter and receiver probes are maintained at the same elevation throughout the test.
The probes are pulled upward simultaneously from base to top at a controlled rate, typically between 0.5 and 2.0 meters per minute. Data is recorded at depth increments of 10-50 mm (0.4-2.0 inches), depending on the required resolution and the expected size of defects. At each depth increment, the system records:
For quality assurance, a reversed test is performed by swapping the transmitter and receiver positions and repeating the logging for each pair. This helps identify directional bias caused by equipment issues or coupling asymmetries.
Post-test procedures include:
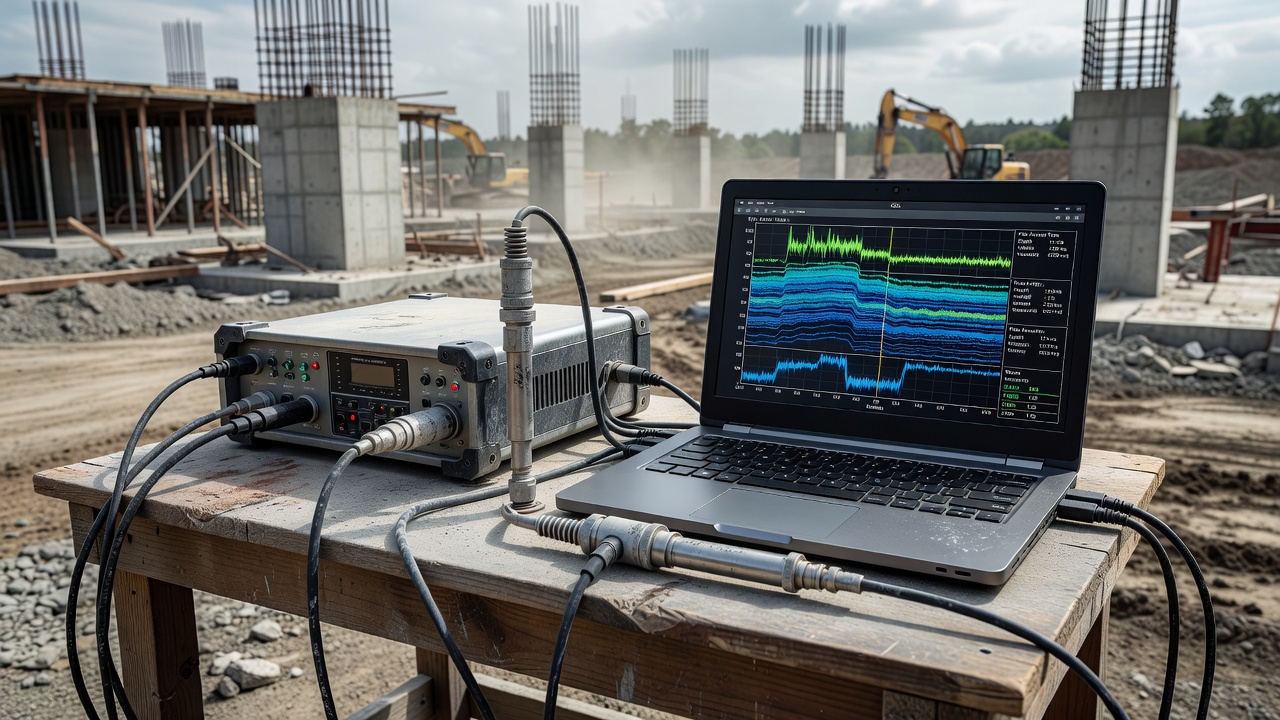
CSL data interpretation relies on the analysis of three primary data outputs: first arrival time (FAT) profiles, relative energy (RE) profiles, and waterfall diagrams. These are examined together to identify zones of anomalous concrete that may indicate structural defects.
First Arrival Time (FAT):
The first arrival time is the elapsed time from the trigger of the transmitted pulse to the detection of the first ultrasonic energy at the receiver. It represents the fastest wave path through the concrete between the two tubes. FAT is inversely proportional to pulse velocity — lower velocities produce longer arrival times.
FAT data is plotted as a continuous profile with depth, typically showing FAT in microseconds (μs) on the horizontal axis and depth on the vertical axis. The analyst identifies:
ASTM D6760 does not define specific acceptance criteria — it explicitly leaves interpretation to engineering judgment. However, industry practice and DFI guidance provide commonly used thresholds. The French standard AFNOR NF P94-160-1 suggests a 20% FAT increase as the threshold for a significant anomaly. Many US state DOTs use 10-20% velocity reduction as the threshold for “questionable” concrete and greater than 20% velocity reduction for “poor” concrete. It is critical to note that a 20% FAT increase does not equal a 20% velocity decrease — the relationship is nonlinear, with a 20% FAT increase corresponding to approximately a 17% velocity decrease.
Relative Energy (RE):
The relative energy or relative amplitude represents the strength of the received ultrasonic signal, typically expressed as a percentage of a reference value (the maximum signal or the average signal in sound concrete). Energy is attenuated by:
RE profiles are plotted alongside FAT profiles, with depth on the vertical axis. Coincident FAT increases and RE decreases are strong indicators of a genuine anomaly. Isolated FAT increases without energy loss may result from geometric factors (non-parallel tubes) rather than material defects. Conversely, isolated energy drops without FAT changes may indicate coupling problems (air bubbles on the probe face, debris in the tube) rather than concrete defects.
Waterfall Diagrams:
The waterfall diagram is the most comprehensive visual representation of CSL data. Each horizontal line in the waterfall represents the complete ultrasonic waveform at a specific depth increment, plotted as positive and negative peaks. A series of these waveforms at successive depths creates the waterfall effect.
In the waterfall presentation:
The waterfall diagram enables the analyst to:
Data normalization is essential for consistent interpretation. CSL data is typically normalized to a baseline segment of the shaft that exhibits representative sound concrete properties. Deviations from this baseline are expressed as percentages. The DFI task force recommends that CSL rating criteria not rely solely on hard boundary values (e.g., “FAT > 20% = defect”) but instead incorporate the shape, size, location, and extent of anomalies, as well as their persistence across multiple tube pairs, into the evaluation.
CSL tomography (also called crosshole tomography or ultrasonic tomography) is an advanced extension of standard CSL that produces two-dimensional (2D) or three-dimensional (3D) images of the internal condition of a drilled shaft. While standard CSL provides a series of point measurements along discrete horizontal raypaths between adjacent tube pairs, tomography reconstructs the spatial distribution of wave speed across the full cross-section of the foundation element.
Principle of tomography:
Standard CSL uses only horizontal raypaths — the transmitter and receiver probes are maintained at the same elevation, providing one measurement per depth increment per tube pair. In tomographic data acquisition, additional angled or diagonal raypaths are collected by offsetting the transmitter and receiver probes vertically. For example, the transmitter may be at depth D while the receiver is at depth D+0.3 m (D+1 ft), producing a raypath that traverses the concrete at an angle.
By acquiring multiple angled raypaths at each depth level, a dense network of intersecting paths is established through the concrete volume. The travel time along each raypath represents the integrated effect of the concrete properties along that path. Tomographic inversion algorithms — typically based on Simultaneous Iterative Reconstruction Technique (SIRT) or algebraic reconstruction — iteratively solve for the wave speed distribution that best fits the observed travel times across all raypaths.
Tomographic data acquisition:
The result for a shaft with four access tubes (six tube pairs) and ten offset positions per pair is approximately 60 raypaths per depth level — vastly more information than the six horizontal raypaths of standard CSL.
Tomographic imaging output:
The inversion process produces velocity contour maps or color-coded tomograms showing the spatial distribution of P-wave velocity across the shaft cross-section. These images:
When tomography is indicated:
Tomography is not performed routinely — it is a diagnostic tool deployed when standard CSL indicates potential anomalies. According to the DFI task force and FHWA guidance, tomography is recommended when:
Limitations of tomography:
The classification of CSL anomalies has evolved significantly through the work of the Deep Foundations Institute (DFI) Task Force on CSL Terminology and Evaluation Criteria, published in October 2019. This document established standardized terminology and evaluation criteria to replace inconsistent, agency-specific rating systems that had proliferated across the industry.
Standardized terminology per DFI:
| Term | Definition |
|---|---|
| Anomaly | Abnormal data that deviates from expectations, and may indicate a flaw or defect |
| Flaw | Any imperfection in the planned shape or material of the foundation that may not necessarily affect its performance |
| Defect | Any flaw that, because of size, location and inferred concrete properties, will have a significant adverse effect on the performance of the foundation |
This hierarchy is critical: not all anomalies are flaws, and not all flaws are defects. The DFI task force explicitly cautions against using the term “defect” until an irregularity has been proven likely to significantly reduce the shaft’s capacity or durability.
CSL classification categories recommended by DFI:
Class A (Acceptable): CSL results are within normal expected ranges for sound concrete. First arrival times are consistent with the baseline, and relative energy is high throughout the profile. Minor localized variations (FAT increase < 10%) that do not persist across multiple tube pairs are considered acceptable.
Class B (Conditionally Acceptable): CSL results show anomalies that are not clearly Class A or Class C. FAT increases of 10-20% and/or moderate energy reductions are observed in one or more tube pairs. Class B shafts require additional evaluation — typically involving tomography, coring, structural analysis, or a combination — to determine whether the anomalies constitute flaws or defects affecting foundation performance.
Class C (Highly Abnormal): CSL results show significant deviations from expected values, with FAT increases exceeding 20% and/or severe energy reductions, often across multiple tube pairs and contiguous depth intervals. Class C shafts are presumed to contain significant defects requiring remediation, repair, or replacement unless detailed investigation demonstrates otherwise.
The DFI task force emphasizes that CSL classification alone should not be the sole basis for shaft acceptance or rejection. The evaluation must consider:
Common anomaly types and their CSL signatures:
Research summarized by the DFI task force indicates that CSL can reliably detect flaws occupying 10-15% or more of the cross-sectional area when located within the reinforcement cage between access tubes. Flaws outside the cage in the cover zone may remain undetected even if they occupy a larger percentage of the cross-section, because the ultrasonic raypaths do not pass through those zones.
Bridge foundations are among the most critical applications of Crosshole Sonic Logging. Drilled shafts supporting bridge piers, abutments, and tower foundations are typically large-diameter (1.0 to 3.5 meters or 3 to 12 feet), heavily loaded, and constructed in challenging subsurface conditions where undetected defects could lead to catastrophic failure.
The FHWA Geotechnical Engineering Circular No. 10 (GEC-10) — Drilled Shafts: Construction Procedures and Design Methods (FHWA-NHI-18-024) — provides comprehensive guidance on CSL for transportation structures. According to GEC-10, CSL is the primary non-destructive test method specified for drilled shaft integrity verification on Federal-aid highway projects. The document states that CSL should be performed on 100% of production shafts on major bridges, unless alternative NDT methods are specifically justified.
CSL application to bridge foundation types:
Bridge pier shafts: Large-diameter drilled shafts (1.5-3.5 m) supporting multi-column bents or single-column piers. CSL is essential for verifying the integrity of these shafts, which are typically designed for combined axial, lateral, and moment loading from superstructure dead load, live load, wind, seismic, and scour effects.
Bridge abutment shafts: Smaller-diameter shafts (1.0-1.8 m) supporting abutment foundations. CSL is specified for abutment shafts in seismic zones or where subsurface conditions (soft soils, karst, scour-prone streams) increase the risk of construction defects.
Cable-stayed and suspension bridge anchorages: Massive concrete anchorages for cable-stayed and suspension bridges often contain multiple drilled shaft groups or large-diameter shafts (up to 4.0 m). CSL provides quality assurance for these critical tension-resisting foundation elements.
Marine bridge foundations: Shafts constructed in riverine, coastal, or offshore environments where tremie concrete placement through water or drilling slurry increases the risk of defects. CSL is the primary method for verifying shaft integrity where visual inspection of the exterior is impossible.
Cost-benefit considerations for bridges:
The cost of CSL testing (typically $500-$2,000 per shaft, depending on depth, number of tubes, and reporting requirements) is negligible compared to the cost of a foundation failure or the expense of remedial work after load has been applied. According to FHWA data, the cost of repairing a defective shaft discovered during construction is typically 3-10 times the cost of CSL testing for all shafts on the project. The cost of remediating a shaft that fails under service loads is orders of magnitude higher, often requiring partial or complete bridge demolition.
Project requirements for CSL on bridge projects:
Most state Departments of Transportation (DOTs) have supplemental specifications based on ASTM D6760 that include:
CSL and Low-Strain Pile Integrity Testing (PIT) are the two most widely used NDT methods for deep foundations, but they serve different purposes and have fundamentally different capabilities. Understanding their differences is essential for selecting the appropriate method for a given project.
Low-Strain Pile Integrity Testing (PIT), standardized by ASTM D5882, uses a hand-held hammer to impart a low-strain impact on the pile head. The impact generates a compressive stress wave that travels down the pile shaft. Reflections of this wave occur at changes in impedance (cross-sectional area changes, material property changes, cracks, voids) and at the pile toe. A sensor (accelerometer or geophone) mounted on the pile head records the reflected wave signal. The resulting reflectogram (velocity vs. time plot) is analyzed to identify reflection events and their arrival times, which are converted to depth using the known wave speed in concrete.
| Parameter | CSL (ASTM D6760) | PIT (ASTM D5882) |
|---|---|---|
| Principle | Ultrasonic transmission between tubes | Stress wave reflection from pile head |
| Access tubes required | Yes (installed pre-concrete) | No |
| Depth limitation | None (practical limit: tube length) | L/D ratio < 40-45 for reliable toe detection |
| Resolution | High (can detect 10% cross-section anomalies) | Moderate (15-20% cross-section changes) |
| Defect localization | Precise depth and circumferential position | Depth only, no circumferential information |
| Tomography capability | Yes (2D/3D velocity imaging) | No |
| Soil stiffness effect | None | Can mask or distort toe reflections |
| Test speed | 15-45 minutes per tube pair | 2-5 minutes per pile |
| Planning requirement | Must be specified before concrete placement | Can be performed at any time |
| Interpretation difficulty | Moderate (requires pattern recognition) | High (requires wave propagation expertise) |
| Equipment cost | Higher (probes, encoder, multichannel system) | Lower (hammer, sensor, data collector) |
| Per-test cost | $500-$2,000 per shaft | $100-$500 per pile |
When CSL is preferred:
When PIT is preferred:
Combined use of CSL and PIT:
For major infrastructure projects, a dual-approach strategy is increasingly common: PIT is performed on all production piles for initial screening and qualitative assessment, while CSL is performed on a subset of critical piles or piles that show anomalous PIT results. This approach balances cost and coverage. FHWA GEC-10 recommends that for drilled shafts with CSL, supplementary PIT testing may provide additional information about overall shaft condition, particularly for detecting defects above the top of the access tubes.
CSL is an integral component of comprehensive deep foundation inspection programs that span the entire construction process from excavation through acceptance. The method is specified in construction contracts, referenced in quality assurance plans, and recognized by building codes and transportation agency standards as the primary NDT method for verifying drilled shaft integrity.
Integration with construction inspection workflow:
CSL testing is not performed in isolation — it is one element of a multi-layered quality assurance framework that includes:
Timing of CSL in the construction sequence:
CSL testing is performed when concrete has achieved sufficient strength but before the shaft is loaded by superstructure construction. Typical timing:
Correlation with construction records:
The most reliable CSL interpretations are those that correlate anomalies with construction events. A comprehensive inspection program includes:
Anomalies that correlate with recorded construction events — particularly delays, concrete supply interruptions, or slurry management issues — are more confidently diagnosed as genuine defects requiring remediation. Anomalies with no corresponding construction event record may warrant additional investigation before deciding on remediation.
Remediation options based on CSL results:
When CSL identifies anomalies classified as defects requiring remediation, several options are available depending on defect size, location, and structural significance:
Reporting requirements per ASTM D6760:
The CSL test report must include, as a minimum:
The QR-secured report format increasingly adopted by transportation agencies links field evidence directly to the final report, supporting transparent communication with owners, contractors, and regulatory agencies.
CSL for ongoing structural health monitoring:
While CSL is primarily a construction quality assurance tool, it is occasionally used for post-construction evaluation of existing foundations where access tubes were installed during original construction but no initial CSL was performed, or where changes in condition (e.g., after a seismic event, scour exposure, or change in loading) warrant re-testing. Tubes that have been maintained with caps and kept clear of debris can be re-accessed years after construction for repeat CSL testing. The comparison of baseline CSL data (from initial construction) with re-test data provides the most sensitive indicator of developing defects.
The DFI task force emphasizes that CSL is most valuable when performed proactively as part of a planned quality assurance program, rather than reactively after a problem is suspected. When access tubes have been properly installed and maintained, CSL provides deep foundation engineers with the most comprehensive, high-resolution data available for assessing the internal integrity of concrete deep foundations.
Leverage Crosshole Sonic Logging combined with drone-based visual inspection to assess deep foundation integrity faster, safer, and more comprehensively. Our solutions integrate multiple NDT methods for actionable asset intelligence.
Ultrasonic Testing (UT) uses high-frequency sound waves (typically 20 kHz–200 MHz) to detect internal flaws, measure thickness, and assess material properties i...
Non-Destructive Testing (NDT) encompasses methods to evaluate material properties, detect defects, and assess structural condition without causing damage. For i...
Impact-Echo is a stress-wave nondestructive testing method where a short-duration mechanical impact on a concrete surface generates stress waves that reflect fr...