Debonding
Debonding is defined as the loss of adhesion at the interface between a concrete overlay or repair material and the existing concrete substrate, or between an e...
29 min read
Concrete Defects
Pavement Distress
+3
Delamination is the separation of concrete layers along a plane approximately parallel to the surface, creating subsurface voids detectable by hammer sounding, chain drag, or infrared thermography before surface spalling occurs. Most commonly caused by corroding reinforcing steel expanding and fracturing the surrounding concrete.
Delamination is the separation of concrete along a plane approximately parallel to the surface, creating a subsurface void or discontinuity that is not visible from the surface. In plain terms, it is the horizontal splitting of concrete into two or more layers that remain physically separate — bonded together poorly or not at all — but with the top layer still in place, hiding the defect from casual visual observation. The term is precisely defined in ASTM D4580/D4580M-23 (Standard Practice for Measuring Delaminations in Concrete Bridge Decks by Sounding) as a subsurface discontinuity in concrete caused by the separation of the concrete mass, typically occurring at or near the plane of the top reinforcing steel mat before any surface spalling develops.
The fundamental distinction between delamination and other concrete defects lies in the orientation and location of the fracture plane. Whereas cracks are typically vertical or diagonal fractures that can propagate through the full thickness of the concrete element, delamination is a horizontal fracture that runs parallel to the exposed surface, typically at a depth of 25 to 75 mm (1 to 3 inches) — corresponding to the depth of the uppermost reinforcing steel. This fracture plane creates a subsurface laminate — hence the term “delamination” — consisting of the thin surface layer of concrete separated from the sound concrete mass below. The air-filled or moisture-filled void between these layers is typically 0.1 to 2.0 mm thick in its early stages but can widen as deterioration progresses.
The mechanism driving delamination is primarily mechanical — the generation of internal tensile stresses that exceed the relatively low tensile strength of concrete. Concrete possesses a compressive strength of 20 to 60 MPa (3,000 to 8,700 psi) in typical structural applications but a tensile strength of only 2 to 5 MPa (300 to 700 psi), or approximately 8 to 12 percent of its compressive strength. When internal expansion forces generated within the concrete mass exceed this tensile capacity, a fracture initiates. What makes delamination distinctive is that the fracture propagates along the path of least resistance — typically along the plane of reinforcing steel, where the steel-concrete bond provides a natural discontinuity, or along the interface between layers placed at different times.
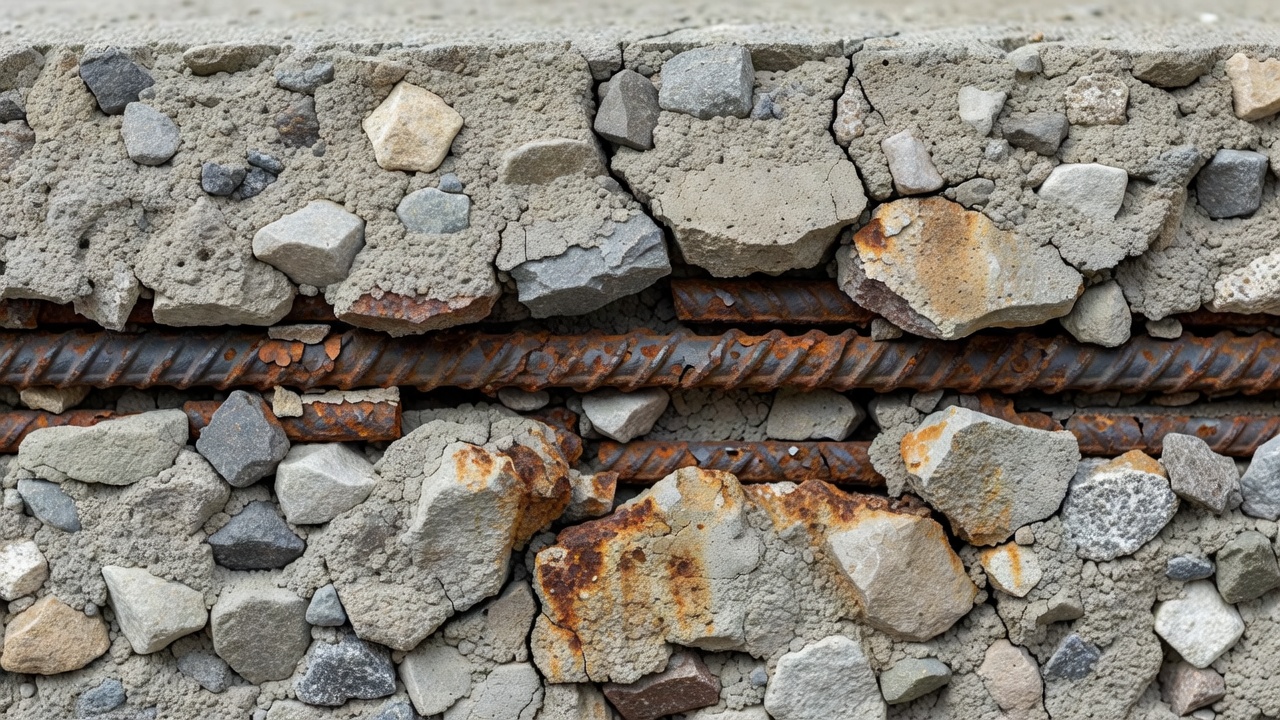
The mechanics of corrosion-induced delamination are well documented in the bridge engineering literature. When reinforcing steel corrodes in the presence of moisture and oxygen, the iron in the steel oxidizes to form various iron oxides and hydroxides — collectively referred to as rust. These corrosion products occupy between 3 and 6 times the volume of the original metallic iron. This volumetric expansion ratio is the central physical parameter governing delamination. Research conducted at the University of Pittsburgh’s Swanson School of Engineering has quantified that rust products exert expansive pressures of 3 to 7 MPa (450 to 1,000 psi) on the surrounding concrete, which exceeds the tensile capacity of the concrete cover by a factor of 1.5 to 3.5. The result is the initiation and propagation of microcracks radiating outward from the corroding rebar surface, which coalesce into a continuous horizontal fracture plane.
The depth at which delamination forms is governed by the depth of the uppermost reinforcing steel mat. In reinforced concrete bridge decks constructed to AASHTO specifications, the top mat of rebar typically has a minimum concrete cover of 50 mm (2 inches) with a tolerance of +10 mm. In older bridges built before modern cover requirements, cover may be as little as 25 mm (1 inch) — making them particularly susceptible to early delamination. In airport pavements, the top reinforcing is typically 75 to 100 mm (3 to 4 inches) below the surface, a greater cover depth designed to withstand the higher point loads from aircraft landing gear. The critical delamination depth for detection purposes is generally considered to be within 100 mm (4 inches) of the surface, as deeper delaminations are beyond the effective detection range of most sounding and thermal methods.
The progression of delamination follows a well-established timeline governed by chloride diffusion rates, concrete quality, environmental exposure, and cover depth. For a typical bridge deck in a northern climate subject to de-icing salt application, the stages are: chloride penetration (5–15 years to reach threshold concentration at rebar depth), corrosion initiation (onset of active corrosion once chloride threshold of approximately 0.6 to 0.9 kg/m³ of chloride ion at the rebar surface is exceeded), microcracking (1–3 years of rust expansion before detectable delamination forms), delamination formation (continuous subsurface fracture plane detectable by sounding), and spalling (2–5 years after detectable delamination, the surface layer breaks free). The total timeline from construction to visible spalling in a chloride-rich environment is typically 20 to 30 years, but the delamination phase occupies 5 to 10 years of that window — providing a significant inspection window if the correct detection methods are employed.
Corrosion of embedded reinforcing steel is responsible for an estimated 80 to 90 percent of all delamination in reinforced concrete bridge decks and is the dominant deterioration mechanism for concrete infrastructure in chloride-rich environments. The process begins with the breakdown of the passive protective oxide film that naturally forms on steel in the highly alkaline environment of concrete (pH 12.5 to 13.5). Two primary mechanisms destroy this passivity: chloride ion ingress and carbonation.
Chloride ions, primarily from de-icing salts applied to bridge decks and runways during winter, penetrate the concrete cover through the pore structure. The American Concrete Institute (ACI 222R) identifies a threshold chloride concentration of approximately 0.6 to 0.9 kg of chloride ion per cubic meter of concrete (or 0.2 to 0.3 percent by weight of cement) at which the passive film destabilizes and active corrosion begins. Once initiated, the corrosion rate is accelerated by moisture, oxygen availability, and higher temperatures. In wet-dry cycling zones — common in bridge decks exposed to intermittent de-icer application and rain — corrosion rates can reach 0.1 to 0.5 mm of steel section loss per year, compared to negligible rates (<0.002 mm/year) in dry, chloride-free conditions.
The electrochemical nature of rebar corrosion creates discrete anodic and cathodic regions along the steel bar. At the anode, iron dissolves: Fe → Fe²⁺ + 2e⁻. At the cathode, oxygen is reduced in the presence of water: O₂ + 2H₂O + 4e⁻ → 4OH⁻. The iron ions react with hydroxide ions and oxygen to form the voluminous corrosion products Fe(OH)₂, Fe(OH)₃, Fe₂O₃·H₂O, and Fe₃O₄. These products occupy 3.0 to 6.4 times the volume of the consumed steel, depending on the specific oxide formed and the degree of hydration. Magnetite (Fe₃O₄) occupies a volume ratio of approximately 2.1; hematite (Fe₂O₃) occupies approximately 3.0; hydrated ferrous oxide (Fe(OH)₂) occupies approximately 3.7; and hydrated ferric oxide (Fe(OH)₃·3H₂O) occupies up to 6.4 times the original iron volume. Most naturally occurring rust deposits contain a mixture of these compounds, yielding an average expansion ratio of 3.5 to 4.5.
Carbonation — the reaction of atmospheric CO₂ with calcium hydroxide in the concrete pore solution to form calcium carbonate (CaCO₃) — reduces the pH of the concrete from above 12.5 to below 9.0. At this reduced alkalinity, the passive film is no longer stable, and general corrosion can initiate even in the absence of chlorides. Carbonation proceeds at a rate proportional to the square root of time, typically advancing 1 to 5 mm per year in normal-quality concrete and 0.5 to 1 mm per year in high-quality, low-permeability concrete. Carbonation-induced delamination is less common than chloride-induced delamination in bridge decks but becomes significant in older structures, parking garages, and buildings where chloride exposure is limited but carbonation has had decades to penetrate the cover.
Freeze-thaw cycling contributes to delamination through two distinct mechanisms. The first involves water trapped at the interface between the reinforcing steel and the surrounding concrete. Even in the absence of active corrosion, the steel-concrete interface is a zone of increased porosity — the “interfacial transition zone” or ITZ — where bleed water accumulates during concrete placement and hydration. When this trapped moisture freezes, it expands by approximately 9 percent in volume, generating hydraulic pressure that can initiate microcracking along the steel-concrete bond plane. Repeated cycles (50 to 100 per year in northern climates) cause progressive crack growth that evolves into delamination.
The second freeze-thaw mechanism relates to the concrete itself. Non-air-entrained concrete or concrete with an inadequate air-void system (spacing factor greater than 0.2 mm) is susceptible to internal frost damage. When pore water freezes, the expansion combined with the hydraulic pressure generated as water is forced through the pore system can fracture the cement paste. This damage is initially distributed but can coalesce into planar separations, especially in the upper 25 to 50 mm of the concrete surface where moisture saturation is highest. The ASTM C666 standard test method for freeze-thaw resistance evaluates concrete’s susceptibility to this form of deterioration.
A distinct category of delamination originates during construction rather than from in-service deterioration. This type — often called construction delamination or troweling delamination — occurs in freshly placed concrete slabs and pavements when the surface is sealed prematurely by finishing operations. The mechanism, documented in the National Ready Mixed Concrete Association’s CIP 20 (Delamination of Troweled Concrete Surfaces), involves the entrapment of bleed water and air beneath a densified surface layer.
During concrete placement, bleed water rises to the surface as heavier aggregate and cement particles settle. In normal finishing practice, the finisher waits until bleeding has stopped and the bleed water has evaporated before commencing troweling. When troweling begins too early — while bleeding is still active and the underlying concrete remains plastic — the troweling action seals and densifies the surface, trapping the rising bleed water and air in the upper 3 to 10 mm of the slab. This trapped fluid creates a zone of very high water-cement ratio and zero bond strength just below the sealed surface. The result is a thin, dense surface skin 3 to 6 mm thick that is completely separated from the slab body — a classic shallow delamination.
Construction delamination is diagnosed by its characteristic appearance: the delaminated layer is thin and uniform, occurs in patches associated with finishing operations (often concentrated where troweling overlapped or was delayed), and is typically not associated with rebar corrosion or freeze-thaw damage. The sound produced by hammer tapping over construction delamination is hollow but distinctly higher-pitched than corrosion-induced delamination because of the shallower depth and smaller void thickness. This type of delamination typically manifests within the first year of service and may progress to surface scaling or spalling if subjected to traffic and freeze-thaw cycles.
Other construction-related causes include: insufficient consolidation of concrete around reinforcing steel, leaving voids at the rebar-concrete interface; pour line delamination at the interface between successive concrete placements where the first layer had begun to set before the second layer was placed; plastic settlement cracking over rebar, which creates a natural delamination plane when the concrete settles while the rebar restrains it; and overworking the surface during finishing, which brings excess water and fines to the surface and increases the water-cement ratio of the near-surface paste, weakening its bond to the underlying concrete.
Alkali-silica reaction is a chemical deterioration process that can produce delamination-like separations, particularly in concrete with reactive aggregates and high alkali cement. The reaction between alkali hydroxides (Na₂O and K₂O) in the cement paste and reactive forms of silica in certain aggregates produces an expansive alkali-silica gel. This gel absorbs water and swells, generating internal pressures that can cause map cracking, surface popouts, and in advanced stages, delamination. ASR-induced delamination differs from corrosion-induced delamination in that it is typically more randomly distributed rather than aligned with rebar patterns, and is often accompanied by the characteristic gel exudation at cracks and the distinctive cracking pattern radiating from reactive aggregate particles.
Delamination is the precursor condition to spalling — the physical breakout and loss of concrete material from the surface. The relationship between these two defect types is sequential and mechanistic, and understanding this progression is fundamental to bridge deck and pavement management because it defines the window of opportunity for preventive maintenance.
The progression follows a defined sequence. In Stage 1 (Initiation), corrosion begins at the reinforcing steel level but has not yet generated sufficient expansive pressure to crack the concrete. No delamination is detectable by any method. In Stage 2 (Microcracking), radial microcracks propagate outward from the corroding rebar into the surrounding concrete. These cracks are microscopic — typically 0.01 to 0.1 mm in width — and are not detectable by sounding but may be identified by advanced NDT methods such as acoustic emission monitoring or high-resolution impact echo. In Stage 3 (Delamination Formation), the microcracks coalesce into a continuous horizontal fracture plane parallel to the surface. The concrete cover is now physically separated from the underlying concrete but remains in place, held by aggregate interlock along the rough fracture surface and by the bond of uncorroded rebar sections. This stage is detectable by chain drag, hammer sounding, and IR thermography. The fracture plane may be 0.2 to 2 mm wide and may be air-filled or partially filled with corrosion products and moisture. In Stage 4 (Delamination Growth), the delamination expands laterally as corrosion progresses, adjacent microcracks connect, and traffic-induced vibration and flexure fatigue the remaining aggregate interlock bridges. The delaminated patch grows in area, and the residual attachment points weaken. In Stage 5 (Spalling), the delaminated concrete cover, now weakened to the point where aggregate interlock and residual bond can no longer support it, breaks free under the influence of traffic loading, freeze-thaw cycling, or thermal expansion. The concrete cover detaches, exposing the underlying reinforcing steel and creating a surface void with loose debris (FOD).
The critical insight for asset management is the time available between delamination detection and spalling. Research conducted under the FHWA Long-Term Bridge Performance (LTBP) Program indicates that, for typical bridge decks in northern climates, delamination is detectable by sounding for 3 to 7 years before spalling occurs. This window is influenced by traffic loading (heavy truck traffic accelerates the transition), freeze-thaw cycling (northern decks transition faster), cover depth (thinner cover means earlier spalling), and concrete quality (higher-strength concrete with better aggregate interlock retains the delaminated layer longer). During this window, targeted repairs — partial-depth patching or hydrodemolition and overlay — can address the delamination before it becomes spalling, at a cost typically 30 to 50 percent lower than repairing spalled concrete, and without the safety hazard of FOD generation.
The relationship between delamination area and spalling risk follows a threshold pattern. Small, isolated delaminations (less than 0.1 m² or 1 ft²) may remain stable for many years because the perimeter aggregate interlock is sufficient to support the delaminated patch. As the delamination grows beyond approximately 0.2 to 0.3 m² (2 to 3 ft²) , the perimeter-to-area ratio decreases below a critical value, and the probability of spalling within the next 2 years increases sharply. This threshold behavior is incorporated into several state DOT bridge management systems, where delamination maps are analyzed not just for total percentage of deck area affected but for the size distribution of individual delamination patches.
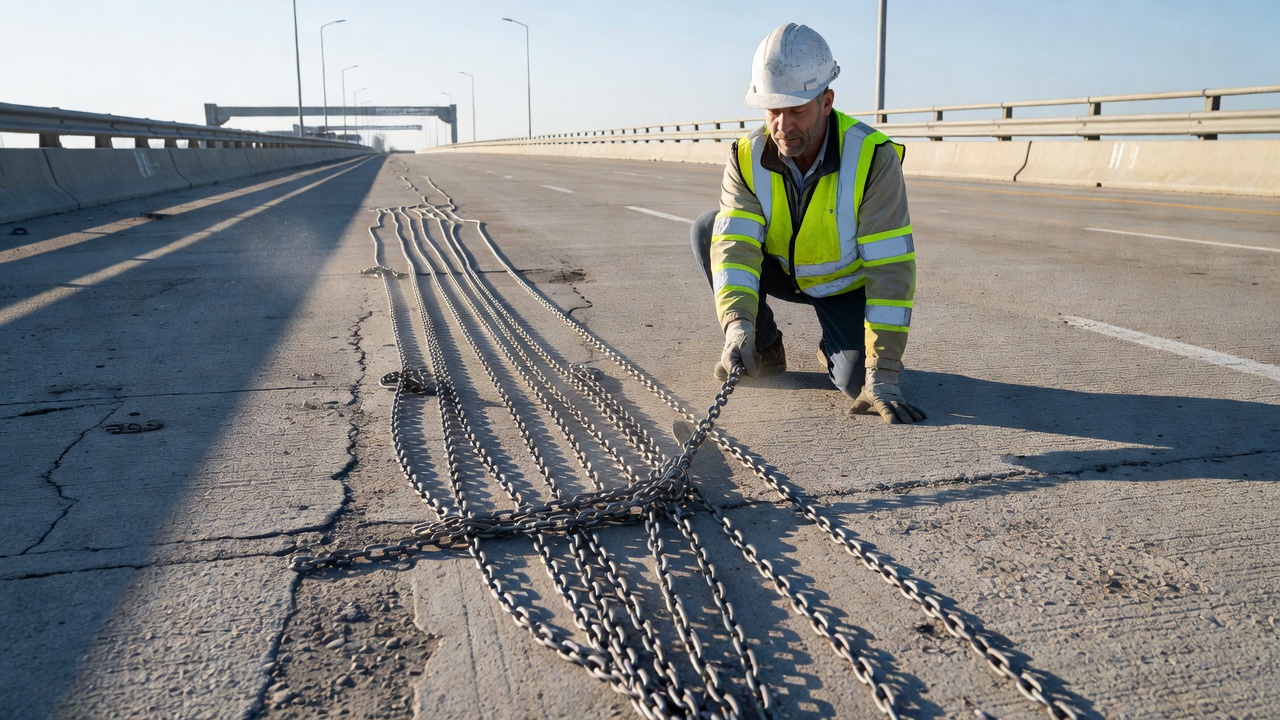
Chain drag is the most widely used traditional method for detecting delamination in concrete bridge decks and is the primary method specified in ASTM D4580/D4580M-23. The technique employs a series of steel chain links or bars — typically four to five segments of chain, each 300 to 450 mm (12 to 18 inches) long — dragged across the concrete surface by an inspector walking at a steady pace. The chains are typically made of 6 to 10 mm (1/4 to 3/8 inch) diameter steel rod links, and the total weight of the drag assembly is approximately 4.5 to 7 kg (10 to 15 lb) to ensure sufficient impact energy.
The operating principle is acoustic: when the chain links strike sound, intact concrete, they produce a clear, sharp, high-frequency ringing sound. When the chain passes over a delaminated area, the impact excites the separated surface layer, which vibrates as a drumhead — producing a distinctly hollow, lower-frequency, dull thudding sound. The acoustic contrast between sound and delaminated concrete is unmistakable. An experienced inspector can identify delamination boundaries to within 50 to 100 mm (2 to 4 inches) by listening to the transition in sound as the chain moves from sound concrete across the delamination perimeter.
Chain drag is limited by several factors. It is effective only for delaminations within approximately 100 mm (4 inches) of the surface — deeper delaminations do not produce a detectable hollow sound because the overlying concrete mass is too stiff to vibrate audibly. It cannot detect delamination beneath asphalt overlays unless the delamination is severe enough to have affected the overlay itself. The method is subjective — different inspectors may interpret borderline sounds differently — though inter-operator variability is reduced through calibration against core samples. Traffic noise on active bridges can mask the acoustic signal, requiring lane closures for effective testing. Chain drag also cannot distinguish between delamination caused by corrosion, freeze-thaw, or construction defects — it identifies only the presence of a subsurface discontinuity, not its cause.
The FHWA InfoTechnology platform documents that chain drag and hammer sounding are mainly used to detect moderate to severe delamination in concrete structures. Early-stage microcracking and very thin delamination separations (less than 0.5 mm gap width) may not produce a detectable acoustic signature. Research by the North Dakota DOT indicates that chain drag reliably detects delamination when the separated layer is at least 0.3 m² (3 ft²) in area and the separation gap is at least 0.5 mm.
ASTM D4580 specifies the chain drag procedure in detail. The bridge deck is divided into a grid of survey units, typically 0.6 m × 0.6 m (2 ft × 2 ft) or 1 m × 1 m. The inspector drags the chain across each grid unit, listening for the characteristic hollow sound. Delaminated areas are marked directly on the deck surface with spray paint or recorded on a grid map. All portions of the deck where delamination is identified are plotted on a scale map, and an outline is drawn showing the areas of delamination. The total delaminated area is calculated as a percentage of the total deck area, providing a single quantitative metric for deck condition assessment that feeds directly into AASHTO bridge element condition state ratings.
Hammer sounding is the manual counterpart to chain drag, using a hand-held hammer — typically a 450 to 680 g (16 to 24 oz) ball-peen or geologist’s hammer — to strike the concrete surface at closely spaced intervals. The inspector taps the surface in a grid pattern at approximately 150 to 300 mm (6 to 12 inch) spacing, listening for the characteristic hollow sound that indicates delamination. Hammer sounding is slower than chain drag but offers greater precision in mapping delamination boundaries and is practical in confined areas — around bridge railings, expansion joints, scuppers, and embedded hardware — where chain drag cannot be maneuvered.
Hammer sounding provides more detailed information than chain drag. By varying the impact force and listening carefully, an experienced inspector can estimate the depth of delamination (shallower delaminations produce a higher-pitched hollow sound) and gauge the severity (a completely detached layer produces a dead, unresonant sound, while a partially attached layer produces an intermediate tone). The hammer tap also provides tactile feedback: a dead, unresonant impact feel accompanies the hollow sound over severe delamination.
Both chain drag and hammer sounding remain in widespread use because they require no specialized equipment, no calibration, no power source, and minimal training. An inspector can cover approximately 2,000 to 3,000 m² (20,000 to 30,000 ft²) per day using chain drag on a bridge deck with lane closures in place. The primary disadvantages — subjectivity, inability to detect early-stage delamination, and the requirement for lane closures on active bridges — have driven the development of the NDT methods described in the following section.
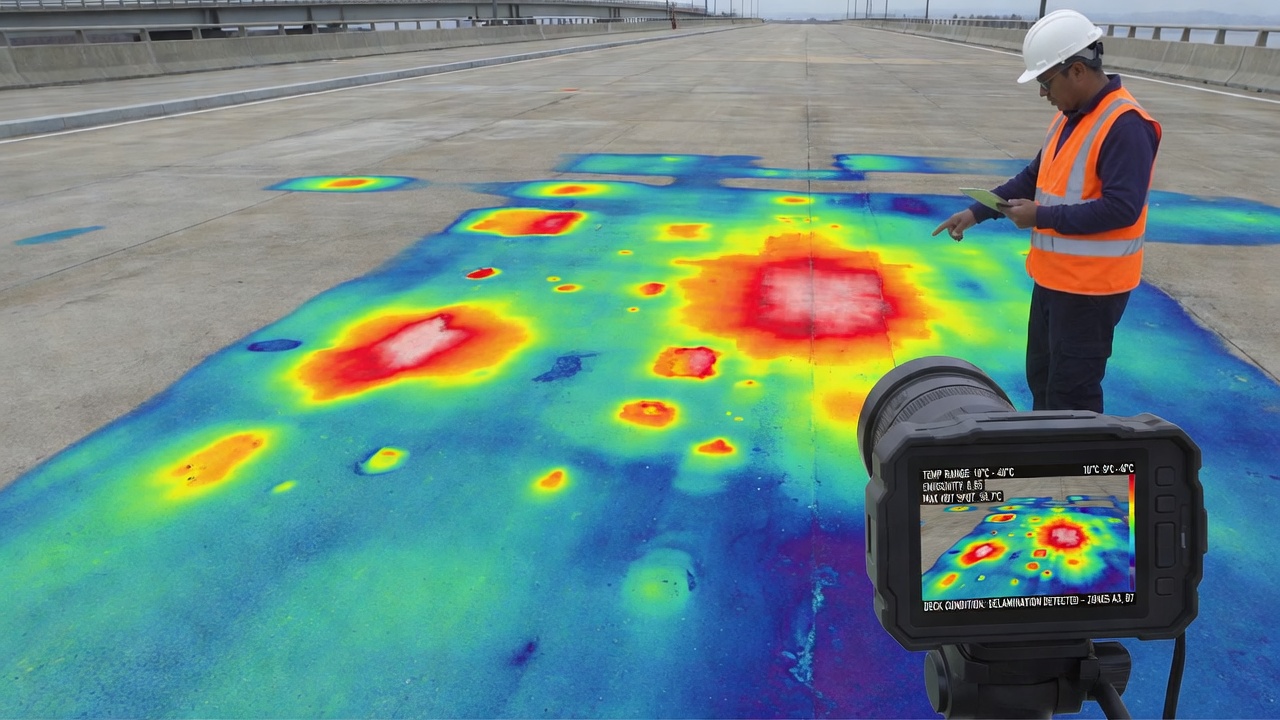
Infrared thermography (IRT) exploits the thermal properties of delaminated concrete to produce a visual map of subsurface discontinuities without physical contact with the deck surface. The physical principle is straightforward: the air-filled or moisture-filled gap created by delamination acts as a thermal barrier that alters the rate of heat transfer through the concrete. During solar heating, the thin concrete layer above a shallow delamination heats up more rapidly than adjacent sound concrete because the air gap prevents the absorbed heat from conducting into the deeper concrete mass. During cooling, the same thin layer cools more quickly. A high-resolution infrared camera captures these differential surface temperatures — typically 0.5°C to 3.0°C (1°F to 5°F) — and renders them as a thermal image in which delaminated areas appear as distinct thermal anomalies.
The standard for IR thermography of bridge decks is ASTM D4788 (Standard Test Method for Detecting Delaminations in Bridge Decks Using Infrared Thermography). The standard specifies the conditions under which IRT is effective: the deck surface must be dry (moisture masks thermal signatures), the solar heating rate must be sufficient to generate thermal contrast (at least 300 W/m² of solar radiation is typically required), the survey should be conducted during the mid-morning heating phase (approximately 9 AM to 12 PM) or evening cooling phase when the rate of temperature change is at its maximum, and the deck surface must be free of debris, standing water, and loose material that could produce false thermal anomalies.
IRT systems for bridge deck inspection are typically vehicle-mounted, with the infrared camera mounted on a boom extending forward or to the side of a survey vehicle traveling at 5 to 15 km/h (3 to 10 mph). This allows a full lane-width survey without lane closures behind the vehicle. Modern IRT cameras offer thermal sensitivity (NETD — Noise Equivalent Temperature Difference) of 0.025°C to 0.05°C and spatial resolution of 640 × 480 pixels or higher, enabling detection of delaminations as small as 0.1 m² (1 ft²) at vehicle-mounted standoff distances.
The advantages of IRT include: non-contact operation (no lane closures required behind the survey vehicle); rapid coverage (up to 10,000 m² per hour, compared to 500 m² per hour for chain drag); digital data output suitable for automated analysis and GIS integration; and permanent, objective thermal image records for baseline comparison and deterioration tracking over time. Limitations include: sensitivity to weather conditions (cloud cover, recent rain, or high wind can suppress thermal contrast); inability to detect delamination under asphalt overlays thicker than approximately 50 mm (2 inches); detection depth limited to approximately 75 mm (3 inches) for reliable results; and susceptibility to false positives from surface discoloration, debris, pavement markings, and moisture variations that create thermal signatures mimicking delamination.
Research published in Construction and Building Materials (Omar et al., 2017) compared IRT with chain drag on bridge decks and found overall agreement of 80 to 90 percent for delaminations larger than 0.3 m², with IRT detecting some delaminations missed by chain drag (early-stage with gap width less than 0.5 mm) and chain drag detecting some missed by IRT (deep delaminations or those under surface staining). The complementary nature of the two methods has led many transportation agencies to use IRT for rapid screening followed by targeted chain drag or hammer sounding in areas flagged by thermal anomalies.
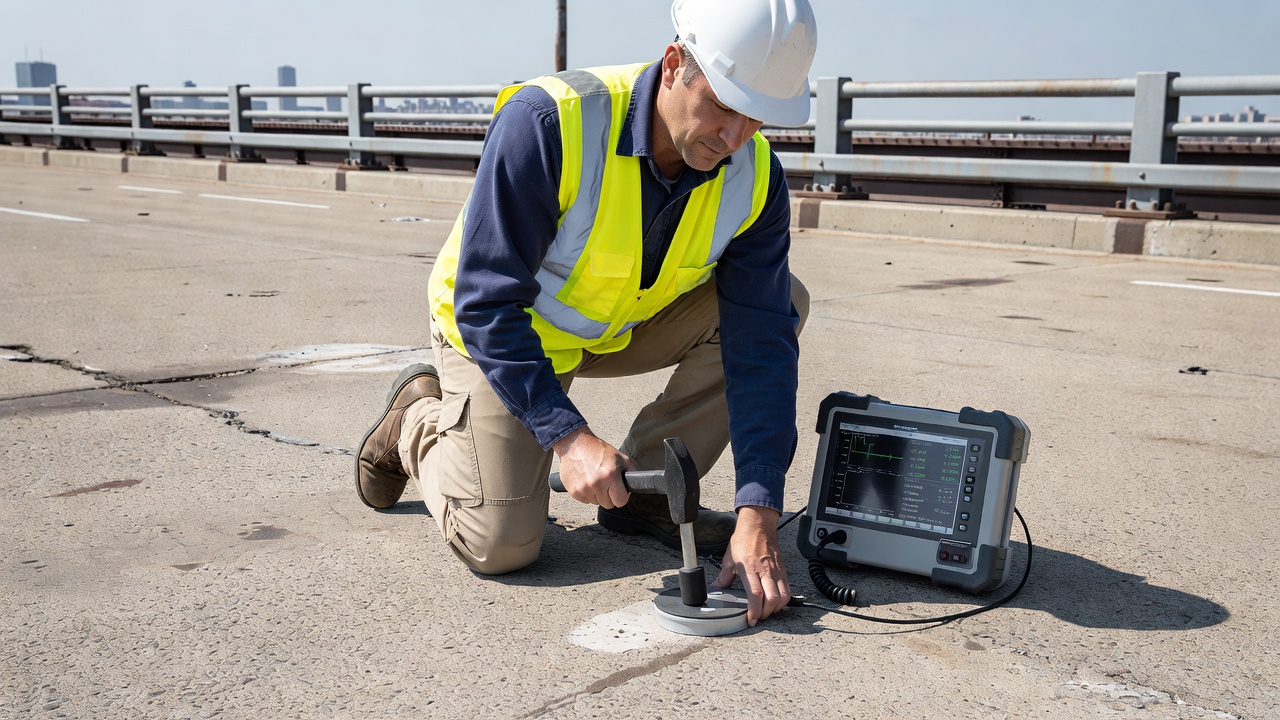
Impact echo (IE) is a stress-wave-based NDT method that detects internal defects by analyzing the frequency spectrum of acoustic waves reflected from internal boundaries within the concrete. The method is standardized in ASTM C1383 (Standard Test Method for Measuring the P-Wave Speed and the Thickness of Concrete Plates Using the Impact-Echo Method). In IE testing, a short-duration mechanical impact — typically from a 3 to 15 mm diameter steel ball on a spring-loaded impactor — is applied to the concrete surface. The impact generates a pulse of compressional (P) and shear (S) stress waves that propagate into the concrete. These waves reflect from internal boundaries — the bottom of the slab, or a delamination — and return to the surface, where a high-fidelity piezoelectric displacement transducer records the surface displacement history.
The recorded time-domain signal is transformed to the frequency domain using the Fast Fourier Transform (FFT). In sound concrete of known thickness, the frequency spectrum shows a dominant peak at the thickness frequency: f = Cₚ / (2T), where Cₚ is the P-wave velocity in concrete (typically 3,500 to 4,500 m/s) and T is the slab thickness. For a 200 mm (8 inch) thick bridge deck, the thickness frequency is approximately 8 to 11 kHz. When a delamination is present, the flexural vibration of the thin delaminated layer generates a low-frequency peak in the 2 to 6 kHz range — substantially lower than the thickness frequency — that is diagnostic of the delamination. The depth of the delamination can be estimated from the frequency using the same relationship, substituting the delamination depth for T.
Impact echo offers several advantages over acoustic sounding: it can detect delaminations at greater depths (up to 500 mm in favorable conditions); it can detect delaminations at early stages before they produce an audible hollow sound; it provides depth information and can distinguish between shallow delamination and deep delamination; and it produces quantitative frequency data amenable to automated signal processing. The primary limitations are: point-by-point testing is slower than chain drag or vehicle-based IRT; the method requires experienced interpretation of frequency spectra; it cannot be used on asphalt-overlaid decks because the asphalt damps the high-frequency stress waves; and surface roughness or irregularities can cause poor transducer coupling and signal degradation.
Research at Western Michigan University demonstrated that impact echo reliably detects delaminations in concrete bridge decks with an accuracy of 85 to 95 percent when compared with cores and visual confirmation after hydrodemolition. IE is particularly effective at detecting delaminations that are too deep to sound but too shallow to ignore in structural assessment — typically those in the 75 to 150 mm (3 to 6 inch) depth range.
Ground penetrating radar (GPR) detects delamination indirectly by identifying the conditions associated with active corrosion — primarily elevated moisture, chloride concentration, and the presence of corrosion products at the rebar level. GPR operates by transmitting short pulses of electromagnetic energy (typically 1.0 to 2.6 GHz center frequency for bridge deck applications) into the concrete from an air-coupled or ground-coupled antenna. The pulses reflect from interfaces where the dielectric properties of the material change — the concrete surface, reinforcing steel, the bottom of the deck, and areas of high moisture or chloride concentration.
For delamination assessment, the primary GPR indicator is signal attenuation at the top reinforcing steel. Sound, dry concrete is relatively transparent to GPR signals at 1.5 to 2.0 GHz, and the rebar mat produces strong, well-defined hyperbolic reflections. When corrosion is active, the associated moisture and dissolved chloride ions increase the electrical conductivity of the concrete surrounding the rebar. This increased conductivity attenuates the GPR signal, reducing the amplitude of the rebar reflection. Severely corroded areas may show no visible rebar reflection at all. By mapping the variation in rebar reflection amplitude across the deck, GPR produces a condition map that correlates with areas of active corrosion and, by inference, areas where delamination is developing.
The FHWA InfoTechnology platform recommends using GPR in combination with other methods — for example, impact echo or chain drag data can establish delamination thresholds against which GPR attenuation thresholds are calibrated, or electrical resistivity data can establish chloride contamination thresholds. GPR offers the advantage of vehicle-mounted, traffic-speed operation (up to 80 km/h or 50 mph with air-coupled horn antennas), enabling network-level bridge deck screening without lane closures, and data collection on asphalt-overlaid decks where other NDT methods fail. Limitations include: detection is indirect (GPR detects the corrosion environment, not the delamination itself); signal penetration is limited in wet concrete or concrete with high chloride content; dense reinforcing mats can mask deeper signals; and interpretation requires significant expertise and often ground-truth calibration with cores or other NDT results.
Half-cell potential testing, standardized in ASTM C876 (Standard Test Method for Corrosion Potentials of Uncoated Reinforcing Steel in Concrete), measures the electrical potential difference between the reinforcing steel and a reference electrode (typically copper/copper sulfate, Cu/CuSO₄) placed on the concrete surface. The measured potential indicates the thermodynamic probability that active corrosion is occurring at the rebar level. Potentials more negative than -350 mV (vs. Cu/CuSO₄) indicate a greater than 90 percent probability of active corrosion; potentials between -200 mV and -350 mV indicate uncertain corrosion activity; potentials less negative than -200 mV indicate a greater than 90 percent probability of no corrosion.
Half-cell potential maps provide a direct indicator of where corrosion is active and, by extension, where delamination is likely to form or has already formed. The method does not detect delamination directly but identifies the corrosion cells that drive delamination formation. It is typically used in conjunction with chain drag, IE, or GPR to provide a comprehensive bridge deck condition picture. ASTM C876 requires electrical continuity between all reinforcing bars in the test area and connection to the bars at an exposed location — a practical limitation on decks without accessible rebar.
The integration of unmanned aerial vehicles (drones), high-resolution imaging, and artificial intelligence represents the most rapidly evolving frontier in delamination detection. These technologies address the fundamental limitations of traditional inspection: the need for lane closures, inspector exposure to traffic hazards, subjective data interpretation, and the inability to efficiently inspect large-area airport pavements where lane closures are operationally impractical.
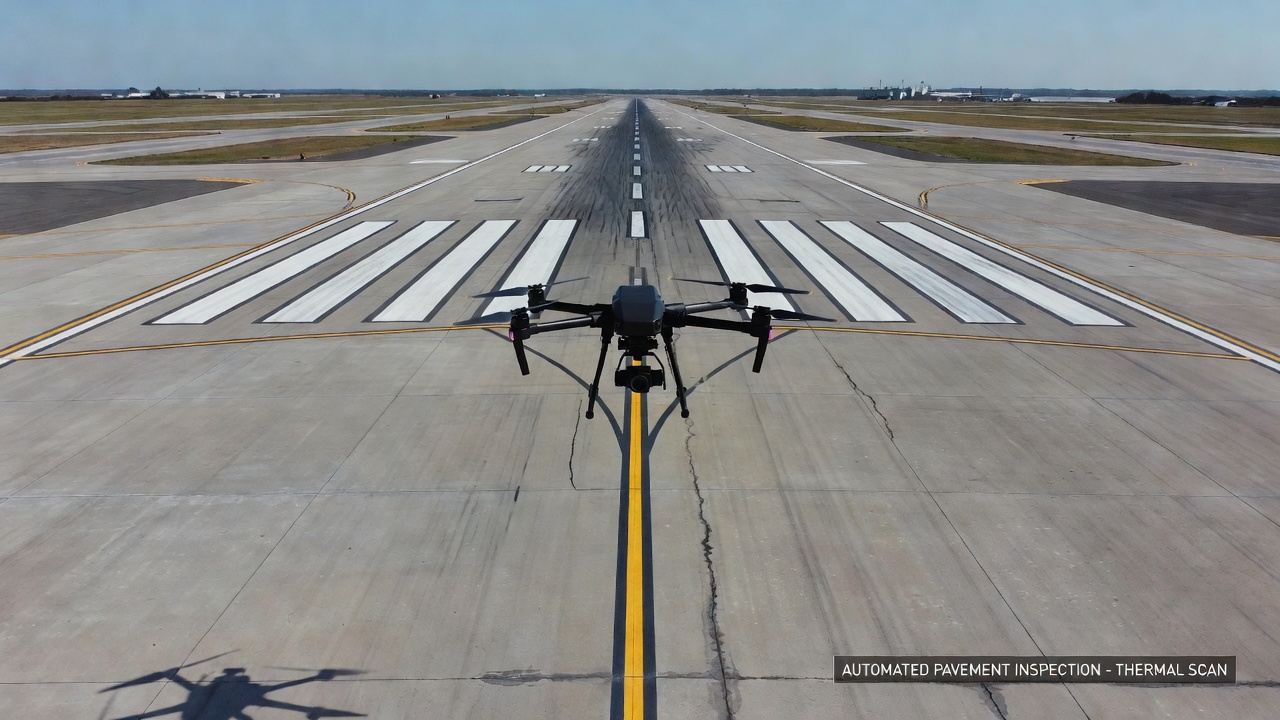
Drone-mounted thermal imaging combines the mobility and overhead perspective of a UAV with a lightweight thermal camera payload (typically an uncooled microbolometer sensor with 640 × 512 resolution, weighing under 500 g). The drone flies a pre-programmed grid pattern at an altitude of 10 to 30 m above the pavement surface, capturing overlapping thermal images at a frame rate of 1 to 2 Hz. The resulting imagery is stitched into an orthorectified thermal mosaic covering the entire deck or runway surface. Delamination appears as thermal anomalies in the mosaic, analogous to vehicle-mounted IRT but with the benefit of full-area coverage, no traffic disruption, and the ability to capture the entire surface within a single diurnal heating cycle.
Drone-based thermal surveys are particularly well-suited to airport pavement inspection, where the large area (a typical commercial runway is 3,000 to 4,000 m long and 45 to 60 m wide, yielding 135,000 to 240,000 m² of surface to inspect), stringent access restrictions, and limited inspection windows during active operations make traditional ground-based methods extremely challenging. A drone survey can cover an entire runway in 2 to 4 flight hours during a single night or early morning closure window, producing a full thermal map that can be analyzed in the following days without additional runway access.
Convolutional neural networks (CNNs) and deep learning algorithms have been applied to automated delamination detection from both GPR data and thermal imagery. Researchers at the University of Delaware have developed deep learning models trained on thousands of labeled thermal and GPR images that can identify delamination patterns with accuracy rates of 85 to 92 percent when compared against ground-truth cores and chain drag maps. A 2024 study published in Case Studies in Construction Materials demonstrated a one-dimensional convolutional neural network approach to automated delamination detection in GPR data, achieving detection rates exceeding 90 percent for delaminations larger than 0.2 m².
The Benesch engineering firm has deployed a production system combining drones, AI, and digital twin technology that reduces pavement inspection time by 75 percent compared to traditional manual methods. Their system uses high-resolution optical and thermal imagery captured by drone to feed AI algorithms that automatically detect, classify, and geolocate cracks, delamination, spalling, and other pavement distresses. The results populate a digital twin of the pavement that tracks deterioration over time and prioritizes repairs.
The FAA’s Airport Technology Research & Development Branch has explored dashcam-enabled deep learning for airport runway distress detection, with the objective of equipping airport operations vehicles with cameras that continuously scan pavements during routine operations, applying onboard AI to detect developing defects — including the subtle surface distortions that sometimes accompany underlying delamination — without dedicated inspection sorties.
The primary limitations of AI/drone approaches include: regulatory restrictions on drone operations at airports (requiring coordination with air traffic control and NOTAM issuance); sensitivity to weather (wind, precipitation, and low light affect both drone flight safety and thermal image quality); the black-box nature of some AI models, which can make it difficult to explain or verify individual detections; and the dependency on high-quality ground-truth data for model training, which requires traditional inspection data to bootstrap the AI system.
Delamination severity is classified within the broader framework of bridge deck condition assessment, which integrates delamination extent with other distress indicators to assign condition ratings and prioritize repairs. The primary classification systems are the AASHTO Bridge Element Inspection system and the FHWA National Bridge Inventory (NBI) condition rating system.
AASHTO Bridge Element 12 (Reinforced Concrete Deck) defines four condition states based on the extent and severity of deterioration:
| Condition State | Description | Delamination and Spalling Criteria |
|---|---|---|
| CS 1 (Good) | No deterioration | No delaminations or spalls present |
| CS 2 (Fair) | Minor deterioration | Delaminations or spalls present but no exposed rebar; delamination/spall area less than 2% of total deck area |
| CS 3 (Poor) | Moderate deterioration | Delaminations or spalls present with or without exposed rebar; rebar section loss less than 10%; delamination/spall area between 2% and 10% of total deck area |
| CS 4 (Severe) | Severe deterioration | Extensive delaminations and spalls with exposed rebar; significant section loss; delamination/spall area exceeds 10% of total deck area; structural integrity compromised |
The NBI uses a 0–9 numerical scale for deck condition rating:
| NBI Rating | Condition | Typical Delamination Condition |
|---|---|---|
| 9 | Excellent | No delaminations |
| 8 | Very Good | No delaminations |
| 7 | Good | Isolated, very small delaminations (<0.1 m² each); less than 0.5% of deck area |
| 6 | Satisfactory | Minor delaminations; 0.5% to 2% of deck area; no exposed rebar |
| 5 | Fair | Delaminations 2% to 10% of deck area; some exposed rebar; section loss minimal |
| 4 | Poor | Delaminations 10% to 25% of deck area; widespread exposed rebar; significant section loss |
| 3 | Serious | Delaminations > 25% of deck area; severe deterioration; structural capacity affected |
| 2 | Critical | Extensive deterioration; deck structural integrity compromised |
| 1 | Imminent Failure | Major structural deterioration; closure required |
| 0 | Failed | Out of service; beyond corrective action |
The percentage of deck area delaminated is directly used in these classification systems. A bridge deck with more than 2 percent delaminated area typically triggers a transition from Condition State 1/2 to Condition State 2/3 and from NBI 7 to NBI 6. A deck exceeding 10 percent delaminated area triggers the transition to Condition State 4 and NBI 4 (Poor), which typically activates rehabilitation planning — including structural overlays, hydrodemolition and replacement, or full deck replacement.
The decision framework for delamination repair follows a systematic approach:
Delamination < 2 percent of deck area, no exposed rebar: No immediate repair required. Continue monitoring through routine inspection. Apply deck sealing or low-permeability overlay to slow chloride ingress and corrosion rate. Schedule re-inspection within 2 to 3 years.
Delamination 2 to 10 percent of deck area, isolated exposed rebar: Targeted partial-depth repairs for individual delamination patches. Remove unsound concrete by chipping or hydrodemolition to a minimum depth of 25 mm (1 inch) below the rebar. Clean and coat exposed rebar. Place polymer-modified repair mortar or silica fume concrete. Apply penetrating sealer or thin polymer overlay to the entire deck surface to slow ongoing chloride ingress. Re-inspect within 2 years.
Delamination 10 to 25 percent of deck area, widespread exposed rebar with section loss: Major rehabilitation required. Options include: hydrodemolition of the entire deck surface to below the top rebar mat, followed by a dense concrete or latex-modified concrete overlay (minimum 50 mm or 2 inches thick); cathodic protection system installation to arrest ongoing corrosion; or structural overlay with waterproofing membrane to isolate the deck from further moisture and chloride exposure. Full-depth deck replacement becomes cost-competitive in this range, particularly if the deck has other structural deficiencies.
Delamination > 25 percent of deck area, significant section loss, structural concerns: Full deck replacement is typically the recommended course. The deck concrete is completely removed, the structural steel or concrete girders are inspected and repaired as necessary, new reinforcing is placed, and new concrete is cast. For bridges where deck replacement is programmed but not yet funded, interim measures include posting of load restrictions and increased inspection frequency (annually or semi-annually).
The typical cost escalation ratio is approximately 1:3:10. That is, if the cost of sealing a sound deck to prevent chloride ingress is taken as 1 unit, the cost of partial-depth repairs for moderate delamination is approximately 3 units, and the cost of full deck replacement for extensive delamination is approximately 10 units. This cost multiplier — $10 for every $1 that could have been spent on prevention — is the core economic argument driving preventive maintenance programs in bridge management.
Delamination in airport concrete pavements — runways, taxiways, aprons, and hardstands — presents unique challenges that distinguish it from bridge deck delamination. While the fundamental mechanics are identical (corrosion-induced expansion creating horizontal fracture planes), the operational context, geometry, and consequence profile are different enough to warrant dedicated consideration.
Airport concrete pavements differ from bridge decks in several ways that affect delamination behavior and management. Thickness: Airport runway and taxiway concrete slabs are typically 300 to 500 mm (12 to 20 inches) thick — substantially thicker than a 200 to 250 mm (8 to 10 inch) bridge deck. The top reinforcing mat in an airport pavement is typically at 75 to 100 mm (3 to 4 inches) depth, compared to 50 to 65 mm (2 to 2.5 inches) for a bridge deck. This greater cover depth delays chloride penetration and corrosion initiation but also makes delamination deeper, reducing the sensitivity of acoustic sounding methods.
Joint configuration: Airport pavements are jointed plain concrete pavement (JPCP), with transverse contraction joints spaced at 4.5 to 7.5 m (15 to 25 ft) intervals per FAA AC 150/5320-6G. Each joint is a potential entry point for moisture, de-icing chemicals, and incompressible materials. Joint deterioration and delamination are closely linked — water entering through failed joint seals accelerates rebar corrosion at the slab edge, where delamination often initiates.
De-icing exposure: Airport pavements are exposed to aircraft de-icing fluids (Type I: heated glycol; Type IV: thickened glycol), runway de-icing chemicals (potassium acetate, sodium formate, urea), and in some locations, chloride-based de-icers. Potassium acetate and sodium formate de-icers, while non-corrosive to steel in theory, have been associated with accelerated deterioration of concrete through a different mechanism: the chemical reaction with calcium hydroxide in the cement paste, which can cause surface softening and increase porosity, accelerating chloride penetration to the rebar level. The FAA has issued guidance (CertAlert 09-03) regarding the potential for potassium acetate de-icers to accelerate carbonation and corrosion in concrete pavements, particularly in areas with marginal cover depth.
FOD consequence: The foreign object debris risk from delamination-induced spalling on runways carries consequences far exceeding those on highways. A single concrete fragment from a spall can cause catastrophic engine damage if ingested during takeoff, resulting in aircraft loss. For this reason, airport pavement management places extreme emphasis on detecting and repairing delamination before spalling occurs. The PAVER/ASTM D5340 PCI system used for airport pavement condition assessment incorporates delamination indirectly through its joint spalling and corner spalling distress categories — the surface manifestations of underlying delamination — rather than recording delamination as a separate distress type.
Inspection access to runways is severely constrained. A typical commercial airport runway is available for inspection during limited overnight closure windows, often 4 to 6 hours between the last arrival and first departure. Manual chain drag or hammer sounding of an entire runway is impractical within these windows — a 3,000 m × 60 m runway represents 180,000 m² of surface, requiring approximately 60 inspector-hours with chain drag. Vehicle-mounted IRT platforms can survey the same area in 3 to 4 hours, making them operationally feasible within a single closure window.
The deeper rebar cover in airport pavements (75–100 mm vs. 50–65 mm) reduces IRT sensitivity because the thermal signal from a delamination at 75+ mm depth is attenuated and spread by lateral heat conduction, reducing the thermal contrast at the surface. IRT remains effective but requires more favorable conditions — stronger solar heating, lower wind speeds, and careful timing — to detect delaminations at the greater depth typical of airport pavements. GPR is unaffected by depth within the ranges encountered and is increasingly used for airport pavement condition assessment.
Drone-based thermal and optical surveys offer the most promising approach for airport delamination screening because they can operate within the tight access windows, cover the full pavement area, and do not require vehicle access to the runway surface (drones can operate from the runway shoulder or adjacent taxiways).
Partial-depth repair — the standard treatment for isolated delamination — in airport pavements must account for the high tire pressures and dynamic loads imposed by aircraft operations. Aircraft tire inflation pressures for commercial transports range from 1,200 to 1,550 kPa (175 to 225 psi) for narrow-body aircraft and up to 1,550 kPa (225 psi) for wide-body aircraft. These pressures are substantially higher than highway truck tire pressures (600 to 830 kPa or 90 to 120 psi) and impose higher near-surface compressive and shear stresses on repair patches. Repair materials for airport pavement delamination must therefore have high early compressive strength, excellent bond to the substrate concrete, and low shrinkage to maintain bond integrity under aircraft loading.
The FAA AC 150/5380-6C (Guidelines and Procedures for Maintenance of Airport Pavements) provides detailed repair procedures for concrete pavement distress including joint spalling and surface defects — the surface manifestations of delamination. The standard partial-depth spall repair detailed in AC 150/5380-6C Appendix A8 — with vertical saw cuts 50 mm (2 inches) deep extending 75 mm (3 inches) beyond the delamination boundary, removal of unsound concrete to sound substrate, and placement of high-early-strength repair material — applies equally to delamination repair, with the additional requirement that the repair must extend through the delamination to sound concrete below the fracture plane.
For delamination directly caused by rebar corrosion, AC 150/5380-6C emphasizes that all corroded steel must be exposed, cleaned (sandblasted or wire-brushed to bare metal), coated (typically with zinc-rich primer or epoxy coating), and in cases of significant section loss (greater than 10 percent of cross-sectional area), the affected bar segment must be replaced with new reinforcing spliced to the existing bar in accordance with ACI 318 splice length requirements. If corrosion extends along the bar beyond the delamination boundary, the repair must be extended to encompass the full corrosion-affected length.
The operational constraint on airport pavement repair is time. Runway repairs must be completed within the available closure window or risk significant operational disruption. This has driven the development of rapid-setting repair materials — magnesium phosphate cement (working time approximately 10 minutes, traffic-ready in 1 to 2 hours), calcium sulfoaluminate cement, and proprietary polymer-modified rapid-setting concretes that achieve the required compressive strength (typically 20 MPa or 3,000 psi minimum before opening to traffic) within 2 to 4 hours of placement.
For comprehensive airport pavement management, delamination assessment should be integrated into the PCI survey cycle. While PCI methodology (ASTM D5340) does not record delamination as a separate distress, the presence and extent of joint spalling and corner spalling — which are recorded — can serve as a proxy for underlying delamination extent. A pavement section with high levels of medium and high-severity joint spalling (Distress Code 74) and corner spalling (Distress Code 75) should be investigated with NDT methods (GPR, IE, or IRT) to determine whether active delamination extends beyond the visible spall boundaries, indicating a need for larger-scale rehabilitation rather than individual spall repairs.
| Method | Detection Principle | Minimum Delamination Size | Depth Range | Survey Rate | Primary Limitations |
|---|---|---|---|---|---|
| Chain Drag (ASTM D4580) | Acoustic resonance of separated layer | 0.3 m² | < 100 mm | 2,000–3,000 m²/day | Subjective; lane closure required; cannot detect early-stage delamination |
| Hammer Sounding (ASTM D4580) | Acoustic resonance of separated layer | 0.1 m² | < 100 mm | 500–1,000 m²/day | Slow; subjective; lane closure required |
| Infrared Thermography (ASTM D4788) | Thermal discontinuity from air-gap insulation | 0.1 m² | < 75 mm | 10,000 m²/hour | Weather-dependent; depth-limited; false positives from surface conditions |
| Impact Echo (ASTM C1383) | Low-frequency flexural mode of delaminated layer | 0.1 m² | < 500 mm | 100–500 test points/day | Point-by-point; cannot be used on asphalt overlays; requires expert interpretation |
| GPR | Signal attenuation from moisture/chlorides at rebar level | Indirect (detects corrosion environment) | Any | Up to 30,000 m²/hour at traffic speed | Indirect detection; dense rebar masks signals; requires ground-truth calibration |
| Half-Cell Potential (ASTM C876) | Electrochemical potential indicating active corrosion | Indirect (detects corrosion activity) | Any | 500–1,000 m²/day | Requires electrical connectivity to rebar; detects corrosion probability, not delamination |
| Drone + Thermal + AI | Thermal anomaly detection with automated classification | 0.1–0.2 m² | < 75 mm | Full runway in 2–4 hours | Regulatory constraints at airports; weather-dependent; AI model training data required |
Identify subsurface delamination in bridge decks and runways with TarmacView's AI-powered inspection platform — before spalling creates FOD hazards or structural failures.
Debonding is defined as the loss of adhesion at the interface between a concrete overlay or repair material and the existing concrete substrate, or between an e...
Exposed rebar is a critical structural defect where reinforcing steel becomes visible at the concrete surface due to spalling, delamination, or insufficient cov...
Joint spalling is the cracking, breaking, or chipping of concrete slab edges at transverse or longitudinal joints in PCC pavements. It occurs when incompressibl...