A digital twin is a real-time, data-connected virtual representation of a physical infrastructure asset that synchronizes sensor data, inspection records, and engineering models to enable simulation, monitoring, and predictive analytics. For bridges, runways, and buildings, digital twins integrate drone surveys, NDT data, SHM sensor feeds, and maintenance history into a living digital model.
Digital Twin for Infrastructure Asset Management
Definition and Key Characteristics
A digital twin is a dynamic virtual representation of a physical asset, system, or process that is continuously updated with real-time data from sensors, inspections, and operational systems. Unlike a static 3D model or a one-time simulation, a digital twin maintains a persistent, bidirectional connection with its physical counterpart throughout the asset lifecycle. For infrastructure applications — bridges, runways, airport pavements, tunnels, dams, and buildings — the digital twin serves as the single source of truth for condition assessment, performance monitoring, and decision support.
The concept was first formalized by Dr. Michael Grieves at the University of Michigan in 2002 under the name “Mirrored Spaces Model” and later adopted by NASA and the US Air Force for aerospace vehicle lifecycle management. The term “digital twin” gained widespread industry adoption after General Electric and Siemens applied the concept to industrial equipment monitoring and predictive maintenance. Today, the global digital twin market is valued at approximately USD 29–39 billion in 2025 and is projected to reach between USD 169 billion and USD 224 billion by 2030–2034, representing a compound annual growth rate (CAGR) of 35–40%.
The five defining characteristics of an infrastructure digital twin are:
Connectivity. The digital twin is continuously connected to its physical asset through a network of IoT sensors, data acquisition systems, and communication protocols. This connectivity enables real-time or near-real-time data synchronization, with latency requirements ranging from milliseconds for dynamic structural monitoring to hours or days for periodic inspection data updates. The communication layer typically uses OPC-UA, MQTT, or REST APIs for industrial IoT integration, while inspection data may be uploaded through web portals or automated data pipelines.
Fidelity. The digital twin represents the physical asset with sufficient geometric, semantic, and behavioral accuracy to support its intended use cases. Geometric fidelity is achieved through laser scanning (LiDAR), photogrammetry, and BIM integration at resolutions ranging from 1 mm for crack detection to 10 cm for overall asset geometry. Semantic fidelity means each element in the digital twin is tagged with its asset type, material properties, condition state, maintenance history, and relationship to other elements. Behavioral fidelity means the digital twin can simulate how the asset responds to loads, environmental conditions, and degradation processes using physics-based models, data-driven models, or hybrid approaches.
Liveness. The digital twin evolves with its physical asset. As the asset ages, undergoes maintenance, experiences loading, and deteriorates, the digital twin is updated to reflect these changes. This liveness distinguishes a digital twin from a static as-built model or a one-time simulation. Liveness requires continuous data ingestion, automated data processing pipelines, and version control for model states. The digital twin maintains a complete time-series history of all sensor measurements, inspection findings, maintenance actions, and model updates, enabling temporal analysis and trend identification.
Interoperability. The digital twin integrates data from multiple heterogeneous sources — IoT sensors, SHM systems, drone surveys, NDT equipment, maintenance management systems, GIS databases, and BIM authoring tools. Interoperability is achieved through standardized data schemas including Industry Foundation Classes (IFC, ISO 16739) for building element definitions, CityGML (ISO 19136) for urban-scale models, SensorML for sensor metadata, and the Asset Administration Shell (AAS) from Industry 4.0 for asset lifecycle data. The ISO 23247 family of standards provides a reference architecture for digital twin systems, defining observable manufacturing elements, device communication entities, digital twin entities, and user entities within a standardized framework.
Actionability. The digital twin does not merely observe — it informs decisions. By combining real-time monitoring with predictive analytics, simulation, and what-if analysis, the digital twin generates actionable insights that trigger maintenance workflows, optimize operational parameters, and support capital planning decisions. Actionability requires integration with enterprise asset management (EAM) systems, computerized maintenance management systems (CMMS), and work order management platforms so that insights from the digital twin are automatically translated into maintenance actions, inspection schedules, or engineering assessments.
Digital Twin vs BIM vs GIS
Understanding how digital twins relate to Building Information Modeling (BIM) and Geographic Information Systems (GIS) is essential for infrastructure professionals. These three technologies overlap but serve distinct purposes and operate at different scales.
Digital Twin vs BIM
Building Information Modeling (BIM) is a process for creating and managing information about a construction asset throughout its design, construction, and operation phases. A BIM model is a structured 3D representation of an asset physical and functional characteristics, organized according to standardized element taxonomies and data schemas. BIM is primarily a design and construction tool, though it increasingly supports facility management.
A digital twin extends BIM in three critical dimensions:
Dimension
BIM
Digital Twin
Data source
Author-driven (designed, as-built)
Sensor-driven (real-time operational data)
Temporal scope
Static snapshots (design, construction)
Continuous lifecycle (real-time through end-of-life)
A practical example: a BIM model of a bridge contains the geometry of each girder, deck section, bearing, and joint, along with material specifications and design loads. A digital twin of the same bridge contains all BIM data plus real-time strain gauge readings from critical girders, accelerometer data from seismic events, corrosion sensor trends from the deck, ultrasonic thickness measurements from quarterly inspections, drone imagery of surface cracks from monthly surveys, and traffic loading data from weigh-in-motion sensors. The digital twin can simulate the effect of an overloaded truck crossing the bridge, predict the remaining fatigue life of critical welds, and recommend inspection intervals based on actual loading history.
BIM structured using Industry Foundation Classes (IFC) provides the foundational element hierarchy that the digital twin uses for spatial referencing. When BIM geometry is enriched with live sensor data, inspection results, and maintenance records, it transitions from a static information model to a living digital twin.
Digital Twin vs GIS
Geographic Information Systems (GIS) provide spatial data management, mapping, and analysis at urban, regional, and national scales. GIS manages vector data (parcels, road networks, utility lines), raster data (satellite imagery, elevation models), and attribute data linked to geographic features. GIS is optimized for large-area spatial analysis, network routing, and cartographic visualization.
Digital twins operate at the asset scale — a single bridge, runway, building, or campus — with a level of detail and temporal resolution that GIS cannot match. However, the two technologies are complementary:
Aspect
GIS
Digital Twin
Scale
Regional, city, district
Asset, facility, campus
Geometry
2D and 2.5D (elevation)
Full 3D with interior spaces
Temporal resolution
Days to years
Milliseconds to years
Primary data
Satellite, aerial, cadastral
IoT sensors, BIM, inspection
Analytics
Spatial analysis, overlay, routing
Simulation, prediction, optimization
Standard
CityGML, OGC standards
IFC, ISO 23247
Integrated BIM + GIS + IoT = Digital Twin. The industry consensus, articulated by the Digital Twin Consortium and reflected in ISO 23247, is that a full infrastructure digital twin requires the integration of three domains: BIM provides element-level geometric and semantic detail; GIS provides spatial context and terrain data; and IoT provides real-time operational sensor data. The digital twin is the synthesis of these three layers into a unified platform.
Digital Twin Architecture
The architecture of an infrastructure digital twin follows a layered structure that separates data acquisition, data integration, modeling, analytics, and application delivery. The ISO 23247 reference architecture defines four primary entities: Observable Manufacturing Elements (the physical asset), Device Communication Entities (sensors and data acquisition), Digital Twin Entities (the data models and simulations), and User Entities (applications and interfaces). For infrastructure, a five-layer architecture is widely adopted.
Physical Layer
The physical layer comprises the infrastructure asset itself and all sensing and data acquisition equipment installed on or around it. This includes:
Structural Health Monitoring (SHM) sensors permanently installed on critical infrastructure. For bridges, these include strain gauges on main girders and cross-frames (sampling at 10–200 Hz), accelerometers for vibration monitoring (20–200 Hz), displacement transducers at expansion joints (1 Hz), tiltmeters on piers and abutments, and corrosion sensors embedded in the deck. For airport pavements, SHM includes embedded strain gauges in the pavement structure for load response measurement, moisture sensors in base layers, temperature probes at multiple depths, and pressure cells for contact stress measurement. A single instrumented infrastructure asset may have 50 to 500+ sensors producing data volumes of 100 MB to 10 GB per day.
Periodic inspection data collection systems including drone-based visual inspection platforms, manual NDT equipment, and mobile data collection devices. Drones equipped with high-resolution cameras (20–60 MP) and LiDAR sensors capture surface condition data at scheduled intervals (monthly to annually). NDT equipment including ultrasonic pulse velocity testers, ground-penetrating radar, impact-echo devices, and half-cell potential meters collect volumetric condition data at inspection points. These periodic data sources complement continuous SHM data by providing high-resolution condition snapshots that the continuous sensors cannot capture.
Operational data systems including traffic monitoring (vehicle counts, axle loads, speed), environmental monitoring (temperature, humidity, precipitation, freeze-thaw cycles), and usage data (number of aircraft movements for runways, aircraft classification and gross weights). These operational parameters provide the loading and exposure context needed for degradation modeling and remaining life prediction.
Data Layer
The data layer handles acquisition, transmission, storage, and preprocessing of all data from the physical layer. Key components include:
Edge computing nodes located on or near the asset perform initial data processing — signal conditioning, filtering, decimation, anomaly detection, and data compression — before transmitting data to central systems. Edge processing reduces bandwidth requirements by 50–90% by transmitting only relevant data (alerts, statistics, compressed waveforms) rather than raw sensor streams. Edge nodes typically run on ruggedized industrial computers with local storage for backup during communication outages.
Communication infrastructure ranges from wired connections (fiber optic, Ethernet) for permanently installed sensors to wireless protocols (4G/5G cellular, LoRaWAN, Wi-Fi) for distributed monitoring. The communication requirements vary by data type: SHM sensor streams need low-latency (10–100 ms) and moderate bandwidth (1–50 Mbps); inspection data uploads are high-bandwidth (100 Mbps–1 Gbps) but latency-tolerant; and alert events are low-bandwidth (a few bytes) but require reliable delivery with acknowledgment.
Data storage and management systems include time-series databases (InfluxDB, TimescaleDB) for sensor data, relational databases for asset attributes and inspection records, document stores for reports and imagery, and object storage (S3-compatible) for large files such as point clouds, orthomosaics, and high-resolution inspection photos. A typical infrastructure digital twin data lake grows at 1–50 TB per year depending on sensor density and inspection frequency.
Data preprocessing pipelines perform quality control — detecting sensor drift, outliers, missing data, and calibration errors — before data enters the model layer. Automated data validation rules flag measurements outside expected ranges, identify sensor failures, and trigger recalibration or maintenance alerts. Data fusion algorithms align and correlate data from multiple sources, resolving timestamp mismatches and coordinate transformation issues.
Model Layer
The model layer contains the digital representations of the physical asset. This layer integrates multiple complementary models:
Geometric models provide the 3D spatial framework for the digital twin. These are sourced from BIM models (IFC format), laser scanning point clouds (E57, LAS formats), photogrammetry meshes (OBJ, PLY formats), and GIS base maps (GeoJSON, Shapefile formats). The geometric model is structured as a hierarchical element tree — site, building, story, slab, beam, column, etc. — following the IFC element taxonomy. Each element has a unique identifier that serves as the key for linking sensor data, inspection results, and maintenance records.
Semantic models define the properties, relationships, and behaviors of each element. A bridge bearing element, for example, has semantic properties including bearing type (elastomeric, pot, spherical), design capacity (vertical, horizontal, rotational), material properties, installation date, inspection interval, and current condition rating. Relationships link the bearing to its supporting pier and supported girder. Semantic models follow standardized ontologies such as the IFC property set definitions or the BuildingSMART Data Dictionary (bSDD).
Behavioral models simulate the physical behavior of the asset under various conditions. These include:
Finite element models (FEM) for structural analysis under static and dynamic loading, calibrated against field measurements
Degradation models for predicting deterioration rates based on material properties, environmental exposure, and loading history (e.g., corrosion models for steel, fatigue models for welded details, alkali-silica reaction models for concrete)
Reliability models for estimating probability of failure and remaining service life using structural reliability analysis methods (FORM, SORM, Monte Carlo simulation)
Thermal and hygrothermal models for moisture and temperature distribution in pavement structures and building envelopes
Traffic and loading models for predicting future loading regimes based on traffic growth projections and operational scenarios
State estimation models combine real-time sensor data with physics-based models using data assimilation techniques. Kalman filters, particle filters, and Bayesian updating methods continuously adjust model parameters to match observed behavior, enabling the digital twin to track the actual condition of the asset in real-time rather than relying solely on theoretical predictions.
Application Layer
The application layer delivers the digital twin capabilities to end users through dashboards, analytics tools, and integrated workflows. Applications are organized by use case:
Condition monitoring dashboards provide real-time visualization of sensor data, condition ratings, and alert status. Interactive 3D viewers allow users to navigate the asset model, click on elements to view their properties and sensor data, and overlay inspection results on the geometric model. Time-series charts display sensor trends with configurable time ranges and statistical summaries. Color-coded condition maps highlight areas requiring attention based on defined thresholds.
Predictive analytics modules process historical and real-time data to forecast future condition states, identify degradation trends, and predict remaining useful life. Machine learning models trained on historical data detect patterns preceding failures — such as accelerated strain growth indicating fatigue crack propagation or increasing vibration amplitude indicating bearing deterioration. Predictive models generate maintenance recommendations with confidence intervals, enabling condition-based maintenance planning.
Simulation and what-if analysis tools allow engineers to evaluate the consequences of different scenarios — what happens if traffic loading increases by 20%, if a seismic event occurs, if a planned maintenance intervention is deferred by two years, or if a new runway overlay is applied. Simulation results are visualized in the 3D model, showing predicted damage patterns, remaining life estimates, and cost implications for each scenario.
Workflow integration connects the digital twin to enterprise systems including Computerized Maintenance Management Systems (CMMS), Enterprise Asset Management (EAM) platforms, and Geographic Information Systems (GIS). When the digital twin detects a critical condition, it can automatically generate a work order in the CMMS, email the responsible engineer with a link to the relevant sensor data, and update the asset register in the EAM system.
Data Integration
The effectiveness of an infrastructure digital twin depends on its ability to integrate diverse data sources into a coherent, consistent, and accessible data environment. Integration addresses technical, semantic, and temporal heterogeneity across data sources.
IoT Sensor Integration
IoT sensor data is the backbone of real-time digital twin operation. Sensors measure physical quantities — strain, acceleration, displacement, temperature, humidity, pressure, corrosion rate, pH, and more — at sampling rates from 1 Hz (temperature) to 1 kHz (dynamic strain for fatigue analysis). Each sensor is identified by a unique identifier and metadata including sensor type, manufacturer, calibration date, installation location, orientation, and measurement range.
Integration workflow. Sensors connect to data acquisition units (DAUs) that digitize analog signals, apply anti-aliasing filters, and timestamp each measurement. DAUs transmit data to edge processors or directly to the cloud via industrial protocols. The IoT platform — typically an industrial IoT (IIoT) middleware solution — manages device registration, data ingestion, protocol translation, and initial data validation. Validated data streams are written to time-series databases and simultaneously published to message brokers for real-time dashboard updates and alert processing.
Time synchronization is critical for correlating data from multiple sensors. GPS-disciplined clocks provide microsecond-level synchronization across geographically distributed sensors. Network Time Protocol (NTP) provides millisecond synchronization for less demanding applications. Timestamps are recorded in UTC to avoid timezone ambiguities and daylight saving transitions.
Data quality management addresses common IoT data issues including missing values (communication dropout), outliers (sensor noise, interference), drift (sensor aging, temperature effects), and calibration errors. Automated quality control algorithms flag suspicious data for manual review, interpolate short gaps (less than 1 hour), and trigger sensor recalibration for persistent drift.
Drone Survey Integration
Drone-based visual inspection provides high-resolution spatial data that complements point sensor measurements. Integration of drone survey data follows a structured pipeline:
Capture and processing. Drones fly pre-programmed missions following photogrammetric survey patterns with 70–80% forward overlap and 60–70% side overlap. Ground sampling distance (GSD) is typically 1–5 mm per pixel for detailed infrastructure inspection. LiDAR-equipped drones capture point clouds with 50–200 points per square meter. Onboard GPS and inertial measurement units (IMU) provide initial georeferencing, refined using ground control points (GCPs) or real-time kinematic (RTK) positioning for absolute accuracy of 2–5 cm.
3D reconstruction. Structure from Motion (SfM) and Multi-View Stereo (MVS) algorithms process overlapping imagery to generate dense point clouds, textured 3D meshes, and orthorectified mosaics (orthomosaics). These outputs are georeferenced to the digital twin coordinate system — typically the national coordinate reference system (e.g., NAD83, ETRS89) with orthometric heights. Output files range from 100 MB (orthomosaic of a single bridge) to 50 GB (full airport photogrammetry model).
Change detection and defect mapping. New drone survey data is compared against previous surveys and the baseline BIM model using automated algorithms. Change detection identifies geometric changes (deformation, settlement, missing elements) by comparing point clouds and meshes. Defect detection uses computer vision algorithms trained on annotated datasets to identify cracks, spalls, corrosion, delamination, joint failures, and coating degradation. Detected defects are geolocated, measured (crack width, spall area, corrosion extent), classified by severity, and written to the digital twin condition database with links to the source imagery.
Visual overlay. Orthomosaics and 3D textured meshes are overlaid on the BIM geometry in the digital twin viewer, enabling inspectors to visually inspect the current surface condition in the context of the full asset model. Historical imagery can be replayed to visualize defect progression over time.
Inspection Record and NDT Data Integration
Non-destructive testing (NDT) data provides volumetric condition information that surface inspection cannot capture. Integration of NDT data follows standardized procedures:
UPV and GPR data. Ultrasonic pulse velocity measurements collected on a survey grid are interpolated to generate velocity contour maps showing zones of low-quality concrete. Ground-penetrating radar profiles are processed to identify rebar location, deck delamination, moisture accumulation, and void detection. These raster data layers are georeferenced and overlaid on the digital twin geometry for correlation with surface-visible defects.
Impact-echo and acoustic data. Impact-echo testing produces frequency spectra that indicate concrete thickness and internal defect presence. Acoustic emission monitoring detects active cracking events. These data types are spatially registered to specific grid locations or sensor coordinates and imported into the digital twin as point-condition data.
Half-cell potential and resistivity data. Corrosion potential mapping identifies areas of active corrosion in reinforced concrete. Electrical resistivity measurements indicate concrete permeability and corrosion risk. These spatial data sets are interpolated to create condition maps that overlay on the deck or slab geometry in the digital twin.
Integration workflow. All NDT data is recorded with location coordinates (GPS or local grid), timestamp, equipment metadata, and raw measurement values. Data is validated against calibration standards and accepted measurement ranges. Processed results — condition ratings, defect classifications, quantitative measurements — are written to the digital twin element-level condition database, enabling queries such as “show all bridge deck elements with corrosion potential below -350 mV and UPV below 3,500 m/s.”
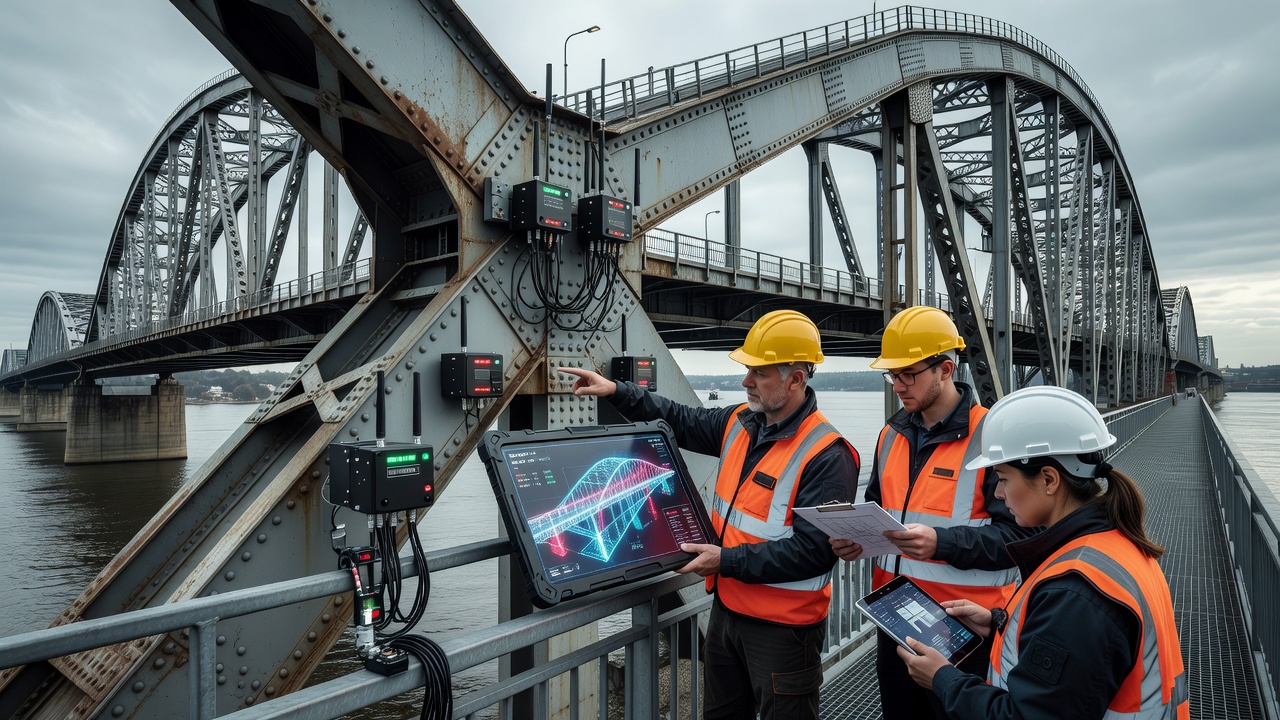
Digital Twin for Bridges
Bridges are among the most critical and most monitored infrastructure assets, making them ideal candidates for digital twin implementation. A bridge digital twin integrates structural health monitoring, inspection data, loading information, and engineering models to provide comprehensive condition awareness and decision support.
Structural Health Monitoring Integration. Permanently installed SHM sensors on major bridges monitor:
Strain and stress at critical locations — mid-span girders, field splices, cover plates, and connection details — using vibrating wire strain gauges and fiber optic sensors (FBG and distributed sensing)
Acceleration and vibration using servo accelerometers and MEMS sensors for modal analysis, traffic-induced vibration, and seismic response monitoring
Displacement and deflection using GPS sensors, robotic total stations, and linear variable differential transformers (LVDTs) at expansion joints and bearing locations
Environmental conditions including temperature (air and structural), wind speed and direction, and humidity
Corrosion activity using corrosion rate probes, half-cell potential sensors, and concrete resistivity sensors
A well-instrumented long-span bridge may have 200–1,000+ sensors generating 1–10 GB of data per day. The digital twin processes this data to compute structural performance metrics including maximum deflection under live load, natural frequencies and mode shapes, bearing movement ranges, and stress ranges for fatigue evaluation.
Condition Assessment and Rating. The digital twin maintains element-level condition ratings following standardized protocols such as the FHWA National Bridge Inspection Standards (NBIS) rating system (0–9 scale) or the CoRe (Commonly Recognized) element-level condition states (1–4). Inspection findings — both visual and NDT — update element ratings automatically, with the digital twin tracking the condition history of each element. The digital twin aggregates element ratings into overall bridge condition scores and identifies critical elements driving the condition rating.
Load Rating and Capacity Assessment. The digital twin combines as-built geometry, material properties from testing, and measured structural response to compute refined load ratings. Live load distribution factors are calibrated using measured strain data, providing more accurate ratings than code-based distribution factors. The digital twin evaluates posting requirements for load-restricted bridges and simulates the effect of overweight vehicle permits on structural capacity.
Fatigue Life Prediction. For steel bridges, the digital twin tracks stress-range histograms at fatigue-prone details using rainflow counting of strain gauge data. Cumulative fatigue damage is computed using Miner rule with S-N curves appropriate for each detail category. The digital twin predicts remaining fatigue life and identifies details approaching their design fatigue life for prioritized inspection.
Seismic and Extreme Event Monitoring. During seismic events, the digital twin records acceleration time histories at multiple locations, computes peak accelerations and drift ratios, assesses likely damage based on pre-computed fragility curves, and provides immediate post-event condition assessment. This capability enables rapid decision-making about bridge closure, inspection urgency, and repair prioritization following earthquakes.
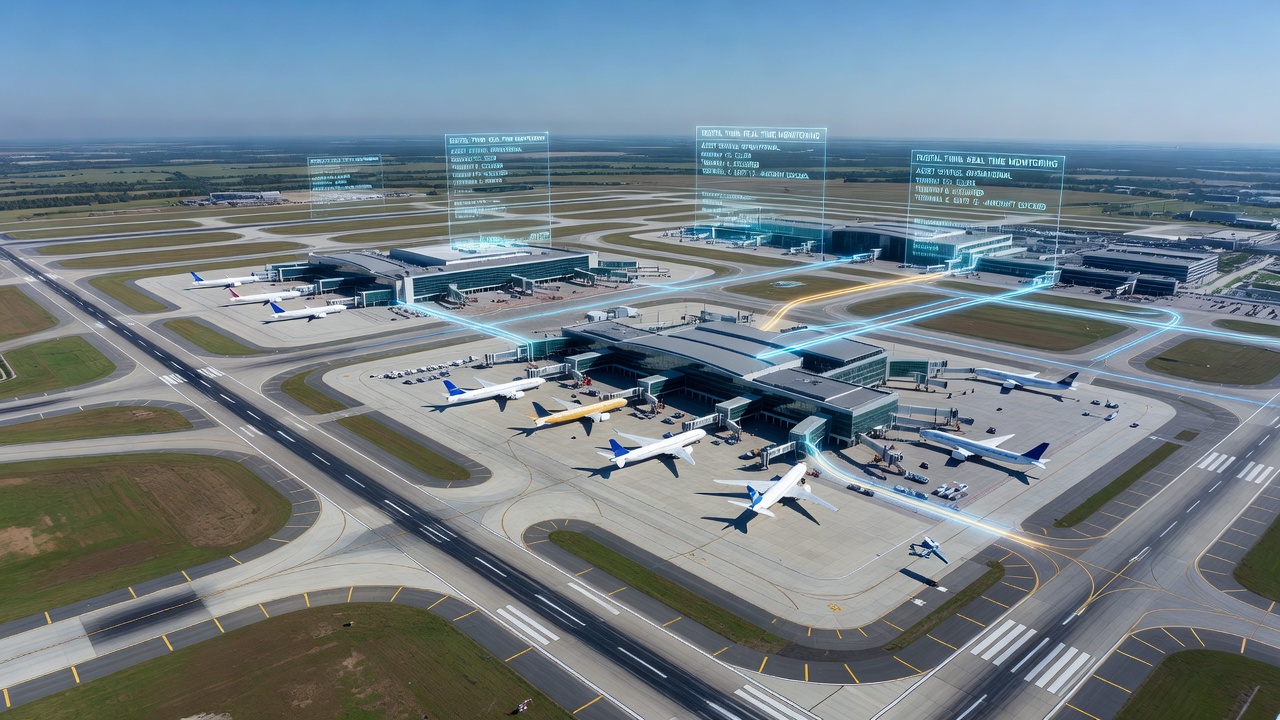
Digital Twin for Airports
Airports are complex ecosystems of interconnected infrastructure assets — runways, taxiways, aprons, terminals, airfield lighting, navigational aids, fueling systems, and utilities — each with its own monitoring and maintenance requirements. A digital twin for an airport integrates these assets into a single operational view.
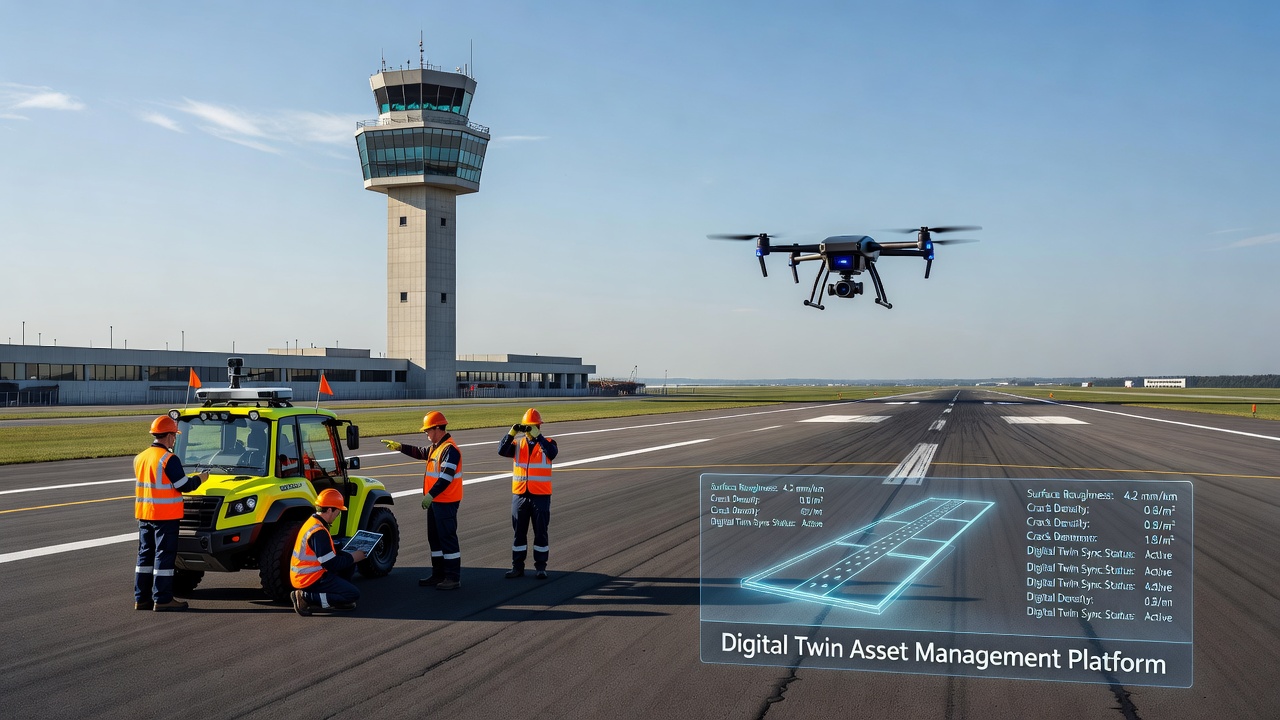
Runway and Pavement Digital Twin. Airport pavements are the most heavily loaded and most safety-critical infrastructure assets in aviation. A runway digital twin integrates:
Pavement structural data from Falling Weight Deflectometer (FWD) tests, ground-penetrating radar, and core samples, providing layer thicknesses, moduli, and condition
Surface condition data from drone surveys and automated pavement condition surveys, detecting cracks, rutting, raveling, shoving, joint spalling, and foreign object debris
Aircraft loading data from weigh-in-motion sensors, aircraft classification numbers (ACN), and movement counts, tracking the cumulative loading on each pavement section
Pavement management system (PMS) integration for computing Pavement Condition Index (PCI), predicting deterioration using pavement performance models (e.g., AASHTO ME Pavement Design), and optimizing maintenance and rehabilitation (M&R) timing
The runway digital twin enables lifecycle cost optimization — determining the optimal timing for crack sealing, overlay, and reconstruction based on actual condition, loading, and budget constraints. It supports the International Air Transport Association (IATA) Aerodrome Pavement Certification requirements and ICAO Annex 14 pavement strength reporting (PCN — Pavement Classification Number).
Leading airport digital twin implementations include: Dubai International Airport (DXB) achieving 95% on-time performance through integrated digital operations; Amsterdam Schiphol (AMS) with 80,000+ sensors across its infrastructure; Dallas/Fort Worth International Airport (DFW) implementing the first dedicated runway digital twin; and Singapore Changi Airport reducing equipment downtime by 15% through predictive maintenance from its digital twin platform.
Terminal and Building Digital Twin. Terminal digital twins integrate building management systems (BMS), HVAC control, lighting control, escalator and elevator monitoring, baggage handling system status, security system integration, and passenger flow analytics. Occupancy sensors and Wi-Fi tracking data enable real-time passenger flow monitoring, queue length prediction, and dynamic resource allocation. Energy management optimization — adjusting HVAC and lighting based on actual occupancy and weather forecasts — typically achieves 15–30% energy savings.
Airside Operations Digital Twin. An airside digital twin integrates airfield lighting control and monitoring (CCR, AGL), navigational aids status (ILS, DME, NDB), apron management systems, gate allocation, and ground handling equipment tracking. Real-time integration with the Airport Operational Database (AODB) and Air Traffic Control systems provides a single operational picture. Simulation of airside operations enables what-if analysis for construction phasing, new taxiway routing, and winter operations planning.
Real-Time Monitoring and Predictive Analytics
The combination of real-time monitoring and predictive analytics is the primary value driver for infrastructure digital twins. Real-time monitoring detects conditions that require immediate attention, while predictive analytics forecasts future conditions to enable proactive maintenance.
Operational issues — equipment malfunction, power failure, communication loss
Safety conditions — unauthorized access, structural overload, fire, gas leaks
Real-time monitoring systems implement threshold-based alerting with multiple alert levels: advisory (exceeding 75% of design limit), warning (exceeding 90%), and critical (exceeding 100%). Alerts are routed to responsible personnel via email, SMS, and dashboard notifications, with escalation procedures for unattended alerts.
Predictive Analytics Methods. The digital twin employs several predictive analytics approaches:
Machine learning models trained on historical sensor data detect patterns preceding failure events. Random Forest, Gradient Boosting, and Long Short-Term Memory (LSTM) networks predict remaining useful life based on feature extraction from sensor time series. For bridge fatigue, LSTM models trained on stress-range histograms predict crack initiation timing with typical accuracy of ±15%. For pavement deterioration, gradient boosting models integrating PCI history, traffic loading, climate data, and maintenance history predict future PCI with accuracy of ±5 points over a 5-year horizon.
Physics-based models simulate degradation mechanisms using first principles. Corrosion models predict metal loss based on environmental exposure (humidity, temperature, chloride concentration) using electrochemical kinetics. Fatigue models predict crack growth based on stress intensity factors and Paris Law parameters. These models provide mechanistic understanding that complements data-driven predictions, particularly for extrapolation beyond historical experience.
Hybrid models combine physics-based and data-driven approaches. The physics model provides the overall degradation trend, and the machine learning model corrects residuals between physics predictions and actual measurements, accounting for unmodeled effects. Hybrid models typically achieve 20–30% better prediction accuracy than either approach alone.
Key performance indicators (KPIs) computed by the digital twin include:
Structural health index (0–100 scale) aggregating multiple sensor and inspection metrics
Remaining service life in years for the overall asset and individual elements
Probability of failure from structural reliability analysis
Risk score combining probability of failure and consequence of failure
Maintenance urgency — recommended intervention window based on predicted condition trajectory
Digital Twin and Drone-Based Inspection
Drone-based visual inspection and digital twins form a powerful symbiotic relationship. Drones provide the high-resolution spatial data that feeds the digital twin, and the digital twin provides the context and analytics that make drone data actionable.
Integrated Workflow. The typical drone-digital twin workflow proceeds as follows:
Mission planning uses the digital twin geometry to define flight paths optimized for complete coverage of critical elements. The digital twin identifies areas requiring priority inspection — elements with low condition ratings, high stress, approaching end of design life, or overdue for inspection — and plans drone missions to focus on these areas. Flight paths are generated automatically, accounting for obstacle clearance, lighting conditions, and battery range.
Data acquisition uses multi-sensor drone payloads including high-resolution RGB cameras (20–60 MP), multispectral cameras for material differentiation, thermal cameras for moisture and delamination detection, and LiDAR for geometric measurement. RTK-equipped drones achieve 2–5 cm absolute positioning accuracy without ground control points, enabling precise georeferencing of inspection data.
Automated defect detection applies computer vision algorithms to drone imagery. Convolutional neural networks (CNNs) trained on annotated infrastructure defect datasets detect and classify surface defects. State-of-the-art models achieve 85–95% detection accuracy for cracks wider than 0.3 mm, spalls larger than 5 cm diameter, and corrosion areas exceeding 10 cm². Detected defects are automatically measured, geolocated, and written to the digital twin condition database.
Temporal comparison aligns new drone data with previous surveys. Change detection algorithms identify new defects, progression of existing defects, and changes in geometric alignment. The digital twin tracks defect growth rates — for example, crack propagation rates in mm/year — and alerts when growth rates exceed thresholds that indicate active deterioration.
Integration into condition assessment. Drone inspection findings are combined with SHM sensor data and NDT results in the digital twin condition assessment engine. A bridge deck condition rating, for example, integrates drone-visible cracking and spalling, GPR-detected delamination, and corrosion potential measurements into a composite condition score. The digital twin generates prioritized repair recommendations based on the integrated condition assessment.
Implementation Challenges
Despite the clear benefits, implementing digital twins for infrastructure assets presents significant challenges that organizations must address.
Data interoperability remains the most frequently cited challenge. Infrastructure data spans multiple domains (structural, geotechnical, environmental, operational), multiple formats (IFC, CityGML, LAS, CSV, binary sensor formats), and multiple vendors (Siemens, Bentley, Autodesk, ESRI, specialized SHM providers). The Digital Twin Consortium reports that 40–60% of digital twin implementation effort is consumed by data integration and cleaning. Standardizing on open formats (IFC, SensorML, OGC standards) and implementing a common data environment (CDE) mitigates this challenge but requires organizational commitment.
Data volume and management. A single instrumented bridge generates 1–10 TB of data annually. An airport digital twin spanning 10+ runways, 50+ buildings, and 10,000+ sensors generates 50–500 TB annually. Managing this data — storage, backup, versioning, access control, retention policies — requires enterprise-grade data infrastructure. Cloud storage costs for a large airport digital twin range from USD 50,000–500,000 annually. Data retention policies must balance the value of historical data for trend analysis with storage costs and data privacy regulations.
Sensor reliability and maintenance. SHM sensors have finite lifespans (3–10 years depending on type and environment) and require periodic calibration. Sensor failure rates in harsh infrastructure environments (bridges, runways) can reach 5–15% annually. A digital twin with unreliable sensors produces unreliable condition assessments — a problem known as “garbage in, garbage out.” Redundant sensor deployment, automated diagnostic algorithms that detect sensor failures, and scheduled sensor maintenance programs are essential for maintaining digital twin reliability.
Organizational and skills challenges. Digital twin implementation requires collaboration between civil/structural engineers, data scientists, IT professionals, asset managers, and operations staff — disciplines that traditionally operate in silos. The shortage of professionals with combined infrastructure domain expertise and data analytics skills is a critical constraint. Organizations report that 45 documented barriers to digital twin adoption exist across six clusters: technical, organizational, financial, regulatory, cultural, and skills-related.
Cybersecurity. Connecting operational technology (sensors, control systems) to information technology (cloud platforms, enterprise systems) creates new attack surfaces. A compromised digital twin could provide false condition information leading to inappropriate maintenance decisions, or worse, enable direct manipulation of physical systems. Digital twin systems must implement cybersecurity measures including network segmentation, encrypted communications, multi-factor authentication, regular security audits, and incident response plans. The NIST Cybersecurity Framework and IEC 62443 standards provide guidance for industrial control system security.
Upfront investment. Initial deployment costs for a comprehensive infrastructure digital twin — sensors, data infrastructure, software platform, integration, and organizational setup — typically range from USD 1–10 million for a major bridge and USD 10–50 million for a major airport. ROI materializes over 3–7 years through reduced maintenance costs, extended asset life, and avoided failures. Organizations with constrained capital budgets may need to phase digital twin deployment, starting with critical assets or specific use cases and expanding over time.
Future Trends
The infrastructure digital twin landscape continues to evolve rapidly, driven by technology advances, regulatory developments, and industry adoption.
AI-Enhanced Digital Twins. The integration of foundation models and large language models (LLMs) with digital twins enables natural language querying — “show me all bridge elements with condition rating below 5 and corrosion activity accelerating” — generating automated inspection reports and maintenance recommendations. Reinforcement learning agents trained on digital twin simulations optimize maintenance scheduling, traffic management, and energy consumption. Computer vision models for automated defect detection continue to improve, approaching human-level accuracy for standard defect types.
Edge AI and Real-Time Processing. Increasingly powerful edge computing hardware enables real-time AI inference on sensor data at the asset location, reducing cloud dependency and enabling sub-second response to critical events. Edge-based anomaly detection models achieve 95%+ accuracy with 10–50 ms latency, enabling real-time structural health alerts without requiring cloud connectivity.
Open Standards and Interoperability. The adoption of ISO 23247 for digital twin framework, IFC 4.3 for infrastructure BIM, and CityGML 3.0 for urban digital twins is driving interoperability. The Digital Twin Consortium Platform Stack reference architecture provides implementation guidance. BuildingSMART International and the Open Geospatial Consortium (OGC) collaborate on infrastructure digital twin standards. These standardization efforts reduce integration costs and enable digital twins to span asset portfolios rather than remaining isolated silos.
Regulatory Drivers.ICAO 2025 Asia-Pacific meeting proposed revising Annex 11 (Air Traffic Services) to incorporate digital twin integration into airspace management. National infrastructure agencies — the US Federal Highway Administration, UK National Highways, and the European Commission Connecting Europe Facility — increasingly require or incentivize digital twin adoption for major infrastructure projects. Regulatory requirements for continuous monitoring of critical infrastructure after extreme events (seismic, flood, extreme weather) drive digital twin adoption as the platform for meeting these requirements.
Sustainability and ESG Applications. Digital twins enable infrastructure carbon footprint tracking — computing embodied carbon in construction materials, operational energy consumption (for buildings and lighting), and maintenance-related emissions. Lifecycle assessment (LCA) integration within the digital twin enables optimization of maintenance and rehabilitation strategies for minimum carbon impact. Climate resilience assessment uses the digital twin to simulate asset performance under future climate scenarios (increased temperatures, more intense precipitation, sea level rise) and identify adaptation measures.
Portfolio-Scale Digital Twins. Organizations managing multiple infrastructure assets are moving toward portfolio-scale digital twins that span their entire asset base. A portfolio digital twin enables cross-asset optimization — prioritizing maintenance funding across assets based on risk, condition, and criticality; benchmarking asset performance; and identifying fleet-wide deterioration patterns. Portfolio digital twins require standardized data models and condition assessment protocols across all assets, but deliver economies of scale in platform costs and organizational capability.
Conclusion
Digital twin technology represents a fundamental shift in infrastructure asset management — from reactive, calendar-based maintenance to proactive, condition-based, predictive management. By integrating real-time sensor monitoring, periodic drone-based visual inspection, non-destructive testing data, and engineering models into a single living digital representation, digital twins enable infrastructure owners to understand the current condition of their assets, predict future deterioration, optimize maintenance timing, and extend asset service life.
For airport and aviation infrastructure specifically, digital twins are particularly valuable because of the complexity and criticality of the assets involved — runways that must remain operational 24/7/365, bridges that carry heavy aircraft loads, terminals that process millions of passengers, all operating under stringent ICAO and FAA regulatory oversight. The integration of drone-based visual inspection data into an infrastructure digital twin creates a powerful synergy: drones deliver high-resolution spatial condition data at regular intervals, and the digital twin provides the analytical context that transforms raw inspection data into actionable maintenance intelligence.
The organizations that successfully implement digital twins — addressing the challenges of data interoperability, organizational change, skills development, and upfront investment — will achieve significant competitive advantage through reduced costs, extended asset life, improved safety, and enhanced regulatory compliance. As technology matures and standards converge, digital twins will become the standard platform for infrastructure asset management rather than a cutting-edge innovation.
Frequently Asked Questions
A 3D model is a static geometric representation of a physical asset, whereas a digital twin is a dynamic, data-connected virtual replica that continuously synchronizes with its physical counterpart through real-time sensor data, inspection records, and operational telemetry. While a 3D model shows what an asset looks like, a digital twin shows how the asset is performing, what condition it is in, and how it will behave under future scenarios. A digital twin incorporates BIM geometry, GIS spatial context, IoT sensor streams, and historical data into an integrated system that supports simulation, what-if analysis, and predictive analytics. The key distinction is the bidirectional data flow — changes detected in the physical asset are reflected in the digital twin, and insights generated from the digital twin inform decisions about the physical asset.
Building Information Modeling (BIM) provides the foundational 3D geometry, building element taxonomy, and construction documentation that forms the base layer of a digital twin. BIM is typically static and focused on design and construction phases, while a digital twin extends through the entire operational lifecycle of an asset with real-time operational data. A digital twin can be thought of as BIM plus IoT sensors, plus real-time monitoring, plus predictive analytics. BIM models structured using Industry Foundation Classes (IFC) provide standardized element definitions that the digital twin uses for spatial referencing and asset identification. When BIM geometry is enriched with live sensor data, inspection results, and maintenance records, it transitions from a static information model to a living digital twin.
An infrastructure digital twin ingests multiple data types: IoT sensor data (strain gauges, accelerometers, temperature sensors, corrosion sensors, pressure transducers) collected via Structural Health Monitoring (SHM) systems at sampling rates from 1 Hz to 1 kHz; drone-based visual inspection imagery captured at resolutions of 1–5 mm per pixel; non-destructive testing (NDT) data including ultrasonic pulse velocity, ground-penetrating radar, and impact-echo results; laser scanning and photogrammetry point clouds with sub-centimeter accuracy; maintenance history records and work orders; meteorological and environmental data; traffic and loading data; and historical inspection reports. All data must be georeferenced to a common coordinate system and timestamped for temporal correlation, enabling the digital twin to provide a complete spatiotemporal condition picture of the asset.
Implementation challenges include data interoperability and standardization (different data formats from different sensor systems require standardized schemas like IFC, CityGML, and SensorML); data volume and bandwidth (a single bridge SHM system can generate terabytes of data annually, requiring edge computing and data compression strategies); sensor reliability and calibration drift affecting data quality; organizational silos between engineering, operations, and IT departments; high upfront costs for sensor deployment, data infrastructure, and software platforms; cybersecurity risks introduced by connecting operational technology to IT networks; lack of skilled personnel who understand both the physical infrastructure domain and digital technologies; and the difficulty of validating digital twin predictions against actual asset behavior. The Digital Twin Consortium and ISO 23247 framework provide guidance for addressing these challenges through standardized reference architectures.
Drone-based inspection integrates with digital twins through a structured workflow: drones equipped with high-resolution cameras, LiDAR, and thermal sensors capture visual and geometric data of the infrastructure asset. The collected imagery is processed using photogrammetry and computer vision algorithms to generate orthomosaics, 3D point clouds, and textured mesh models with typical ground sampling distances of 1–5 mm. These outputs are georeferenced to the digital twin coordinate system and registered against the existing BIM or 3D model geometry. Automated change detection algorithms compare new inspection data against baseline conditions to identify new cracks, spalls, corrosion, deformation, or other defects. The detected anomalies are tagged with location coordinates, dimensions, and severity classifications, and ingested into the digital twin condition database. This integration enables inspectors to visualize inspection results in the context of the full asset model, track defect progression over time, and trigger maintenance workflows directly from the digital twin platform.
ISO 23247 (Digital Twin framework for manufacturing) provides a reference architecture for digital twin systems including observable manufacturing elements, device communication, digital twin entities, and user entities. ISO 19650 (Organization and digitization of information about buildings and civil engineering works) governs information management using BIM throughout the asset lifecycle. Industry Foundation Classes (IFC, ISO 16739) provide the data schema for building and infrastructure element definitions. CityGML (ISO 19136) supports 3D city and infrastructure models at multiple levels of detail. The Digital Twin Consortium Platform Stack reference architecture defines layers from data acquisition through analytics and visualization. For aviation infrastructure specifically, ICAO Annex 14 and FAA Advisory Circulars provide the regulatory context for digital twin applications, though no ICAO-specific digital twin standard yet exists — ICAO 2025 APAC meeting proposed revisions for digital twin integration into airspace management.
According to industry surveys, 92% of organizations implementing digital twins report measurable ROI exceeding 10% within the first three years. Specific benefits include: equipment failures reduced by up to 70% through predictive maintenance; maintenance costs reduced by 25–30% by shifting from time-based to condition-based maintenance; inspection frequency optimized by 30–50% by targeting inspections to areas identified by the digital twin as high-risk; unplanned downtime reduced by 20–50%; asset life extended by 5–15% through optimized maintenance timing; and safety incident reduction through early detection of critical defects. For airport operators specifically, digital twins have demonstrated runway availability improvements of 15–25% and pavement maintenance cost reductions of 20–35%. The global digital twin market is projected to reach USD 169–224 billion by 2030–2034, growing at a CAGR of 35–40%.
Feed Your Digital Twin with Drone Inspection Data
TarmacView provides high-resolution drone-based visual inspection data that seamlessly integrates into your infrastructure digital twin platform. Schedule a demo to see how our aerial survey data enriches your asset monitoring and predictive analytics workflows.
Automated drone inspection uses pre-programmed flight paths, computer vision, and AI analysis to survey infrastructure assets including runways, bridges, roads,...
Change detection compares co-registered images or point clouds of the same structure taken at different times to identify new, worsening, or repaired defects — ...
A point cloud is a set of 3D data points representing the external surfaces of objects or terrain, generated by LiDAR scanning or photogrammetry. In infrastruct...
31 min read
Infrastructure inspection
3D surveying
+4
Cookie Consent We use cookies to enhance your browsing experience and analyze our traffic. See our privacy policy.