A pavement distress survey systematically identifies, classifies, and measures each distress type, severity, and extent on a pavement section following standard protocols (FHWA LTPP; ASTM D6433; agency-specific), forming the basis for PCI calculation and condition assessment. Covers survey types (windshield; walking; automated imaging; drone), sampling, and distress identification training.
Pavement Distress Survey Methodology
Purpose and Governing Standards
A pavement distress survey is the systematic process of identifying, classifying, and measuring visible deterioration on a pavement surface. The survey produces objective data on the type, severity, and extent of each distress present within defined pavement sections. This data forms the foundational input for the Pavement Condition Index (PCI), a numerical rating from 0 (failed) to 100 (excellent) that drives maintenance and rehabilitation (M&R) decision-making across road networks, airport airfields, parking lots, and military installations.
Three governing standards define distress survey methodology across different pavement contexts: the FHWA Long-Term Pavement Performance (LTPP) Distress Identification Manual (DIM) , ASTM D6433 (roads and parking lots), and ASTM D5340 (airports). The FHWA LTPP DIM, now in its fifth revised edition (FHWA-HRT-13-092, May 2014), provides the most comprehensive reference with over 137 pages of standardized distress definitions, color photographs, measurement protocols, and severity level assignment criteria. It was first issued in 1987 and is estimated to be used by 90 percent of State highway agencies across the United States. The manual divides pavement types into three categories: (1) asphalt concrete-surfaced pavements, (2) jointed portland cement concrete (PCC) pavements, and (3) continuously reinforced concrete pavements, each with its own distress catalog.
ASTM D6433, titled Standard Practice for Roads and Parking Lots Pavement Condition Index Surveys, operationalizes the distress identification process into a PCI calculation workflow. It defines network hierarchy (Branch → Section → Sample Unit), sampling strategies, distress measurement units, and the deduct value methodology that converts field observations into PCI scores. The standard covers 19 distress types for asphalt concrete and 19 for PCC roads. The current active revision is ASTM D6433-24, published by ASTM Committee E17 on Pavement Management.
ASTM D5340, Standard Test Method for Airport Pavement Condition Index Surveys, adapts the PCI methodology specifically for airfield pavements including runways, taxiways, aprons, and holding pads. It was developed by the U.S. Army Corps of Engineers through funding from the U.S. Air Force and is further verified and adopted by the FAA and U.S. Naval Facilities Engineering Command. The values stated in inch-pound units are regarded as standard for airport applications. FAA Advisory Circular AC 150/5380-7B mandates that federally obligated airports must perform detailed inspections at least once per year, though the frequency of detailed PCI surveys may be extended to three years if a formal pavement management program is maintained with documented PCI history.
The International Civil Aviation Organization (ICAO) references pavement condition assessment through its Aerodrome Design and Operations Manual (Doc 9157) and the recently adopted ACR/PCR method (Aircraft Classification Rating / Pavement Classification Rating), which replaced the older ACN/PCN system. While ICAO does not prescribe a specific distress survey method, it requires that aerodrome pavement strength be reported and that pavement condition be monitored to ensure safe aircraft operations. Many ICAO member states implement ASTM D5340 or national equivalents to satisfy these requirements.
Survey Types
Pavement distress surveys fall into four broad categories, each with distinct trade-offs between speed, detail, cost, and coverage:
Windshield (Fast Visual) Survey
The windshield survey is the most rapid assessment method. A surveyor drives along the pavement at slow speed (typically 15–30 km/h or 10–20 mph) and makes observational notes about visible distress, general condition, and obvious safety hazards. No measurements are taken, no sample units are formally defined, and no severity levels are quantitatively assigned. The output is a narrative or simple rating (e.g., Good / Fair / Poor). Windshield surveys are suitable for network-level screening where the goal is to identify which pavement sections require more detailed inspection. They cover large distances quickly — a single inspector can assess 50–100 km of roadway per day. However, the data lacks the precision and repeatability required for PCI computation. Windshield surveys are commonly used by municipalities for annual cursory assessments between formal PCI cycles, and by maintenance crews for identifying urgent safety concerns such as potholes or edge drop-offs.
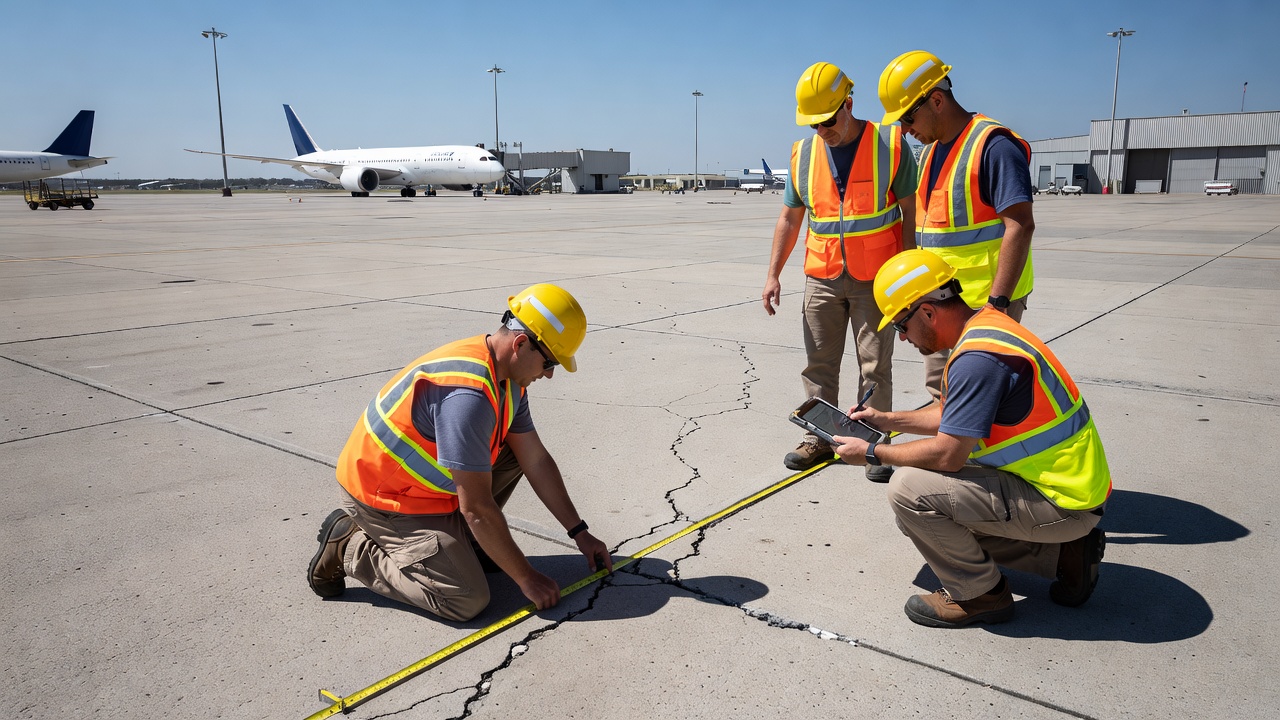
Walking (Detailed) Survey
The walking survey is the gold standard for project-level PCI determination. Surveyors physically walk each sample unit, carrying measuring wheels, tape measures, crack gauges, straight edges, and distress recording forms (paper or digital tablet). Within each sample unit — approximately 2,500 square feet (±1,000 sq ft) for asphalt concrete roads or 20 contiguous slabs (±8 slabs) for PCC roads — the surveyor identifies every distress present, assigns a severity level (Low, Medium, or High per LTPP/ASTM criteria), and measures the quantity in the appropriate unit (square feet for area distresses, linear feet for linear distresses, count for discrete distresses like potholes).
Walking a single 2,500 sq ft sample unit typically takes 15–30 minutes depending on distress density. A full Section of 20–40 sample units may require a full day for a two-person crew. While labor-intensive, walking surveys produce the highest quality data for PCI computation because they capture exact distress measurements at millimeter precision. The surveyor can also feel surface texture, test raveling depth, and assess edge condition — sensory inputs that no automated system fully replicates. ASTM D6433 and D5340 both assume walking surveys as the reference method, and all PCI deduct value curves were calibrated against walking survey data collected by trained inspectors.
Automated Image-Based Survey
Automated image-based surveys use vehicle-mounted camera arrays to capture continuous pavement imagery at highway speeds (up to 100 km/h or 60 mph). These systems typically include multiple high-resolution line-scan or area-scan cameras, laser profilers for rutting measurement, and inertial measurement units for georeferencing. The imagery is post-processed using photogrammetry software to create orthomosaics and then analyzed — either manually by technicians or automatically via AI-based distress recognition algorithms. Automated surveys cover entire networks rapidly — a single survey vehicle can collect 100–200 lane-km per day — and produce objective, repeatable data free from surveyor fatigue or bias.
The ground sample distance (GSD) of automated systems typically ranges from 1–5 mm/pixel depending on camera configuration and vehicle speed. For reliable crack detection (crack widths down to 3 mm), a GSD of 2 mm/pixel or better is required. The FHWA Practical Guide for Quality Management of Pavement Condition Data (FHWA-HIF-22-004) provides detailed specifications for automated data collection quality assurance. Challenges include reduced accuracy in shadowed areas, wet pavement conditions, and the difficulty of distinguishing certain distress types (e.g., bleeding versus polished aggregate) from imagery alone. Automated surveys are widely used by state DOTs (Department of Transportation) for network-level PCI assessment, with sample-based walking surveys used for ground-truth calibration.
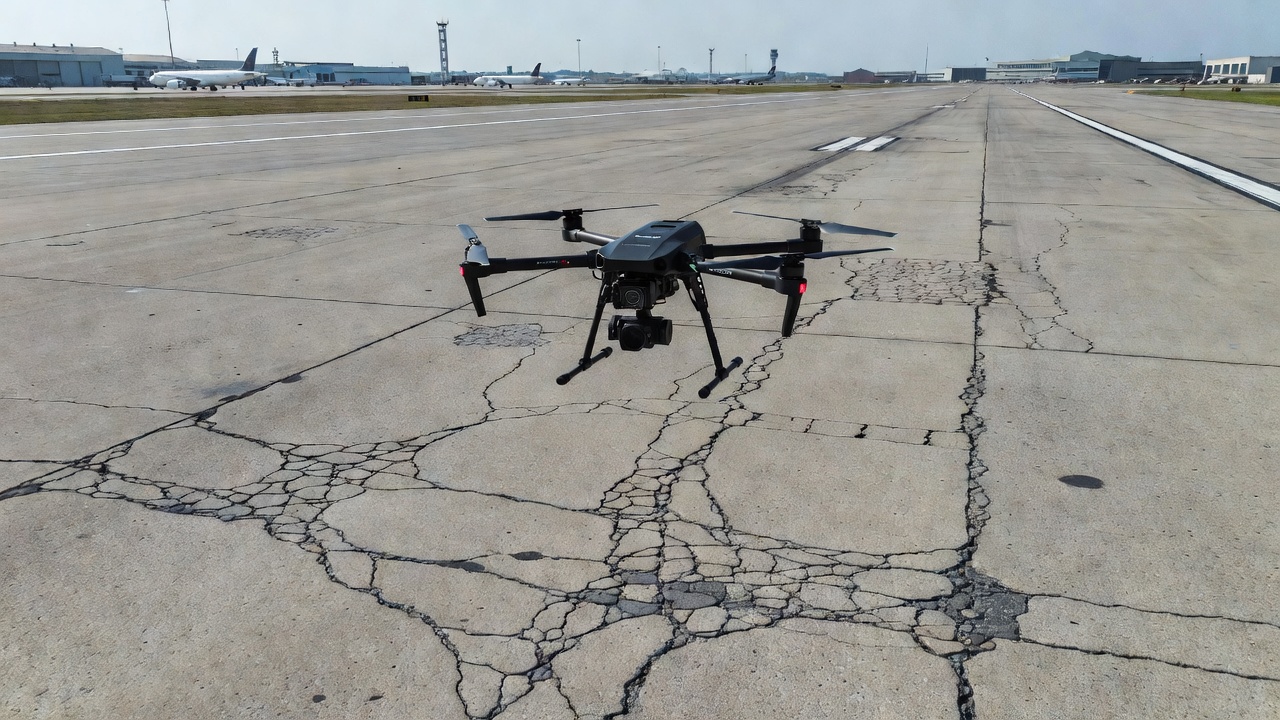
Drone-Based Survey
Drone-based distress surveys represent the newest and fastest-evolving survey method. Unmanned aerial vehicles (UAVs or drones) equipped with high-resolution RGB cameras (20+ megapixels) fly pre-programmed grid missions over pavement surfaces at altitudes of 5–30 meters, capturing thousands of overlapping nadir images. These images are processed via Structure-from-Motion (SfM) photogrammetry into orthomosaics with GSD as fine as 1–2 mm/pixel and digital surface models (DSMs) with elevation accuracy of 5–10 mm. The orthomosaics are then analyzed for distress identification, either by trained technicians or by AI-based automated distress recognition algorithms.
FAA-sponsored research (2020–2022) involving 97 drone missions at five U.S. airports confirmed that all distress types detectable in traditional walking surveys could be identified in drone orthomosaics at ~2 mm/pixel GSD. At Paris Charles de Gaulle Airport, a single runway of 200,000 m² was surveyed in 1 hour 45 minutes net flight time — versus multiple runway closures and days of manual inspection. Drone surveys eliminate the need for personnel to walk on active pavements, significantly reducing safety risks. The data is spatially complete (100% coverage of the surveyed area), geo-referenced, and permanently documented, enabling historical condition comparison and trend analysis. TarmacView implements drone-based distress surveys with automated AI analysis, fully compatible with ASTM D6433/D5340 PCI calculation workflows.
Sampling Methods
Not every square meter of pavement must be surveyed to obtain a statistically valid condition assessment. ASTM D6433 defines a statistical sampling framework that balances survey effort against required confidence levels:
100% Survey (Full Coverage)
100% inspection means every sample unit in a Section is surveyed. This is required for Sections smaller than 5 sample units, for Sections where the estimated PCI standard deviation exceeds 15 points, or for project-level design where exact distress quantities are needed for rehabilitation quantity takeoffs. 100% surveys are also standard for airport runways and primary taxiways where FAA and ICAO requirements demand complete condition documentation. The disadvantage is cost: surveying every sample unit requires 3–5 times more field time than random sampling.
Random Sampling
ASTM D6433 provides the formula n = (N × s²) / ((e²/4) × (N − 1) + s²) where N is the total number of sample units in the Section, s is the estimated standard deviation of PCI (typically assumed as 10 for initial surveys), and e is the allowable error (±5 PCI points). For a typical Section with 20 sample units, n calculates to approximately 6 random sample units. The random units are selected using systematic random sampling: divide the total number of units by n to obtain an interval i, select a random starting unit between 1 and i, then inspect every i-th unit thereafter. If any randomly selected sample unit has a PCI below 40, additional “targeted” sample units must be inspected in the immediate vicinity to verify the extent of poor condition.
Stratified Sampling
Stratified sampling divides the Section into sub-areas (strata) based on known condition indicators — traffic loading zones, drainage patterns, construction history, or prior PCI data. Random sample units are then selected independently from each stratum. This approach provides higher precision than simple random sampling for the same sample size when condition varies systematically across the Section. For example, an airport taxiway may be stratified into the center 30 feet (highest traffic loading), the outer wheel path zones, and the shoulder areas. Stratified sampling is recommended by the FHWA Practical Guide for Quality Management and is widely used in airport pavement management programs (PMPs).
Targeted Sampling
Targeted (or non-random) sampling is used to investigate specific areas of concern — a patch of alligator cracking, a deteriorated transverse joint, or an area adjacent to a utility cut. Targeted units are not included in the statistical PCI calculation for the Section but are recorded as separate data points for maintenance planning. ASTM D6433 requires that if targeted sample units are inspected, they must be clearly flagged in the survey data and excluded from the Section PCI computation to avoid biasing the statistically random sample.
Distress Identification
Distress identification requires the surveyor to correctly recognize each distinct defect type per the governing standard. The FHWA LTPP DIM organizes distresses into five categories for asphalt concrete (AC) surfaces:
Lane-to-Shoulder Dropoff, Water Bleeding & Pumping
lin ft or sq ft
L / M / H
For jointed PCC surfaces, distresses include corner breaks, durability cracking (“D” cracking), longitudinal cracking, transverse cracking, joint seal damage (transverse and longitudinal), spalling of longitudinal joints, and 14 additional types defined in ASTM D6433 and the LTPP DIM. For continuously reinforced PCC (CRCP) , distresses include punchouts, transverse cracking, longitudinal cracking, and spalling.
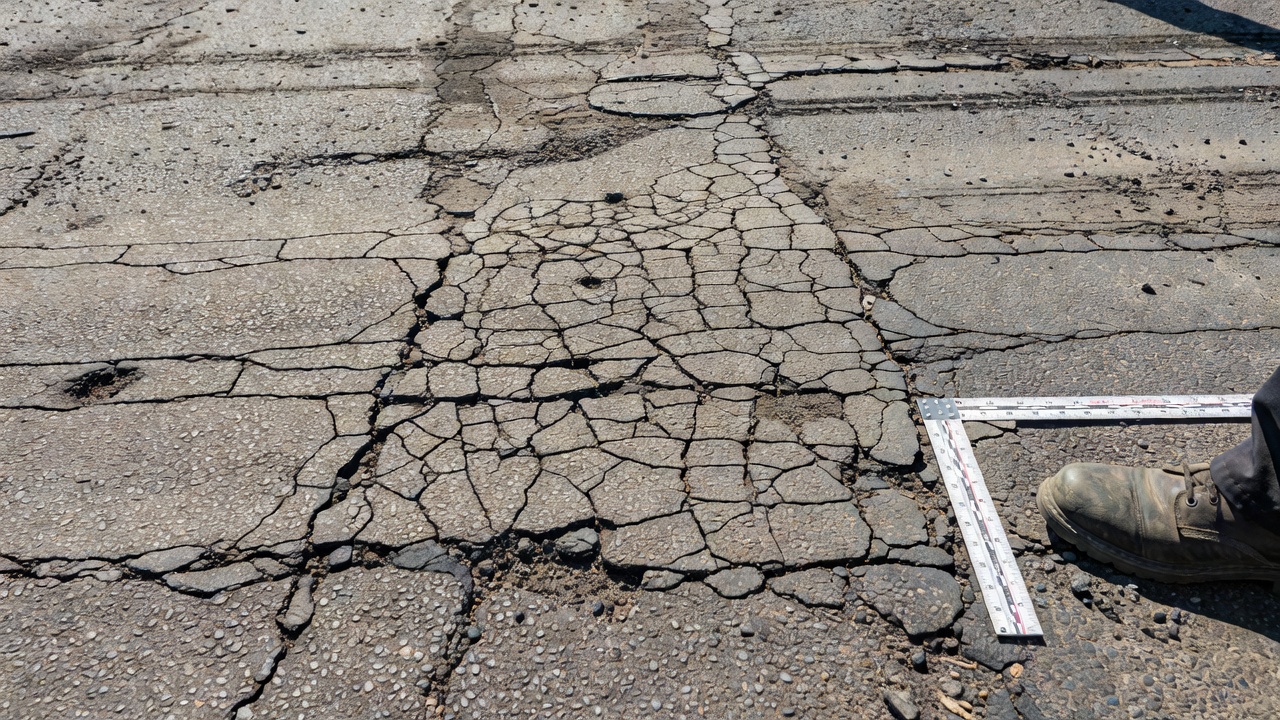
Each distress type has a precise definition in the LTPP DIM with color photographs showing the distress at each severity level. For example, alligator cracking (also called fatigue cracking) is defined as a series of interconnected cracks forming a pattern resembling alligator skin or chicken wire, caused by fatigue failure of the AC surface under repeated traffic loading. Low-severity alligator cracking features fine longitudinal cracks parallel to each other with no spalling, while High-severity shows a complete crack pattern with significant spalling and pumping of fines.
Severity Level Determination
Each distress type has three severity levels — Low (L) , Medium (M) , and High (H) — defined by measurable physical criteria. The LTPP DIM provides detailed textual descriptions and photographic references for each severity level of each distress. Severity assignment requires engineering judgment calibrated against the standard references. Key severity criteria include:
Crack width: For longitudinal and transverse cracking, Low severity is typically < 1/4 inch (6 mm) with no spalling; Medium is 1/4 to 3/4 inch (6–19 mm) with minor spalling; High is > 3/4 inch (> 19 mm) with significant spalling.
Spalling severity: For PCC joints and cracks, Low spalling involves small fragments (< 3 inches or 75 mm) with no exposed aggregate; Medium involves moderate fragmentation with exposed aggregate; High involves severe fragmentation with loss of slab integrity.
Rutting depth: Low rutting is 1/4 to 1/2 inch (6–13 mm); Medium is 1/2 to 1 inch (13–25 mm); High is > 1 inch (> 25 mm).
Faulting (PCC slabs): Low faulting is 1/8 to 3/8 inch (3–10 mm); Medium is 3/8 to 3/4 inch (10–19 mm); High is > 3/4 inch (> 19 mm).
Raveling: Low raveling shows loss of fine aggregate with rough surface texture; Medium shows loss of coarse aggregate with visible pitting; High shows extensive aggregate loss with significant surface erosion.
Severity level is critical because the PCI deduct value curves are nonlinear — a Low-severity distress at 5% density may yield a deduct value of 12, while the same distress at the same density at High severity may yield a deduct value of 35. Incorrect severity assignment is the single largest source of PCI variability between surveyors. A 2010 FHWA study found that inter-rater variability in severity classification contributed up to ±8 PCI points difference on the same sample unit even among certified inspectors.
Extent Measurement
Distress extent is measured in the unit specified by the governing standard for each distress type. Three measurement units are used:
Square feet (sq ft) or square meters (m²): Used for area-type distresses including alligator cracking, block cracking, bleeding, corrugation, depression, patching, polished aggregate, raveling, rutting, shoving, slippage cracking, swell, and weathering. The surveyor measures the total area of pavement affected by each distress at each severity level. For example, a 2,500 sq ft sample unit containing 300 sq ft of Medium-severity alligator cracking and 150 sq ft of High-severity alligator cracking would record those as two separate entries. The ASTM standard requires that area measurements include the entire distressed zone including any intact islands within the distressed area boundary.
Linear feet (lin ft) or meters (m): Used for linear-type distresses including edge cracking, joint reflection cracking, lane-to-shoulder drop-off, longitudinal cracking, and transverse cracking. The surveyor measures the total length of each crack or linear defect. ASTM D6433 specifies that linear cracks shorter than 1 foot (0.3 m) are not recorded. For longitudinal and transverse cracking, individual cracks are summed separately per severity level. The crack length measurement is taken along the crack trajectory, not as a straight-line chord length.
Count (each): Used for discrete distresses including potholes and individual PCC slab defects. For potholes, each pothole is counted individually and its severity assigned based on depth and diameter criteria. ASTM D6433 defines a pothole as a bowl-shaped depression > 4 inches (100 mm) in diameter. For PCC distresses such as corner breaks or shattered slabs, the count is the number of affected slabs.
The measured quantity is converted to distress density by dividing the measured quantity by the total sample unit area. Distress density is the input variable for the PCI deduct value curves. A sample unit with 125 sq ft of alligator cracking in a 2,500 sq ft area has a density of 5.0%. This density is entered into the appropriate deduct value curve for alligator cracking at the recorded severity level to obtain the deduct value.
PCI Calculation from Survey Data
The PCI calculation transforms distress survey data into a single numerical condition rating through a four-step process:
Step 1 — Compute Distress Density: For each distress entry (type + severity combination), divide the measured quantity by the total sample unit area. The density d = 100 × (Adistress / Asample) expressed as a percentage.
Step 2 — Determine Deduct Values (DV): For each distress density-severity pair, read the corresponding deduct value from the ASTM D6433 deduct value curves. These curves are published in the standard appendices and are unique for each of the 19 AC distress types at each of three severity levels — 57 curves for AC alone. The curves are derived from empirical pavement deterioration modeling and reflect the relative contribution of each distress to overall pavement degradation.
Step 3 — Determine Maximum Corrected Deduct Value (CDV) : Sort all individual deduct values from highest to lowest. Determine m, the maximum number of allowable deducts, using the formula m = 1 + (9/98) × (100 − HDV) where HDV is the highest individual deduct value. Iteratively reduce the smallest non-zero deduct values to 1.0 and recompute the sum. For each iteration, read the CDV from the correction curve in ASTM D6433 which accounts for diminishing marginal impact of multiple distresses.
Step 4 — Compute PCI: PCI = 100 − CDVmax, where CDVmax is the maximum CDV obtained across all iterations.
The PCI ranges from 0 (Failed) to 100 (Good), mapped to seven verbal rating categories per ASTM D6433:
PCI Range
Rating
Typical Action
86–100
Good
Routine monitoring
71–85
Satisfactory
Preventive maintenance
56–70
Fair
Minor rehabilitation
41–55
Poor
Major rehabilitation
26–40
Very Poor
Structural rehabilitation
11–25
Serious
Reconstruction
0–10
Failed
Immediate reconstruction
The PCI expresses the collective judgment of pavement maintenance engineers and is an indirect measure of pavement structural integrity (not structural capacity) and functional condition indicators such as roughness. The PCI is not intended to replace direct measurement of ride quality, structural capacity, or friction.
Automated Distress Survey (AI-Based)
Automated distress recognition using artificial intelligence (AI) and deep learning has transformed pavement condition surveying over the past decade. Convolutional neural networks (CNNs) and transformer-based architectures are trained on large annotated datasets of pavement images to detect, classify, and measure distress types automatically. Modern systems achieve per-class F1 scores exceeding 0.85 for cracking detection and 0.90 for pothole detection on well-lit, dry pavement surfaces.
The automated pipeline typically includes: (1) image acquisition via survey vehicle cameras or drones, (2) tiling of large orthomosaics into analysis patches (e.g., 512×512 pixels at 2 mm/pixel GSD), (3) AI model inference to classify each patch and localize distress regions via object detection or semantic segmentation, (4) morphometric measurement of distress area, length, and count from pixel-level predictions, (5) severity classification based on crack width, spalling extent, or rut depth from the segmentation mask, and (6) automated PCI computation from the measured distress quantities.
The 2024 National Academies report on AI Applications for Automatic Pavement Condition Evaluation identified deep learning-based distress detection as the most mature AI application in pavement engineering, with multiple commercially deployed systems. Challenges remain in handling varying lighting conditions, wet pavement, shadow occlusion, and distinguishing distress types that appear visually similar (e.g., low-severity alligator cracking versus block cracking). Hybrid systems that combine AI pre-screening with human verification are currently the most common operational approach, though fully autonomous systems are rapidly improving.
TarmacView implements a fully automated drone-to-PCI pipeline: drone-captured orthomosaics at 2 mm/pixel GSD are processed through proprietary AI models trained on the LTPP DIM classification system, producing per-sample-unit distress measurements that feed directly into ASTM D6433 PCI calculation.
Survey Frequency and Triggers
The FAA AC 150/5380-7B mandates that federally obligated airports perform detailed pavement inspections at least once per year. However, if the airport maintains a formal Pavement Management Program (PMP) with documented PCI survey history, the frequency of detailed PCI surveys may be extended to three years. In practice, larger airports conduct PCI surveys every 3 years for their entire pavement network, supplemented by annual windshield surveys and continuous routine maintenance inspections. Smaller airports with limited pavement areas may conduct annual PCI surveys.
For road networks, the AASHTO Guidelines for Pavement Management Systems recommend PCI surveys every 3–5 years for network-level assessment, with annual surveys for high-volume roadways and sections with known rapid deterioration rates. Trigger thresholds for initiating a distress survey include:
Time-based: Scheduled survey cycle (1–5 years depending on network size and budget)
Condition-based: PCI below a defined threshold (typically 70 for preventive maintenance intervention)
Event-based: After extreme weather events (freeze-thaw cycles, flooding, heat waves), significant traffic changes (new development, route reclassification), or construction defects identified post-rehabilitation
Incident-based: After aircraft overruns, chemical spills, or fire damage on airfield pavements
Project-based: Before planned rehabilitation or reconstruction to establish baseline condition and design quantities
Continuous condition monitoring using embedded sensors (fiber optics, acoustic emission) and vehicle-mounted sensors (mobile mapping, inertial profilers) is emerging as a supplement to periodic distress surveys, enabling real-time deterioration tracking and earlier intervention.
Surveyor Training and Certification
Distress survey quality depends directly on surveyor training. The FHWA LTPP program has trained thousands of surveyors through structured certification programs. The PAVER training program (developed by the U.S. Army Corps of Engineers Construction Engineering Research Laboratory — ERDC-CERL) offers three levels: Level 1 (Introduction to Inventory and Distress Identification), Level 2 (Intermediate PCI Survey and Data Collection), and Level 3 (Advanced PCI Analysis and Project Planning). Surveyor certification requires passing a written knowledge exam and a practical field exam where the candidate surveys multiple sample units and achieves distress identification agreement with a certified reference surveyor within ±5 PCI points.
The Pavement Distress Surveyor Certification administered by the Asphalt Institute and various state DOT programs requires annual recertification, with an online refresher module and a practical exam every three years. Key elements of training include:
Distress recognition: Study of the FHWA LTPP DIM with photographic reference cards for each distress type at each severity level
Field calibration: Side-by-side surveys with a certified reference surveyor on multiple pavement section types (AC, PCC, CRCP)
Measurement technique: Proper use of measuring wheels, tapes, crack gauges, straight edges, and fault measuring devices
Severity classification: Training on the quantitative criteria for each distress severity level, with emphasis on the most commonly misclassified distresses
Documentation: Correct completion of field survey forms, digital data entry protocols, and quality control procedures
Safety: Traffic control procedures, airfield safety protocols (movement area access, FOD awareness, radio communication), and personal protective equipment requirements
Inter-rater reliability studies consistently show that certified surveyors achieve ±3–5 PCI points agreement on the same sample units, while uncertified surveyors may differ by ±10–15 PCI points. The ASTM standards emphasize that the reliability of the PCI method depends on the quality and consistency of the distress survey data. All PCI surveys should document the certification status of the survey team and include a quality assurance component where a minimum of 10% of sample units are re-surveyed by a different certified surveyor for validation.
TarmacView’s automated drone-based approach eliminates inter-rater variability entirely, as the AI model applies consistent distress identification and severity classification criteria to every pixel of every survey image, producing fully repeatable results that match trained human surveyor performance at ~2 mm/pixel GSD.
Frequently Asked Questions
A windshield survey is a fast, vehicle-based visual inspection where surveyors drive slowly along the pavement and make observational notes of visible distress. It covers large networks quickly but records only general condition impressions without precise measurements. It is suitable for network-level screening. A walking distress survey is a detailed, foot-based inspection where surveyors physically walk each sample unit, measure distress quantities with tapes and rulers, and assign severity levels per standards. Walking surveys are required for project-level PCI computation because they capture exact distress densities needed for deduct value curves. Walking a 2,500 sq ft sample unit typically takes 15–30 minutes depending on distress density.
ASTM D6433 defines 19 distress types for asphalt concrete (AC) surfaced roads and parking lots. These are numbered AC-01 through AC-19 and include alligator cracking (fatigue), bleeding, block cracking, bumps and sags, corrugation, depression, edge cracking, joint reflection cracking, lane/shoulder drop-off, longitudinal and transverse cracking, patching and utility cuts, polished aggregate, potholes, railroad crossing, rutting, shoving, slippage cracking, swell, and weathering and raveling. For jointed portland cement concrete (PCC) pavements, ASTM D6433 defines 19 additional distress types numbered PCC-21 through PCC-39. For airports, ASTM D5340 defines analogous distress types specific to airfield pavements.
ASTM D6433 provides a statistical formula to calculate the minimum number of random sample units (n) that must be surveyed to estimate the Section PCI within ±5 PCI points at a 95% confidence level. For a typical Section with 20 to 40 sample units, this usually requires inspecting 5 to 8 random units. The formula is n = (N × s²) / ((e²/4) × (N − 1) + s²), where N is the total number of sample units in the Section, s is the estimated standard deviation of PCI (commonly assumed as 10), and e is the allowable error (±5 PCI). Additional sample units must be inspected if any random unit has a PCI below 40, to improve estimate accuracy.
Yes, drone-based surveys can effectively replace manual PCI surveys when the imagery ground sample distance (GSD) is 2 mm/pixel or better. FAA-sponsored research at five U.S. airports (2020–2022) demonstrated that all distress types identified in traditional foot-on-ground surveys could be detected in drone orthomosaics at ~2 mm GSD. At Paris Charles de Gaulle Airport, a 200,000 m² runway was surveyed by drone in 1 hour 45 minutes net flight time, producing millimeter-resolution imagery that mapped every crack and distress. The drone data integrates with PCI calculation workflows, and AI-based automated distress recognition further reduces manual analysis time. TarmacView implements this exact methodology.
Transform Your Pavement Surveys with Automated Drone Inspection
TarmacView replaces manual distress surveys with drone-based automated analysis. Our AI identifies, classifies, and measures all distress types per ASTM standards — faster, safer, and with complete spatial coverage. Book a demo to see how we digitize your pavement condition assessment workflow.
ASTM D6433 — Standard Practice for Roads and Parking Lots Pavement Condition Index Surveys
ASTM D6433-20 defines the Pavement Condition Index (PCI) methodology for roads and parking lots, establishing inspection unit definition, distress identificatio...
The Pavement Condition Index (PCI) is a numerical rating from 0 (failed) to 100 (excellent) that quantifies pavement surface condition based on observed distres...
The Pavement Condition Index (PCI) is a numerical indicator from 0 (failed) to 100 (excellent) that rates pavement surface condition based on observed distress ...
26 min read
Airport Infrastructure
Pavement Management
+4
Cookie Consent We use cookies to enhance your browsing experience and analyze our traffic. See our privacy policy.