The Dynamic Cone Penetrometer (DCP) is a portable field device that measures soil and aggregate strength by recording the penetration rate (mm/blow) of a cone driven by a standard 8-kg hammer dropped from 575 mm, correlating to CBR and resilient modulus. It is widely used for rapid in-situ subgrade and base evaluation during pavement inspection, construction quality control, and forensic investigation.
Definition and Equipment
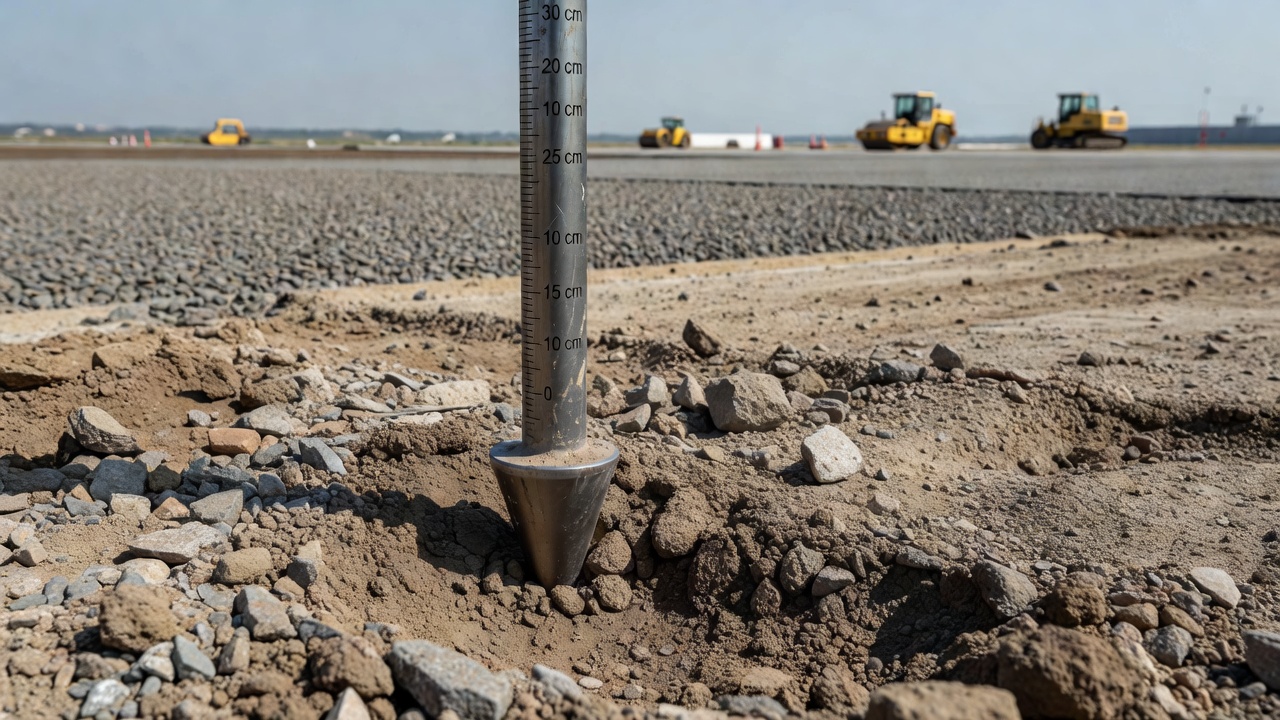
The Dynamic Cone Penetrometer (DCP) is a portable, handheld geotechnical field instrument designed to measure the in-situ strength of soils, granular materials, and weak pavement layers. It operates on a fundamentally simple principle — a conical steel tip attached to a vertical drive rod is driven into the ground by repeatedly dropping a calibrated sliding hammer from a fixed height, and the penetration depth per hammer blow is recorded. This penetration rate, expressed in millimeters per blow (mm/blow) , is inversely proportional to the material strength: stronger materials yield lower penetration rates while weaker materials allow deeper penetration per blow.
The DCP addresses a critical gap in geotechnical testing. Traditional laboratory tests like the California Bearing Ratio (CBR) require undisturbed sampling, transportation, and testing under controlled conditions that may not represent actual field moisture and density. Heavy in-situ tests like the plate bearing test or Falling Weight Deflectometer (FWD) require expensive equipment, trained operators, and significant logistical support. The DCP fills the middle ground — it provides a rapid, economical, reasonably accurate estimate of in-situ strength that can be performed by two technicians at a rate of 10-20 tests per hour, with equipment costing approximately $2,000-$3,000.
The standard DCP specified by ASTM D6951/D6951M consists of several precisely machined components. The drive rod is a 15.8 mm (5/8 in) diameter stainless steel rod, typically 1000 mm (39 in) in length, with threaded connections at both ends. The cone tip has a 60-degree included angle and a base diameter of 20 mm (0.79 in), which is 4.2 mm larger than the drive rod diameter — this intentional oversizing ensures that the cone creates a borehole larger than the rod, minimizing skin friction on the rod shaft as penetration progresses. The cone tip is either a replaceable hardened tip (machined from tool steel) for general use, or a disposable cone tip (held by a lubricated O-ring onto an adapter) for difficult extraction conditions where the cone is sacrificed to enable rod retrieval. The sliding hammer has a mass of 8.0 kg (17.6 lb) with a tolerance of ±0.010 kg, and the standard drop height is 575 mm (22.6 in) with a tolerance of ±1.0 mm. A secondary, lighter hammer of 4.6 kg (10.1 lb) is provided for testing in very soft soils where the 8-kg hammer would produce excessive penetration per blow. The anvil and coupler assembly transfers the impact force from the falling hammer to the drive rod, and the handle at the top of the assembly serves both as a grip for the operator and as the upper stop for the hammer lift.
The dual-mass DCP developed by the U.S. Army Corps of Engineers (USACE) represents a design variant where the hammer weight can be changed in the field by removing an outer steel sleeve. The 17.6-lb (8.0 kg) hammer configuration converts to the 10.1-lb (4.6 kg) configuration by loosening a hexagonal set screw and sliding off the outer sleeve. This design permits dynamic adjustment of the test energy during a single testing session. The cone penetration resulting from the 17.6-lb hammer is approximately twice that from the 10.1-lb hammer on the same material, allowing the operator to optimize the penetration rate for the expected material strength range.
The automated DCP (ADCP) is a modern variant that uses electronic sensors to measure hammer drop velocity (ensuring correct impact energy), an encoder to measure penetration depth continuously at 1 mm resolution, and integrated data logging software that computes DCP Index and estimated CBR in real time. Per ASTM D6951 Note 4, ADCP systems are explicitly permitted provided all requirements of the standard with respect to apparatus and procedure are met. ADCP systems eliminate operator-dependent variability in hammer lift and release, producing more consistent results and reducing the two-person crew requirement to a single operator.
Test Procedure (ASTM D6951)
The DCP test procedure described in ASTM D6951/D6951M (Standard Test Method for Use of the Dynamic Cone Penetrometer in Shallow Pavement Applications) follows a standardized sequence designed to ensure reproducibility across different operators and sites. The standard is under the jurisdiction of ASTM Committee E17 on Pavement Management and has been through multiple revisions (latest approved version: 2018, reapproved 2023).
Personnel and Safety
The test typically requires two persons — an operator and a recorder. The operator holds the DCP vertically by the handle, lifts and releases the hammer to produce consistent free-fall impacts. The operator must not exert downward force on the handle during testing as this would add static energy to the dynamic impact, artificially increasing penetration and overestimating material strength. The recorder measures and documents penetration depths and blow counts. Both personnel should wear appropriate personal protective equipment (PPE) including steel-toed boots, safety glasses for potential projectile debris from aggregate breakage, and hearing protection for extended testing sessions in confined areas.
Test Execution — Surface Layers
For testing a surface layer of soil or unbound pavement material, the DCP is held in a vertical or plumb position, and the cone tip is seated such that the top of the widest part of the tip is flush with the material surface. The initial penetration reading is obtained from the graduated drive rod or a separate vertical scale, recorded to the nearest 1 mm (0.04 in). The operator raises the hammer until it makes only light contact with the handle — the hammer must not impact the handle when being raised, as this would impart upward force on the rod and disturb the cone seating. The hammer is then allowed to free-fall and impact the anvil coupler assembly.
The number of blows between penetration measurements is adjusted by the operator and recorder to maintain a penetration interval of 20-35 mm per reading. In practice, this means recording penetration after every 1, 3, 5, 7, or 10 blows depending on material strength. A minimum penetration of 25 mm between recorded measurements is recommended per the USACE protocol. Data taken at smaller penetration increments (e.g., measuring after every single blow when penetration is less than 10 mm) produces excessive variability and may lead to inaccurate strength determinations, particularly in granular materials where individual aggregate particles can create large scatter in discrete blow measurements.
When the operator observes a sudden change in penetration rate (indicating a layer boundary), the recorder should note this transition. The test continues to a maximum depth of 1000 mm (39 in) for the standard rod, though testing can be stopped earlier if the design depth of interest has been reached. The number of blows required to reach full depth varies from as few as 5-10 blows in very soft clay (CBR < 3) to over 200 blows in dense gravel (CBR > 80).
Test Execution — Below Bound Layers
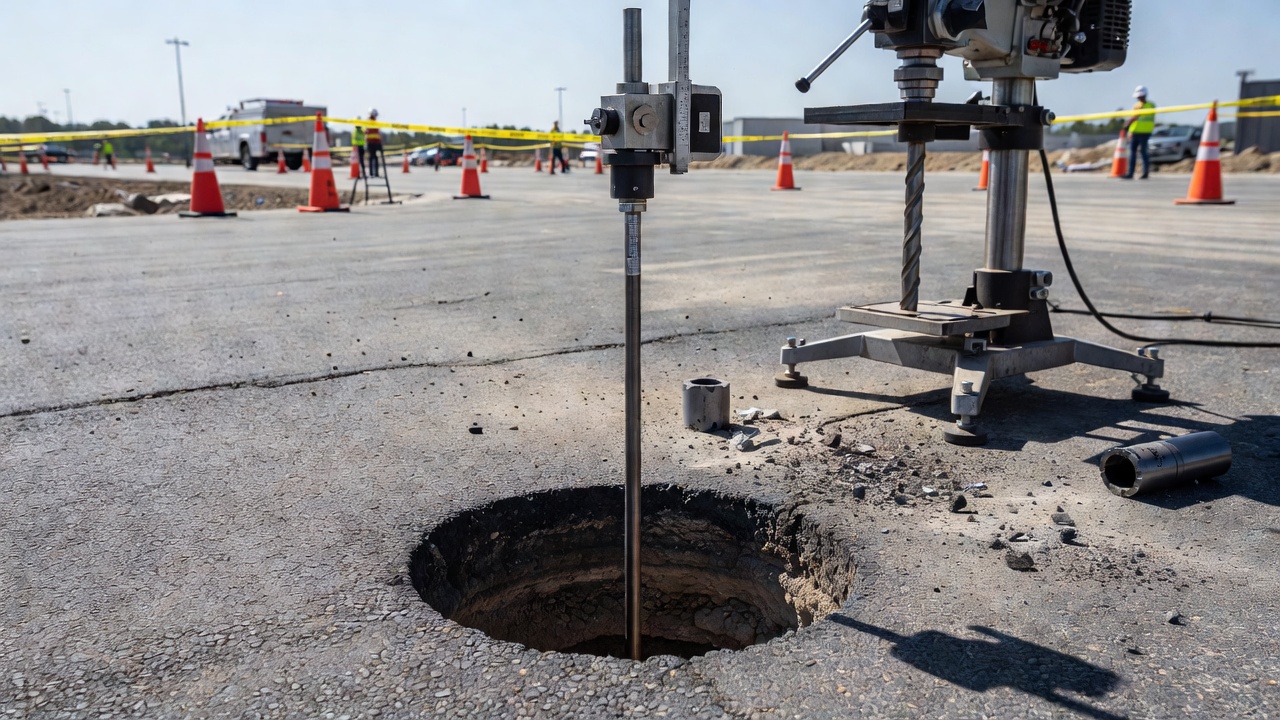
For testing materials underlying a bound pavement layer (asphalt or concrete), Section 6.3.2 of ASTM D6951 specifies that a rotary hammer drill or coring apparatus capable of drilling a minimum 25 mm (1 in) diameter hole is used to create an access hole through the bound layer. The coring operation is stopped approximately 10-20 mm short of penetrating completely through the bound layer to minimize disturbance to the underlying material, and the DCP tip is used to advance through the remaining thickness of the bound layer.
If wet coring is performed, the coring fluid must be removed immediately using a wet/dry vacuum, and the DCP test must be performed within 10 minutes of completing the coring operation. This time constraint is critical because water from the coring operation can rapidly infiltrate the subgrade or base material, artificially reducing its strength and producing erroneously low CBR values. For pavements with thin seals (chip seals, slurry seals, surface treatments less than approximately 25 mm thick), the DCP tip can be advanced directly through the seal without coring.
Termination Criteria
The test is terminated when any of the following occurs per Section 6.4.3 of ASTM D6951: (1) the maximum planned depth is reached; (2) refusal is encountered — defined as no more than 2 mm (0.08 in) of advance after 5 consecutive hammer blows, indicating presence of large aggregate, rock, or cemented material; (3) the handle has deflected more than 75 mm (3 in) from the vertical position, indicating slanted penetration through heterogeneous material; or (4) the total cumulative penetration reaches the rod length.
In the case of refusal, the test should be stopped and the device moved to a new test location a minimum of 300 mm (12 in) from the prior location to minimize test error caused by disturbance of the material. The refusal depth and condition should be recorded for forensic analysis — refusal at shallow depth (less than 200 mm) may indicate a shallow bedrock, large cobble, or buried utility, all of which are significant findings for pavement design.
Data Recording
ASTM D6951 provides a standardized data recording form (Table 1 in the standard) that captures: project identification, date, weather conditions, operator names, location (station and offset), material classification, pavement conditions, water table depth, hammer weight used, cumulative number of blows, cumulative penetration (mm), penetration between readings (mm), penetration per blow (mm/blow), hammer factor (1 for 8-kg, 2 for 4.6-kg), DCP Index (penetration per blow × hammer factor), computed CBR (%), and moisture content (%) when available. Each field contributes to the traceability and interpretability of the results.
DCP Penetration Index (DCPI)
The DCP Penetration Index (DCPI) , also referred to as the penetration rate or DCP index, is the fundamental measurement obtained from the DCP test. It is defined as the penetration depth per hammer blow, expressed in mm/blow (millimeters per blow). This single parameter is the primary output from which all derived strength parameters — CBR, resilient modulus, bearing capacity, and modulus of subgrade reaction — are calculated through empirical correlation.
Calculating DCPI
The DCPI is calculated from the incremental penetration between recorded readings, normalized by the number of blows in that increment and adjusted for the hammer weight:
where ΔPenetration is the difference in cumulative penetration between two consecutive readings (mm), ΔBlows is the number of hammer blows during that interval, and Hammer Factor is 1.0 for the 8-kg (17.6 lb) hammer and 2.0 for the 4.6-kg (10.1 lb) hammer. The hammer factor accounts for the reduced energy of the lighter hammer — the 4.6-kg hammer delivers approximately half the impact energy per blow compared to the 8-kg hammer, so its penetration rate must be doubled to obtain the equivalent DCPI for the standard 8-kg hammer correlations.
Typical DCPI Ranges
DCPI values span several orders of magnitude depending on material type and condition:
Material Type
Condition
DCPI Range (mm/blow)
Equivalent CBR (%)
Soft clay
Very soft
25-75
2-5
Stiff clay
Medium
10-25
5-15
Silty sand
Loose
15-30
4-10
Silty sand
Dense
3-8
25-60
Sand and gravel
Loose
8-20
10-30
Sand and gravel
Dense
1-5
40-100
Crushed stone base
Compacted
1-3
60-100+
Cement-treated base
Hard
< 1
> 100
A DCPI of less than 1 mm/blow typically indicates refusal or near-refusal conditions requiring termination of the test per ASTM D6951 criteria. A DCPI of greater than 50 mm/blow indicates extremely soft material where the optional 4.6-kg hammer should be used to obtain more controlled penetration measurements.
Understanding the DCPI-Depth Profile
The most powerful application of DCP testing is the continuous strength profile with depth. When DCPI is plotted against cumulative depth, changes in slope clearly indicate layer boundaries and strength transitions within the pavement structure. A typical flexible pavement DCP profile might show: DCPI of 2-4 mm/blow through the granular base course (100-300 mm depth), DCPI of 4-8 mm/blow through the subbase (300-500 mm depth), and DCPI of 15-30 mm/blow in the natural subgrade (500-1000 mm depth). Each change in slope represents a layer interface, and the transition zone between layers typically spans 25-50 mm of depth.
The USACE analysis protocol recommends ignoring the first 75-150 mm of DCP data at the surface because of insufficient confinement — at very shallow depths, the soil can heave or displace laterally around the cone, producing higher penetration rates (apparently weaker material) than the true material strength. Similarly, in CH (high plasticity clay) soils, data beyond approximately 300 mm depth should be interpreted with caution because adhesion of cohesive clay to the drive rod progressively increases skin friction, causing a “stair-stepping” effect where DCPI decreases and apparent CBR increases artifactually with depth.
CBR Correlation
The most common and widely accepted application of DCP test results is the estimation of California Bearing Ratio (CBR) from the DCP Penetration Index. CBR is the fundamental empirical strength parameter used in pavement design by the FAA, AASHTO, USACE, ICAO, and most highway agencies worldwide. The ability to estimate in-situ CBR rapidly with a portable device makes the DCP an exceptionally valuable field tool.
USACE Correlation
The U.S. Army Corps of Engineers conducted extensive side-by-side field tests comparing DCP penetration rates with in-situ CBR measurements, resulting in the most widely cited correlation. For the USACE standard DCP with the 17.6-lb (8-kg) hammer and 60-degree cone:
Equation 1 — General Use (all soil types or unknown soil type):CBR = 292 / (DCPI)^1.12
This power-law relationship was developed from testing on a broad range of soils including sands, silts, clays, and gravels. The equation can be presented in its equivalent logarithmic form:
log(CBR) = 2.48 - 1.057 × log(DCPI)
Two additional equations were developed for specific soil types where improved accuracy is achievable:
The higher correlation coefficients (R²) for the soil-specific equations confirm that soil type significantly influences the DCP-CBR relationship. The general equation (Equation 1) should be used when the soil type is unknown or when testing mixtures of different soil types, while the soil-specific equations should be used when the soil classification has been determined through laboratory testing or field identification.
TRL Correlation
The Transport Research Laboratory (TRL) in the United Kingdom developed an alternative correlation based on extensive testing of UK subgrade materials:
log(CBR) = 2.954 - 1.496 × log(DCPI)
This equation typically produces lower CBR estimates than the USACE equation for DCPI values between 5-25 mm/blow, with the difference increasing as DCPI increases. At a DCPI of 20 mm/blow, the USACE equation yields CBR ≈ 9.5%, while the TRL equation yields CBR ≈ 5.5%. The discrepancy arises from differences in local soil types, testing procedures, and reference CBR test methods (the UK uses the soaked CBR while the US in-situ CBR is unsoaked). Selection of the appropriate correlation requires professional judgment based on the local soil conditions and the design method being used.
Tabulated Correlation Values
ASTM D6951 provides a tabulated correlation table (Table 2 in the standard) for rapid field conversion without computation. Selected values from this table include:
DCPI (mm/blow)
CBR (%)
DCPI (mm/blow)
CBR (%)
< 3
100
20
12
3
80
25
9
5
50
30
7
7
35
40
5
10
20
50
4
14
15
75
2.5
Important Caveats on DCP-CBR Correlation
Several critical considerations govern the use of DCP-CBR correlations. First, the DCP measures in-situ field CBR under existing moisture and density conditions, which will not normally correlate with the laboratory or soaked CBR of the same material per ASTM D6951 Section 5.6. A material may have a laboratory CBR of 20% at optimum moisture content and a field DCP-inferred CBR of 5% under saturated field conditions. Second, the correlations were developed for the specific DCP configuration described in ASTM D6951 — DCPs with different hammer weights, drop heights, cone angles, or rod diameters have unique correlations that are specific to that instrument. Third, the scatter in the correlation is significant, with typical 95% confidence intervals of ±50% of the estimated CBR value. This uncertainty must be considered in design applications by applying appropriate factors of safety or percentile-based design values (75th or 85th percentile).
Resilient Modulus Correlation
The resilient modulus (Mr) of subgrade soils and unbound pavement materials is the fundamental stiffness parameter used in modern mechanistic-empirical (M-E) pavement design methods including the AASHTOWare Pavement ME Design procedure, the FAA FAARFIELD airport pavement design software, and the Mechanistic-Empirical Pavement Design Guide (MEPDG) . While resilient modulus is ideally measured through repeated-load triaxial testing in the laboratory per AASHTO T307, the DCP provides a rapid field estimate of Mr through correlation with the DCPI-derived CBR.
Heukelom and Klomp Correlation
The earliest and simplest correlation between resilient modulus and CBR was proposed by Heukelom and Klomp (1962) :
This linear relationship was developed from a limited dataset of fine-grained soils with CBR values between 2% and 15%. It is widely used for preliminary design and for fine-grained subgrade soils, but it significantly underestimates Mr for granular materials and overestimates Mr for very soft clays. The Transport and Road Research Laboratory (TRRL, now TRL) in the UK adopted this relationship for the design of road pavements over fine-grained subgrades.
Powell et al. Correlation
For a broader range of materials, Powell et al. (1984) proposed a power-law relationship:
This relationship was developed from testing on granular materials, crushed stone, and fine-grained soils, making it more applicable for the range of materials encountered in pavement foundation evaluation. The power-law form captures the stress-dependent behavior of soils — the stiffness increases at a decreasing rate as CBR increases, reflecting the nonlinear constitutive behavior of geomaterials.
AASHTO 1993 Correlation
The 1993 AASHTO Guide for Design of Pavement Structures recommends the following relationship for estimating resilient modulus from CBR:
The AASHTO guide explicitly notes that these relationships provide only an estimate of Mr and that direct measurement through resilient modulus testing is recommended for projects exceeding approximately $5 million in pavement construction cost. The guide also provides adjustment factors for seasonal variations in Mr based on moisture content and freeze-thaw effects.
Combined DCPI-Mr Approach
Combining the DCP-CBR correlation with the CBR-Mr correlation, a direct DCPI-Mr relationship can be derived:
This provides a one-step conversion from DCP penetration rate to resilient modulus without intermediate CBR calculation, reducing the propagation of correlation uncertainties. Field validation studies by the Louisiana Transportation Research Center (LTRC) demonstrated that Mr values from DCP correlation show reasonable agreement (within ±30%) with laboratory Mr values from AASHTO T307 testing on identical materials, with the agreement being better for fine-grained soils (R² ≈ 0.85) than for granular materials (R² ≈ 0.70).
Limitations of DCP-Based Mr Estimation
It is critical to recognize that the DCP applies a single high-strain-rate impact load, while resilient modulus testing subjects the material to conditioned cyclic loading at low strain amplitudes representative of traffic. The deformation mechanisms are fundamentally different — dynamic penetration involves shear failure and particle rearrangement at the cone tip, while resilient behavior involves elastic deformation within the soil skeleton. The empirical correlations between these fundamentally different measurements rely on statistical relationships between CBR and Mr that were established on limited datasets. For final design on major projects, Mr should be determined through direct laboratory testing (AASHTO T307 for subgrade, AASHTO T307 with an extended stress sequence for base materials), with DCP-based Mr estimates reserved for preliminary design, quality control, and forensic investigation.
DCP for Pavement Forensic Investigation
Pavement forensic investigation is the systematic process of determining the root causes of pavement distress, failure, or underperformance. The DCP is one of the most valuable tools in the forensic engineer’s arsenal because it provides quantitative strength data at discrete depth intervals, directly linking surface distress patterns to subsurface conditions.
Correlating Surface Cracks to Subsurface Weakness
When a pavement exhibits alligator (fatigue) cracking, longitudinal cracking in the wheel path, or transverse cracking with associated rutting, the forensic engineer must determine whether the distress originates from subgrade weakness, base course degradation, or structural overload. DCP testing at the crack location and at adjacent control locations (where the pavement appears sound) quantifies the strength profile difference. A typical forensic finding might show: DCPI of 35 mm/blow (CBR ≈ 5%) at 400-600 mm depth beneath the cracked area versus DCPI of 12 mm/blow (CBR ≈ 18%) at the same depth in the sound area — a clear indication that localized subgrade weakness is the primary cause of the fatigue cracking.
Layer-by-Layer Strength Profiling
One of the unique capabilities of the DCP in forensic work is its ability to produce a continuous strength profile through each layer of the pavement structure. By performing DCP tests through cored access holes at progressive depths — on top of the asphalt surface (through core hole), on the exposed base after milling, and on the subgrade after base removal — the forensic engineer can construct a complete layer-by-layer strength profile. This profile reveals whether the base course has lost strength (due to contamination, moisture damage, or particle degradation), whether the subgrade has weakened (due to moisture infiltration, subgrade pumping, or softening), or whether all layers meet or exceed design strength (indicating structural overload as the failure cause).
Quantifying Frost Heave and Thaw Weakening
In cold regions, DCP testing performed during spring thaw reveals the extent of subgrade strength loss caused by ice lens melt and excess pore water pressure. The DCP can penetrate the frozen crust (which may show DCPI of 1-3 mm/blow, indicating high frost stiffness) and then encounter the thaw-weakened subgrade below (DCPI of 30-60 mm/blow, indicating CBR of 2-5%). The depth and severity of the thaw-weakened zone can be precisely mapped, guiding decisions on load restrictions, overlay timing, or drainage improvements. Seasonal DCP monitoring at fixed locations over multiple years provides the data needed to establish spring load restriction programs on low-volume roads.
Identifying Layer Contamination and Intrusion
Forensic DCP testing can identify base course contamination by fine-grained subgrade soils. When a subgrade soil intrudes upward into the base course through pumping action under traffic, the DCPI in the base layer will show anomalously high values (lower strength) at the base-subgrade interface, with a gradual upward transition to normal base strength near the surface. The thickness of the contaminated zone can be measured to within 25 mm resolution, providing precise data for rehabilitation design — should the full base thickness be replaced, or is scarifying and recompacting sufficient?
DCP in Pavement Condition Index (PCI) Investigations
For airport pavement forensic investigations following the ASTM D5340 (Standard Test Method for Airport Pavement Condition Index Surveys) methodology, DCP data contextualizes PCI distress observations. When a PCI survey identifies distress types and severity levels associated with subgrade weakness (depressions, rutting, alligator cracking, swelling), targeted DCP testing quantifies the subsurface strength condition. The combination of PCI surface condition data and DCP subsurface strength data provides a complete forensic picture — the surface tells the “what” (type and severity of distress), while the DCP tells the “why” (subgrade strength deficiency), enabling the engineer to prescribe the correct rehabilitation strategy (subgrade improvement vs. structural overlay vs. surface treatment only).
DCP for Construction Quality Control
The DCP is an increasingly important tool for construction quality control (QC) and quality assurance (QA) of pavement layers during construction. Its portability, speed, and direct strength measurement make it ideal for verifying that compacted materials meet strength specifications.
Compaction Verification
Traditional compaction QC relies on density-based measurements — nuclear density gauge (ASTM D6938) or sand cone test (ASTM D1556) — that compare in-situ dry density to the maximum dry density from laboratory Proctor compaction (ASTM D698 or D1557). However, density alone does not guarantee strength. A material at 95% of maximum dry density on the wet side of optimum may have significantly lower strength than the same material at 95% density on the dry side of optimum. The DCP provides strength-based verification that complements density measurements.
The USACE and several state DOTs (including Florida, Missouri, Kansas, and Texas) have developed DCP-based compaction specifications. The typical approach involves: (1) constructing a test strip at different compaction levels and moisture contents; (2) establishing the DCPI-Compaction relationship for that specific material; and (3) defining acceptance criteria as a maximum allowable DCPI (i.e., minimum allowable strength) for the compacted layer. Florida DOT (FDOT) Specification Section 120, for example, requires a maximum DCPI of 8 mm/blow (equivalent to minimum CBR of approximately 30%) for compacted subgrade, and 5 mm/blow for base course.
Assessing Uniformity
One of the most valuable aspects of DCP-based QC is the ability to assess uniformity across a pavement section. Defects in pavement performance most commonly develop at weak spots — localized areas where compaction was inadequate or material quality was poor. By performing DCP tests on a grid pattern (e.g., every 50 m along the centerline and at both edges), the engineer can construct a strength contour map of the compacted layer, identifying under-strength areas for remedial compaction before pavement construction proceeds. This proactive approach prevents the costly future rehabilitation that would be required if weak spots were not identified until after asphalt or concrete placement.
The FAA’s AC 150/5370-10H (Standards for Specifying Construction of Airports) references DCP testing as an acceptable method for acceptance of subgrade and base course compaction on airport projects. The typical requirement is that the DCPI at each test location shall not exceed the established maximum, and the average DCPI of all tests on a lot (defined as 2,000-5,000 m² of area) shall not exceed 80% of the maximum allowable DCPI.
Thin Layer and Confined Area Testing
The DCP is particularly advantageous for compaction QC in confined spaces where nuclear density gauge or sand cone testing is impractical — adjacent to structures, on narrow berms, within trenches, on slopes, and around utility structures. The DCP can be operated in a space less than 2 m in height and 1 m in width, requiring no heavy support equipment. This capability makes it the preferred QC tool for backfill compaction in utility trenches, bridge approach embankments, retaining wall backfill, and other confined construction zones.
Stabilized and Treated Material Evaluation
The DCP can evaluate weak stabilized or modified materials — soils treated with lime, cement, or fly ash during the early stages of curing before the material becomes too hard for cone penetration. Testing at 7-day and 28-day curing periods provides a direct measure of the strength gain rate of the stabilized layer, confirming that the treatment design is achieving the specified CBR improvement. Once the treated material achieves a CBR exceeding approximately 80-100, the DCP will encounter refusal, and the layer should be considered meeting the design strength requirements.
Layer Strength Profiling with DCP
The ability to identify distinct pavement layers and determine the strength of each layer individually is one of the most powerful applications of DCP testing. Unlike bulk tests that provide only the composite strength of the entire pavement structure, the DCP provides a depth-resolved strength profile that reveals the contribution of each layer to overall pavement performance.
Identifying Layer Boundaries
When DCPI is plotted against cumulative depth on a graph, layer boundaries appear as distinct changes in slope. The DCPI within a layer should be relatively consistent (though some scatter is expected, especially in granular materials), then abruptly change at the layer interface. The exact interface depth is difficult to define because a transition zone of 25-50 mm thickness typically exists between layers due to construction interlayer mixing (blending of base and subgrade during compaction) and stress distribution effects at the layer boundary.
The USACE recommends the following approach for identifying layer boundaries from DCP data:
Plot cumulative blows (X-axis) vs. cumulative penetration depth (Y-axis).
Identify straight-line segments on the plot — each segment represents a distinct layer.
Where two straight-line segments intersect, draw a horizontal line to the Y-axis — this is the layer boundary depth.
Compute the DCPI for each layer from the slope of the corresponding segment.
Convert DCPI to CBR and other parameters using the appropriate correlations.
This graphical approach minimizes the influence of transition zone measurements on layer strength determination because the transition data points fall between the two straight-line segments and are effectively excluded from both.
Layer Strength Selection
Once layer boundaries have been identified and the DCPI for each layer computed, the engineer must select a representative strength value for each layer. The USACE recommends the following procedure:
For each layer, plot all individual DCPI-derived CBR values against depth.
Ignore the first 75-150 mm of data (surface confinement effect for the top layer) and the transition zone data at the top of each subsequent layer.
Select a CBR value such that one-half to two-thirds of the data points within the layer are at or above the selected value.
This produces a conservative estimate of layer strength that accounts for the natural variability within the layer while avoiding the risk of selecting an unrepresentative weak or strong data point.
For design applications, the 75th or 85th percentile CBR within a layer is typically selected as the design value, depending on the desired reliability level. The 85th percentile is standard for high-traffic facilities (airport runways, interstate highways) while the 75th percentile is used for lower-volume roads.
Multi-Layer Profiling Examples
A typical DCP test on a flexible pavement with a granular base over subgrade might produce the following profile:
Layer 1 — Surface granular base (0-250 mm): A stable DCPI of 3-5 mm/blow, indicating CBR of approximately 45-60%. This base is in good condition with adequate strength to support the asphalt layer.
Layer 2 — Subgrade (250-1000 mm): A transition between 250-300 mm, then a stable DCPI of 8-12 mm/blow in the upper subgrade (300-600 mm), increasing slightly to 5-8 mm/blow in the lower subgrade (600-1000 mm). The upper subgrade (300-600 mm) shows CBR of approximately 18-25%, while the lower subgrade shows CBR of 25-40%. This suggests a compacted subgrade layer (upper) over a stronger natural subgrade (lower), possibly due to higher moisture in the upper subgrade from pavement infiltration.
Interpretation: The base is adequate. The subgrade shows moderate strength with a slightly weaker zone in the upper 300-600 mm. No structural deficiency is indicated. The pavement is likely in fair condition with the observed distress possibly related to surface age (oxidative cracking) rather than structural inadequacy.
DCP for Existing Pavement Layer Identification
In forensic applications where construction records are unavailable, the DCP can identify the thickness and strength of each existing pavement layer without excavation. The DCPI profile reveals: the surface treatment or thin seal (if present, DCPI = 0-2 mm/blow with rapid refusal), the granular base (DCPI = 2-8 mm/blow, depending on aggregate type and density), the subbase (DCPI = 5-15 mm/blow), and the subgrade (DCPI = 10-50+ mm/blow). Layer thickness can be determined to within ±25 mm accuracy. This capability is invaluable for pavement management systems where a large number of pavement sections require structural evaluation without the cost of full-depth coring and laboratory testing.
DCP vs FWD vs Laboratory Testing
The DCP is one of three primary methods for evaluating pavement layer strength, each with distinct advantages and limitations. Understanding the differences between DCP, Falling Weight Deflectometer (FWD), and laboratory testing enables the engineer to select the most appropriate method — or combination of methods — for each project.
Comparison Summary
Parameter
DCP (ASTM D6951)
FWD (ASTM D4694)
Laboratory Testing
Load type
Dynamic impact (cone)
Dynamic impulse (plate)
Static/cyclic (triaxial)
Measured parameter
Penetration rate (mm/blow)
Deflection (microns)
Stress-strain behavior
Derived parameter
CBR, Mr, bearing capacity
Layer moduli (backcalculated)
Mr, CBR, Poisson’s ratio
Depth of evaluation
0-1 m (extendable)
0-3 m (full pavement structure)
Depends on specimen height
Layer identification
Direct (DCPI depth profile)
Indirect (backcalculation)
Direct (individual layers)
Test duration
3-5 minutes
1 minute
Hours to days
Productivity
10-20 tests/hour
50-100 tests/day
1-3 tests/week
Equipment cost
$2,000-$3,000
$80,000-$150,000
$50,000-$200,000
Operator training
1 day
1-2 weeks
Months
Destructive?
Yes (20 mm hole)
No
Yes (disturbed/undisturbed)
Bound layers?
No (core access needed)
Yes
Yes
Granular materials?
Yes (particles < 50 mm)
Yes
Difficult (large specimens)
Fine-grained soils?
Yes
Yes
Yes
DCP vs FWD
The DCP measures point-specific, depth-resolved strength in unbound materials, while the FWD measures the composite structural response of the entire pavement system under a simulated wheel load. The DCP is ideal for: (1) detailed layer profiling at isolated points, (2) forensic investigation of localized distress, (3) construction QC on unbound layers, and (4) low-budget projects where FWD testing cannot be justified. The FWD is ideal for: (1) network-level pavement evaluation (thousands of tests on a highway or airport system), (2) evaluation of existing pavements with intact bound layers, (3) overlay thickness design using backcalculated moduli, and (4) load capacity determination through deflection basin analysis.
For comprehensive pavement evaluation programs, the optimal strategy combines the two methods: FWD provides network-level structural screening and identifies areas of concern; DCP provides detailed depth-resolved profiling at the identified areas to determine which layer is responsible for the deficiency. This tiered approach maximizes value by applying the faster method (FWD) for broad coverage and the more detailed method (DCP) for focused investigation.
DCP vs Laboratory Testing
Laboratory testing of undisturbed samples (thin-walled tube samples for fine-grained soils, block samples or large-diameter cores for granular materials) provides the most accurate and complete characterization of material properties. The repeated-load triaxial test (AASHTO T307) determines the resilient modulus and Poisson’s ratio at multiple stress levels, providing the stress-dependent constitutive parameters required for mechanistic pavement design. Laboratory soaked CBR (ASTM D1883) provides the design CBR used by most empirical pavement design methods.
However, laboratory testing has fundamental limitations: (1) sample disturbance during extraction, transportation, and preparation can alter soil structure, particularly in sensitive clays and loose sands; (2) sampling artifacts from stress relief, moisture change, and handling can produce results that differ significantly from in-situ conditions; (3) the cost and time for laboratory testing (typically $200-$500 per Mr test, 2-4 weeks turnaround) limits the number of tests that can be performed; and (4) the spatial coverage is limited by the number of sampling locations.
The DCP overcomes these limitations by testing the material in its natural state at many locations for minimal cost. The trade-off is reduced precision and the reliance on empirical correlations. The most effective pavement evaluation programs use the DCP for broad spatial coverage (testing at many locations to assess variability and identify weak zones) and laboratory testing on selected samples for calibration and refinement of the DCP correlations for local materials.
An Integrated Testing Framework
For major pavement evaluation projects, a tiered testing framework establishes confidence in the results while controlling costs:
Tier 1 — FWD Network Screening: FWD tests at 50-200 m intervals across the entire facility to identify structural segments and prioritize sections for detailed investigation.
Tier 2 — DCP Detailed Profiling: DCP tests at 3-5 locations per identified segment to determine layer thicknesses and strengths, identify the weak layer(s), and provide data for rehabilitation design.
Tier 3 — Laboratory Calibration: Select undisturbed samples from 2-3 representative locations per major soil type for laboratory Mr and CBR testing. Compare laboratory results with DCP-derived values to establish site-specific correlation adjustments.
This framework provides the spatial coverage of FWD, the depth resolution of DCP, and the accuracy of laboratory testing, giving the engineer the highest confidence in the evaluation results at the lowest total cost.
DCP in Airport Pavement Evaluation
Airport pavements present unique evaluation challenges due to the high wheel loads, high tire pressures, and wide gear configurations of modern aircraft. The DCP has been adopted by the Federal Aviation Administration (FAA) , the International Civil Aviation Organization (ICAO) , and the U.S. Air Force for rapid in-situ evaluation of airfield pavement subgrade and base layers.
FAA Standards and Guidance
The FAA references DCP testing in Advisory Circular AC 150/5320-6G (Airport Pavement Design and Evaluation, June 2021) and AC 150/5370-10H (Standards for Specifying Construction of Airports). Per AC 150/5320-6G Section 2.3.9.12, the DCP is an acceptable method for determining subgrade and base strength during pavement evaluation. The FAA specifies the use of ASTM D6951 procedures with the 8-kg (17.6 lb) hammer and the USACE DCP-CBR correlation (CBR = 292/DCPI^1.12).
For airport pavement evaluation, DCP testing is typically performed through cored holes in the existing pavement surface. The FAA recommends testing at a minimum of three locations per pavement section, with sections defined as areas of uniform construction, traffic, and performance. For runways serving Code C and above aircraft (wingspan > 24 m), the testing density should be higher — typically one test per 500-1000 m² of pavement area in critical zones (touchdown zone, runway centerline, taxiway centerline).
ICAO ACR-PCR Methodology
ICAO introduced the Aircraft Classification Rating — Pavement Classification Rating (ACR-PCR) method in 2020 to replace the older ACN-PCN system for reporting pavement bearing strength. The ACR-PCR method classifies subgrade strength into four categories based on the subgrade CBR value:
ICAO Subgrade Category
CBR Range (%)
Typical Subgrade Type
A — High
> 15
Dense sand, gravel, stiff clay
B — Medium
8-15
Medium clay, silty sand, loose sand
C — Low
4-8
Soft clay, loose silt, low-density sand
D — Ultra Low
< 4
Very soft clay, organic soil, peat
The DCP provides a direct method for determining the subgrade CBR category for ACR-PCR reporting. A single DCP test can determine the subgrade classification at a specific location, and multiple tests across the pavement area establish the representative subgrade category for the entire facility. The DCP is particularly valuable for this application because it can measure subgrade CBR at depth through the pavement structure without requiring full-depth excavation.
Airside Safety and Operational Considerations
DCP testing in operational airside areas requires careful coordination with air traffic control (ATC) and adherence to airport security requirements. Testing on active runways is typically performed during scheduled runway closures (usually nighttime hours at major airports) or during the lowest traffic periods. For taxiways, testing can often be performed with the taxiway open but with escort by airport operations vehicles. All DCP equipment must be Foreign Object Debris (FOD) controlled — cone tips, O-rings, and tools must be accounted for before and after testing to prevent FOD on the movement area.
The depth of DCP testing on airport pavements is typically 800-1000 mm (32-39 in) to ensure characterization of the full subgrade influence zone for aircraft wheel loads. For Code F aircraft (Airbus A380, Boeing 777-9), the depth of influence of wheel loads extends to approximately 2-3 m, requiring either the use of DCP drive rod extensions (with the associated correlation limitations) or supplementary testing with a static cone penetrometer (CPT) or borehole for deeper characterization.
Case Study: Runway DCP Evaluation for Overlay Design
A representative case study illustrates the application of DCP to airport pavement evaluation. A 3000 m runway constructed in 1985 with 200 mm asphalt over 300 mm granular base over sandy subgrade required evaluation for a structural overlay to accommodate Code E aircraft. Initial PCI surveys indicated moderate fatigue cracking and rutting in the center 1000 m of the runway. DCP testing at 50 m intervals along the centerline and at both edges (60 test locations total) was performed through cored holes in the asphalt.
Results showed:
Base course (200-500 mm depth): Average DCPI of 4 mm/blow, equivalent CBR of approximately 35%. The base was in adequate condition with no significant moisture damage.
Upper subgrade (500-700 mm depth): Average DCPI of 15 mm/blow, equivalent CBR of approximately 13%. This indicated the compacted subgrade layer.
Lower/natural subgrade (700-1000 mm depth): DCPI of 25-40 mm/blow, CBR of 5-8% in the center 1000 m segment where distress was observed. Edge locations showed DCPI of 12-18 mm/blow (CBR 12-18%) at the same depth.
The DCP data revealed that the natural subgrade in the runway center had weakened over time — likely from progressive moisture accumulation through the pavement structure during the 35-year service life. The overlay design was adjusted to include subgrade improvement (cement stabilization of the upper 300 mm of subgrade) in the center 1000 m, while the edges required only a conventional asphalt overlay. The targeted treatment saved approximately $2.5 million compared to uniform subgrade improvement across the full runway width.
This case demonstrates the unique value of DCP testing in airport pavement evaluation: it provides depth-resolved strength data at sufficient spatial density to identify non-uniform conditions, enabling targeted rehabilitation strategies that optimize capital investment.
Summary
The Dynamic Cone Penetrometer (DCP) is an essential field instrument for geotechnical and pavement engineers, providing rapid, reliable, and economical in-situ strength assessment of soils and unbound pavement materials. Governed by ASTM D6951/D6951M and adopted by the U.S. Army Corps of Engineers, the FAA, ICAO, and highway agencies worldwide, the DCP measures the penetration rate (mm/blow) of a standard 60-degree cone driven by an 8-kg (17.6 lb) hammer dropped from 575 mm (22.6 in). The penetration rate, or DCP Penetration Index (DCPI) , is converted to California Bearing Ratio (CBR) using the USACE correlation CBR = 292/DCPI^1.12 (or log CBR = 2.48 - 1.057 log DCPI), and from CBR to resilient modulus (Mr) using relationships such as Mr (MPa) = 10.34 × CBR.
The DCP serves four primary applications: (1) pavement forensic investigation — identifying the root cause of distress through depth-resolved strength profiling; (2) construction quality control — verifying that compacted layers meet strength specifications and assessing uniformity across construction areas; (3) layer strength profiling — determining individual layer thicknesses and strengths for design and rehabilitation; and (4) airport pavement evaluation — establishing subgrade strength categories for ICAO ACR-PCR reporting and providing data for FAA overlay design.
The DCP’s limitations include its depth restriction (~1 m standard), inability to penetrate bound or highly cemented materials, sensitivity to surface confinement effects, reliance on empirical correlations with inherent scatter (±50% at 95% confidence), and point-specific measurement requiring multiple tests for spatial characterization. Despite these limitations, the DCP fills a critical niche between the speed of FWD testing and the accuracy of laboratory testing, and an integrated testing framework combining all three methods provides the most comprehensive and cost-effective pavement evaluation.
Frequently Asked Questions
The fundamental difference is the mode of penetration. The DCP drives the cone into the soil by repeatedly dropping a hammer of known mass (8 kg or 4.6 kg) from a fixed height (575 mm), producing a dynamic impact force that pushes the cone downward. The penetration rate (mm per blow) is recorded. The CPT (Cone Penetration Test), governed by ASTM D5778, pushes a 35.7 mm diameter cone with a 10 cm² base area into the ground at a constant rate of 20 mm/s using a hydraulic thrust system mounted on a heavy truck. The CPT continuously measures tip resistance (qc), sleeve friction (fs), and pore pressure (u2) with depth, providing detailed soil behavior type classification. DCP is lighter, cheaper, and faster (3-5 minutes per test) but shallower (maximum 1 meter typical), while CPT requires heavy equipment, reaches 30-50 meters depth, and provides higher-resolution soil profiling.
The most widely used correlation was developed by the U.S. Army Corps of Engineers: CBR = 292 / (DCPI)^1.12, where DCPI is the penetration rate in mm/blow. An alternative logarithmic form is log(CBR) = 2.48 - 1.057 log(DCPI). For CL soils with CBR < 10%, the USACE recommends CBR = 3452 / (DCPI)^2 (R² = 0.94). For CH soils, CBR = 348 / DCPI (R² = 0.98). The Transport Research Laboratory (TRL) in the UK uses log(CBR) = 2.954 - 1.496 log(DCPI). The selection of the appropriate correlation depends on soil type and is a matter of professional judgment per ASTM D6951.
The DCP consists of: (1) a 15.8 mm (5/8 in) diameter steel drive rod, typically 1 meter long; (2) a replaceable cone tip with 60-degree included angle and 20 mm (0.79 in) base diameter; (3) an 8-kg (17.6 lb) sliding hammer with a drop height of 575 mm (22.6 in); (4) an anvil and coupler assembly that transfers the impact force from the hammer to the drive rod; (5) a handle at the top that also serves as the hammer stop; and (6) a graduated scale or measuring rod. Optional components include a 4.6-kg (10.1 lb) light hammer for soft soils, disposable cone tips (held by O-ring) for difficult extraction conditions, drive rod extensions for deeper testing, and an extraction jack for removing the rod after testing.
Yes, per ASTM D6951 Section 6.3.2, a rotary hammer drill or coring apparatus capable of drilling a minimum 25 mm (1 in) diameter hole is used to core through the bound layer. The DCP tip is then advanced through the cored hole to reach the underlying unbound layer. The coring fluid (water) must be removed immediately using a wet/dry vacuum, and the DCP test should be performed within 10 minutes of completing the coring operation to prevent the fluid from soaking into and weakening the material to be tested. For thin seals (chip seals, slurry seals, surface treatments less than approximately 25 mm thick), the DCP tip can be advanced directly through the seal without coring.
Per ASTM D6951, the DCP is typically used to assess material properties down to a depth of 1000 mm (39 in) below the surface. This depth corresponds to the standard 1-meter drive rod length. Deeper penetration can be achieved using drive rod extensions, but the user must exercise caution: the mass and inertia of the device change with extensions, skin friction develops along the extended rod length, and the empirical correlations (CBR = 292/DCPI^1.12, etc.) were developed for the standard 1-meter rod configuration. Extended DCP testing should be considered a qualitative assessment or compared against calibrated reference measurements.
Key limitations include: (1) The DCP cannot penetrate highly stabilized or cemented materials or granular materials containing aggregate larger than 50 mm (2 in); (2) Skin friction on the drive rod can artificially increase penetration resistance in cohesive CH soils beyond 300 mm depth, creating a stair-stepping effect where CBR appears to increase with depth erroneously; (3) Surface confinement affects the first 75-150 mm of penetration, requiring the top readings to be excluded from layer strength analysis; (4) The device may deflect from vertical (slanted penetration) in heterogeneous granular materials, and testing must stop if deviation exceeds 150 mm from vertical; (5) The DCP provides point-specific measurements requiring multiple tests for spatial variability assessment; (6) The obtained CBR is an in-situ field CBR that does not correlate directly with laboratory soaked CBR.
DCP and FWD are complementary tests. The DCP provides a direct strength profile with depth (layer-by-layer CBR/thickness), requires no backcalculation, operates on any unbound surface, and costs significantly less (DCP: ~$2,000 vs. FWD: $80,000+). However, DCP tests only unbound layers, has a maximum depth of ~1 m, provides point-specific data, and is destructive (creates a 20 mm hole). FWD tests through the complete pavement structure (bound + unbound), measures deflection basin under simulated wheel loads, evaluates larger volumes of material per test, and is nondestructive. FWD requires heavy equipment and trained operators and relies on backcalculation (inverse analysis) to determine layer moduli. For comprehensive pavement evaluation, DCP is often used for detailed layer profiling while FWD provides network-level structural capacity assessment.
Per ASTM D6951, the DCP can be used to estimate strength characteristics of fine-grained soils (clays, silts, loams), coarse-grained soils (sands, gravels with particles < 50 mm), granular construction materials (crushed stone, gravel base, sand subbase), and weak stabilized or modified materials (lime-treated or cement-treated soils with unconfined compressive strength < approximately 2 MPa). The DCP cannot be used in highly stabilized or cemented materials (concrete, asphalt, deep soil mixing columns), solid rock or bedrock, frozen ground, and granular materials with a large percentage of aggregates greater than 50 mm (2 in). For very soft soils (CBR < 3), the optional 4.6-kg (10.1 lb) hammer should be used to avoid excessive penetration per blow.
The required number of DCP tests depends on the project scope, soil variability, and quality assurance requirements. For pavement forensic investigation, a minimum of 3-5 DCP tests per distress type or homogeneous section is recommended. For construction quality control (compaction verification), DOT specifications typically require 1 DCP test per 200-500 linear meters of pavement per lane, or 1 test per 2000-5000 m² of runway area for airfield projects. For site characterization of subgrade strength, statistical approaches require 6-10 tests per soil type to achieve 75th percentile reliability. The U.S. Army Corps of Engineers recommends that DCP testing locations be randomized and spaced no closer than 300 mm (12 in) to avoid disturbance effects from adjacent tests.
The primary international standard is ASTM D6951/D6951M - Standard Test Method for Use of the Dynamic Cone Penetrometer in Shallow Pavement Applications. The U.S. Army Corps of Engineers also maintains its own protocol in TM 5-530 and UFC 3-260-03. In the United Kingdom, BS 1377-9 (Methods of Test for Soils for Civil Engineering Purposes — In-Situ Tests) provides a similar procedure. South Africa developed the DCP method for pavement evaluation under the Council for Scientific and Industrial Research (CSIR) and Technical Methods for Highways (TMH6). The FAA references DCP testing in AC 150/5320-6G (Airport Pavement Design and Evaluation) as an acceptable method for subgrade strength assessment. Many national highway agencies including those in Australia, New Zealand, India, and Kenya have developed their own DCP standards and correlations.
Need Subgrade Strength Testing for Your Pavement Project?
Our team provides expert DCP field testing, data analysis, CBR correlation, and pavement evaluation services for airport runways, highways, and heavy-duty pavements. Contact us for reliable in-situ soil strength assessment anywhere in the world.
The sand cone test is a volumetric method for determining in-place density of compacted soil by excavating a small hole, weighing the removed soil, and measurin...
Light Weight Deflectometer (LWD) for Construction QC
The Light Weight Deflectometer (LWD) is a portable non-destructive testing device that drops a known weight onto a loading plate to measure surface deflection a...
Nuclear Density Gauge for Soil and Asphalt Density
The nuclear density gauge is a field instrument that uses gamma radiation and neutron thermalization to measure in-place density and moisture content of soil, a...
32 min read
Geotechnical testing
Pavement quality control
+3
Cookie Consent We use cookies to enhance your browsing experience and analyze our traffic. See our privacy policy.