Chloride Content Testing in Concrete
Chloride content testing determines the concentration of chloride ions at various depths in concrete, indicating corrosion risk to reinforcement. Total chloride...
30 min read
Concrete Testing
Corrosion
+3
Concrete electrical resistivity measures the material’s resistance to ionic current flow, providing an indirect indication of corrosion risk — low resistivity correlates with high corrosion rate. It is a rapid NDT complement to half-cell potential. Covers resistivity measurement (Wenner four-probe; disc method), interpretation, and correlation with chloride diffusion and corrosion rate.
Concrete electrical resistivity (ρ) is an inherent material property that quantifies how strongly concrete opposes the flow of ionic current when subjected to an electrical field. Unlike metallic conductors where current flows via free electron movement, concrete is an ionic conductor — electrical current is transported exclusively by ions dissolved in the pore solution, primarily sodium (Na⁺), potassium (K⁺), calcium (Ca²⁺), and hydroxyl (OH⁻) ions. The solid phases of hydrated cement paste — calcium-silicate-hydrate (C-S-H), calcium hydroxide (CH), ettringite, and unhydrated cement particles — together with aggregate particles are essentially insulating or non-conductive relative to the pore solution.

The fundamental relationship governing resistivity measurements is ρ = γ × R, where R is the measured electrical resistance in ohms (Ω) and γ is a geometrical factor that depends on the size, shape, and configuration of the test setup. The electrical resistivity of fully saturated concrete ranges from approximately 1 to 10 kΩ·cm (10 to 100 Ω·m) for highly porous concrete up to more than 1,000 kΩ·cm (greater than 10,000 Ω·m) for very dense, dry, high-performance concrete. The pore solution resistivity itself typically falls in the range of 0.05 to 0.3 Ω·m depending on the alkali concentration of the cement and the presence of supplementary cementitious materials.
Concrete exhibits significant capacitive properties — it can store electrical charge at the electrode-concrete interface and at the pore-solution to solid-phase interface within the specimen. When direct current (DC) is applied, high polarization effects occur at these interfaces, corrupting the measurement. Therefore, alternating current (AC) must be used for reliable resistivity testing. AC introduces reactance into the measurement, so the concept of electrical impedance (Z) must be considered — a complex number representing the vector sum of resistance (R) on the real axis and reactance (X) on the imaginary axis. Only the normal (real) resistance component corresponds to ionic movement in the pore network and can be reliably correlated with durability characteristics.
The formation factor (F) provides a more fundamental relationship that isolates microstructural quality from pore solution chemistry effects: F = ρ_concrete / ρ_pore_solution = 1 / (φ × β), where φ is the concrete porosity and β is the pore connectivity (tortuosity) factor. A finer pore network with less connectivity leads to lower permeability and higher resistivity. A porous microstructure with larger interconnected capillaries results in higher permeability, lower resistivity, and reduced durability. This formation factor approach, detailed in FHWA-HRT-19-030, enables more reliable comparisons between different concrete mixtures because it removes the influence of varying pore solution conductivity.
The Wenner four-probe (four-point) method is the most widely accepted technique for measuring surface electrical resistivity of concrete. Originally developed for geological and soil resistivity applications in the early 20th century by Frank Wenner of the U.S. National Bureau of Standards, it was adapted for concrete testing in the 1980s and is now the basis for AASHTO T 358 (formerly AASHTO TP 95). Four equally spaced electrodes are arranged in a straight line with spacing (a). The two outer electrodes apply an alternating current (I) to the concrete, while the two inner electrodes measure the resulting electrical potential difference (V). Resistance is calculated per Ohm’s Law as R = V/I, and resistivity for a semi-infinite homogeneous half-space is computed as ρ = 2π × a × R.
AASHTO T 358 specifies a standard electrode spacing of 38.1 mm (1.5 in) with an AC frequency of 13 Hz. For standard 100 × 200 mm (4 × 8 in) cylinders, a geometry correction factor of 1.1 is applied to account for the finite specimen boundaries. The specimen must be in a saturated surface dry (SSD) condition at the time of testing. The cylinder is divided into four equally spaced longitudinal lines, and two readings are taken on each line (one in forward direction, one reversed), yielding 8 total readings per specimen that are averaged to obtain the representative surface resistivity value. For 150 × 300 mm (6 × 12 in) cylinders, different correction factors apply. The standard correction factors are valid when the specimen diameter-to-probe-spacing ratio (d/a) is ≤ 4.0 and the specimen length-to-probe-spacing ratio (L/a) is ≥ 5.0. For specimens outside these ratios, numerical or experimental calibration is required.
For field use on in-situ structures, the Wenner probe is placed directly on the concrete surface. Critical considerations for field measurements include: positioning the probe diagonally between reinforcing bars to minimize interference from the highly conductive steel (errors up to a factor of 2 to 6 can occur if probes are directly over rebar), avoiding cracks that increase measured conductivity, accounting for surface carbonation that increases resistivity, and ensuring consistent moisture conditions across the survey area.
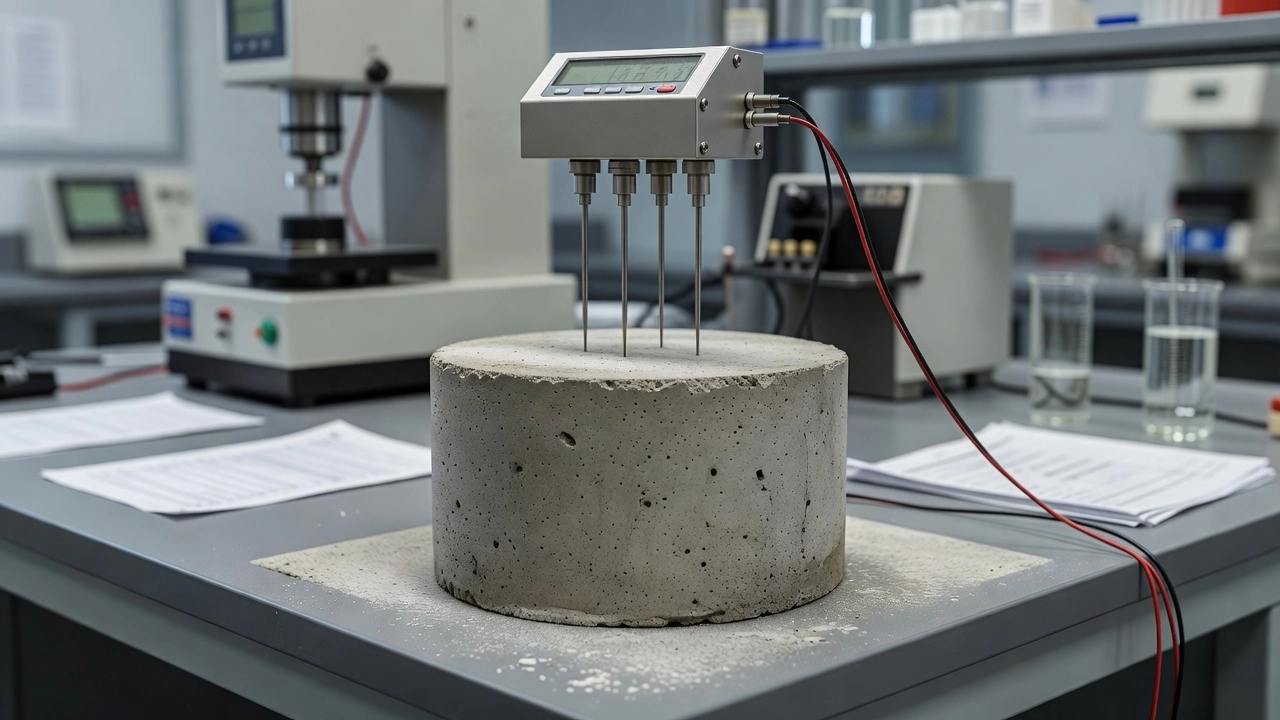
The uniaxial bulk resistivity method measures the entire volume of a concrete specimen between two parallel plate electrodes. Standardized under ASTM C1760-12 (“Standard Test Method for Bulk Electrical Conductivity of Hardened Concrete”) and the newer ASTM C1876-24 (“Standard Test Method for Bulk Electrical Resistivity or Bulk Conductivity of Concrete”), this method places a vacuum-saturated cylindrical specimen between two metal plate electrodes with conductive foam or sponge contacts to ensure good electrical coupling. An AC current is applied at a specified frequency, and the resulting voltage drop is measured.
The bulk conductivity (σ) is calculated as σ = G × (L/A), where G is the measured conductance in Siemens (G = I/V), L is the specimen length, and A is the cross-sectional area (π × d²/4 for cylindrical specimens). Bulk resistivity is then the reciprocal: ρ = 1/σ = R × (A/L). The result is expressed in Ω·m or kΩ·cm. ASTM C1876 directly measures bulk electrical resistivity (the inverse of conductivity per C1760) and is becoming the preferred method. For standard 100 × 200 mm cylinders, the geometry factor (A/L) = (π × 100²/4) / 200 = 39.27 mm.
The bulk method provides a more homogeneous representation of concrete quality averaged through the entire cross-section, making it less sensitive to surface anomalies than the Wenner method. However, it is limited to laboratory testing of cylinders or cores and cannot be used on in-situ structures without extracting specimens.
For long-term monitoring of concrete resistivity over time, embedded sensors can be cast directly into the concrete during construction. These typically consist of two or four electrodes embedded at known spacing within the concrete cover zone. The sensors are connected to a data acquisition system that periodically measures resistance between the electrodes and computes resistivity using the known geometry factor. Embedded sensors enable continuous monitoring of resistivity development with age, detection of moisture changes, and assessment of curing effectiveness. Systems such as the Giatec RCON® and various embeddable resistivity probes are commercially available for this purpose.
AASHTO T 358-19 (“Standard Method of Test for Surface Resistivity Indication of Concrete’s Ability to Resist Chloride Ion Penetration”) provides the complete procedural framework for Wenner four-probe testing of concrete cylinders. The specimen preparation requires moist curing per ASTM C192 or equivalent, with testing performed at the specified age (typically 28 or 56 days). Specimens must be in saturated surface dry (SSD) condition — this is critical for obtaining repeatable and comparable results. The procedure involves marking four equally spaced longitudinal lines on the cylinder, taking two readings per line (forward and reverse directions), and computing the average of all 8 readings. A correction factor of 1.1 is applied for standard 100 × 200 mm lime-water cured cylinders. Alternative frequencies and probe spacings may be specified for different applications.
The classification table from AASHTO T 358 provides five levels of chloride ion penetrability:
| Chloride Ion Penetrability | Surface Resistivity (kΩ·cm) for 4×8 in cylinder | Equivalent ASTM C1202 (coulombs) |
|---|---|---|
| High | Less than 12 | Greater than 4,000 |
| Moderate | 12 to 21 | 2,000 to 4,000 |
| Low | 21 to 37 | 1,000 to 2,000 |
| Very Low | 37 to 254 | 100 to 1,000 |
| Negligible | Greater than 254 | Less than 100 |
This classification enables rapid screening of concrete quality without the 6-hour test duration and associated heating problems of the Rapid Chloride Permeability Test (RCPT, ASTM C1202).
ASTM C1760-12 measures bulk electrical conductivity (the inverse of resistivity) of saturated hardened concrete. Specimens (standard 100 × 200 mm cylinders or cores) undergo vacuum saturation per ASTM C1202 requirements before testing. The saturated specimen is placed between two parallel plate electrodes, an AC current is applied, and conductance is measured. The test takes less than 2 minutes once the specimen is prepared.
ASTM C1876-24 directly measures bulk electrical resistivity. It specifies AC frequency selection to minimize polarization effects, and results are expressed in Ω·m or kΩ·cm. The standard states that the electrical resistivity of concrete is the opposition to the movement of ions under an applied electric field, and this test method provides a rapid indication of concrete’s resistance to chloride ion penetration.
Key comparison with RCPT (ASTM C1202): The RCPT requires 6 hours of testing time plus 18+ hours of specimen preparation (vacuum saturation). The applied 60 V DC causes Joule heating that can raise the specimen temperature by 20°C or more, altering the pore solution chemistry and invalidating the results for some mixtures, particularly those containing supplementary cementitious materials or corrosion inhibitors. Resistivity testing eliminates all of these problems — the test takes under 2 minutes, uses low-voltage AC that prevents polarization and heating, and the same specimen can subsequently be used for compressive strength testing since the method is nondestructive.
AASHTO PP 84-18 (“Standard Practice for Developing Performance Engineered Concrete Pavement Mixtures”) incorporates resistivity testing into a performance-engineered framework using the formation factor concept. It specifies three approaches for determining pore solution resistivity: (1) experimental measurement by expressing pore solution from the concrete and measuring its resistivity directly, (2) using the NIST model (Bentz model) based on mixture proportions to predict pore solution resistivity, or (3) assuming a default value of 0.1 Ω·m per PP 84. A fourth approach, the “bucket test,” cures specimens in a synthetic solution matching the expected pore solution composition, thereby eliminating the need for separate pore solution measurement.
Concrete resistivity provides a well-established indicator of corrosion risk for embedded steel reinforcement. The fundamental principle is that higher electrical resistivity restricts the flow of ions between anodic and cathodic sites on the reinforcing steel, thereby slowing the electrochemical corrosion reactions. The relationship between resistivity and corrosion rate follows an inverse proportionality: i_corr ≈ k / ρ, where i_corr is the corrosion current density in μA/cm² and k is a material-dependent constant typically ranging from 0.03 to 0.3 V depending on concrete composition and environmental conditions.
| Resistivity (kΩ·cm) | Resistivity (Ω·m) | Corrosion Risk (RILEM TC 154-EMC) |
|---|---|---|
| Greater than 100 | Greater than 1,000 | Negligible |
| 50 to 100 | 500 to 1,000 | Low |
| 10 to 50 | 100 to 500 | Moderate |
| Less than 10 | Less than 100 | High |
The Morris et al. classification provides a more conservative three-tier system: active corrosion is occurring when ρ is less than 10 kΩ·cm, moderate risk exists when ρ is between 10 and 30 kΩ·cm, and low probability of corrosion when ρ exceeds 30 kΩ·cm. The Langford and Broomfield classification, widely cited in corrosion engineering practice, defines corrosion rate as very high for ρ below 5 kΩ·cm, high for ρ between 5 and 10 kΩ·cm, low to moderate for ρ between 10 and 20 kΩ·cm, and low for ρ above 20 kΩ·cm. These threshold values are validated by numerous studies including Bazant, Alonso, Andrade, and Glass, though the relationship remains concrete-composition dependent — different mixtures with the same measured resistivity may exhibit different corrosion rates.
Temperature significantly affects resistivity through its influence on ion mobility in the pore solution. A temperature change of 1°C results in approximately a 3% change in electrical resistivity. The Arrhenius-based temperature correction equation is:
ρ(T) = ρ(T_ref) × exp[(E_a/R) × (1/T - 1/T_ref)]
Where E_a is the activation energy of conduction averaging approximately 27.4 kJ/mol for a range of concrete mixtures (per Coyle et al., RILEM 2016), R is the universal gas constant (8.314 J/(mol·K)), T is the temperature in Kelvin, and T_ref is the reference temperature (typically 23°C = 296 K). The activation energy ranges from approximately 25 to 32 kJ/mol depending on mixture composition — higher ionic strength in the pore solution produces lower activation energy and less temperature sensitivity, while lower ionic strength produces higher activation energy and greater temperature sensitivity.
Moisture content is the single most influential factor on in-situ resistivity readings. Wet concrete can exhibit 10 to 100 times lower resistivity than the same concrete when dry. The concrete resistivity range spans from 10¹ to 10⁶ Ω·m depending primarily on moisture content. Full saturation is required for standardized testing per AASHTO T 358 and ASTM C1760 to obtain repeatable, comparable results. For field measurements, the saturation state must be documented and interpreted accordingly. Carbonation in ordinary portland cement concrete induces a significant increase in resistivity because the CO₂ reaction reduces OH⁻ ion concentration in the pore solution, though carbonated concrete in sufficiently wet conditions can still support high corrosion rates despite the higher measured resistivity.
The Nernst-Einstein equation provides a direct theoretical link between electrical resistivity and the chloride diffusion coefficient of concrete:
D_cl = (RT × t_cl) / (z² × F² × ρ × c_cl)
Where D_cl is the chloride diffusion coefficient (m²/s), R is the universal gas constant, T is absolute temperature, t_cl is the transference number of chloride ions, z is the charge number of chloride (z = 1), F is Faraday’s constant (96,485 C/mol), ρ is the electrical resistivity (Ω·m), and c_cl is the chloride concentration in the pore solution. In simplified practical form, this reduces to D_cl ∝ 1/ρ — the chloride diffusion coefficient is inversely proportional to resistivity.
The formation factor approach provides a more fundamental relationship by isolating microstructural effects from pore chemistry: F = ρ_concrete / ρ_pore_solution, and the effective chloride diffusion coefficient D_eff = D_free / F, where D_free is the diffusion coefficient in free solution (approximately 2.03 × 10⁻⁹ m²/s for chloride at 25°C). This demonstrates that the effective chloride diffusion coefficient is directly proportional to the inverse of the formation factor — a purely microstructural parameter that quantifies the quality of the pore network independent of pore solution chemistry.
The FHWA study FHWA-HRT-13-024 evaluated 25 concrete mixtures including plain portland cement (w/c 0.37 to 0.50), binary mixtures with fly ash and slag, and ternary mixtures with limestone powder. Surface resistivity at 28 days ranged from approximately 12 to over 50 kΩ·cm for plain portland mixtures, and from 15 to over 80 kΩ·cm at 56 days for binary and ternary mixtures. The threshold of 21 kΩ·cm was found equivalent to the RCPT threshold of 2,000 coulombs, establishing the boundary between “Moderate” and “Low” chloride penetrability.
The degree of saturation (DOS) follows a well-defined power-law relationship with concrete resistivity, described by the saturation function (Weiss, Snyder, Bullard, Bentz — NIST, 2013):
ρ(S) = ρ_sat × S^(-n)
Where S is the degree of saturation (0 to 1), n is the saturation coefficient (an empirical fitting parameter), and ρ_sat is the resistivity at full saturation. For cement-based materials, the saturation coefficient n typically ranges from 3.5 to 5.0, compared to approximately 2 for rocks and sandstones. This higher coefficient reflects the ink-bottle pore geometry and higher tortuosity of concrete — pore necks are narrower than the pore bodies they connect, so as saturation decreases, the conductive pathways are disrupted more rapidly than in simpler pore networks.
| Material | Saturation Coefficient (n) | Source |
|---|---|---|
| Siltstone | ~2 | Geological literature |
| w/c = 0.50 cement paste | ~3.5 | Rajabipour et al. |
| Mortar (w/c = 0.42) | ~4.15 | Spragg et al., TRB 2013 |
| w/c = 0.35 + 5% silica fume | ~5 | Rajabipour et al. |
| General concrete | 3.5 to 5.0 | Weiss et al., NIST |
Three physical mechanisms change simultaneously as saturation decreases: (1) reduced pore fluid volume provides less medium for ion transport, increasing resistivity; (2) increased pore solution concentration partially offsets the resistivity increase since ions become more concentrated; and (3) reduced connectivity of fluid pathways as air fills narrow pore necks first, disconnecting otherwise connected pore clusters. For practical field measurements, comparisons should be made at consistent moisture conditions. The test area should be moist when taking readings, but testing immediately after rain or during extended dry periods should be avoided to minimize moisture-induced variability.
Resistivity mapping for bridge decks and concrete structures follows systematic surveying procedures to generate spatial representations of resistivity variation. The standard grid spacing for bridge deck evaluation is 2 ft × 2 ft (0.6 m × 0.6 m) per FHWA and SHRP 2 practice. For detailed investigation of specific areas, a denser 1 ft × 1 ft (0.3 m × 0.3 m) grid is used. Per SHRP 2 Report S2-R06A-RR-1, survey lines are established in the longitudinal bridge direction, yielding typically 43 or more test points per line for a standard bridge deck.
The field procedure involves marking the grid on the deck surface using chalk lines, locating reinforcing steel with a cover meter, positioning the Wenner probe diagonally between reinforcing bars to minimize rebar interference, moistening the surface if too dry, taking readings at each grid point, and recording the temperature for potential correction. Collected data is processed to generate contour maps (isoresistivity maps) showing the spatial variation of resistivity across the deck. Temperature correction is applied to all readings (reference to 23°C), and saturation correction is applied if needed. Interpolation between grid points uses kriging or inverse-distance weighting methods, and color contour plots are generated using specialized software.
Interpretation of contour maps: Low resistivity zones (ρ less than 10 to 12 kΩ·cm) identify high corrosion risk areas with more permeable concrete, higher moisture content, and potential active corrosion. Moderate resistivity zones (ρ between 12 and 20 kΩ·cm) indicate uncertain or moderate corrosion risk requiring further investigation. High resistivity zones (ρ greater than 20 kΩ·cm) indicate low corrosion risk areas with denser concrete and well-protected reinforcement. Resistivity mapping does not directly detect delamination, but low resistivity zones often correlate with areas of higher moisture content, higher chloride contamination, more advanced concrete degradation, and increased likelihood of corrosion-induced delamination. The most reliable interpretation combines resistivity data with visual inspection, delamination survey (chain drag, impact echo, or hammer sounding), chloride content analysis, and half-cell potential mapping.
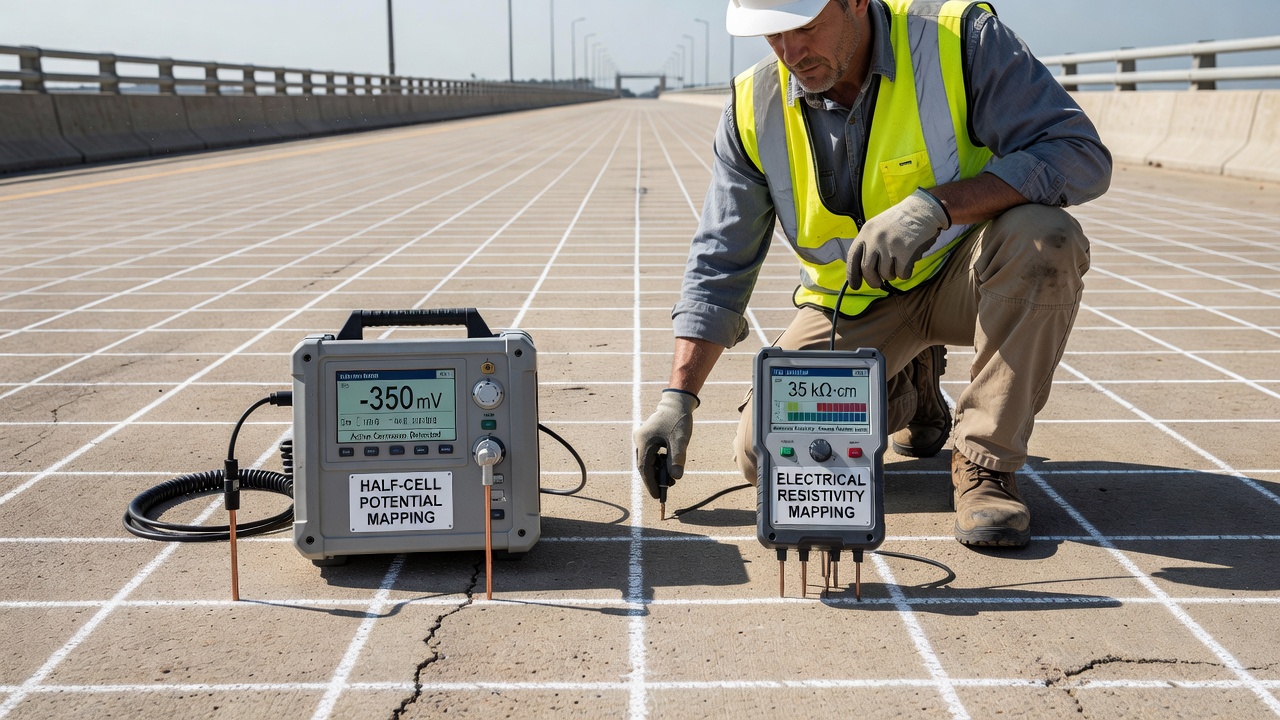
Half-cell potential (HCP) mapping per ASTM C876 and electrical resistivity (ER) mapping are complementary nondestructive evaluation methods that provide different but synergistic information about corrosion condition. HCP measures the corrosion potential (E_corr) of the reinforcing steel against a reference electrode (typically copper/copper sulfate, CSE), providing the thermodynamic probability of active corrosion. ER measures the ionic resistance of concrete to current flow, providing an indication of corrosion risk and potential corrosion rate if corrosion is active.
| Property | Half-Cell Potential (HCP) | Electrical Resistivity (ER) |
|---|---|---|
| What it measures | Corrosion potential of steel vs. reference electrode | Ionic resistance of concrete to current flow |
| Standard | ASTM C876 | AASHTO T 358 / ASTM C1876 |
| Information provided | Probability of active corrosion (thermodynamic) | Risk of corrosion and potential rate if active (kinetic) |
| Unit | mV | kΩ·cm or Ω·m |
| Measures steel condition? | Yes (directly) | No (concrete properties only) |
| Measures concrete quality? | No (only steel potential) | Yes (pore structure, moisture) |
ASTM C876 interpretation for copper/copper sulfate electrode: potentials more positive than -200 mV CSE indicate greater than 90% probability that no corrosion is occurring; potentials between -200 and -350 mV CSE indicate uncertain corrosion activity; potentials more negative than -350 mV CSE indicate greater than 90% probability that corrosion is occurring.
The combined interpretation methodology proposed by Sadowski (2013) defines three area types: Type 1 areas (low ρ below 10 to 20 kΩ·cm plus low E_corr below -350 mV) indicate greater than 90% probability corrosion is occurring — concrete is conductive enough to support active corrosion cells and steel potential confirms active corrosion. Type 2 areas (low ρ plus high E_corr above -200 mV) indicate uncertain probability — concrete could support corrosion but steel is currently passivated, requiring monitoring because corrosion could initiate rapidly if chlorides reach the critical threshold. Type 3 areas (high ρ above 20 kΩ·cm plus high E_corr above -200 mV) indicate less than 10% probability of corrosion — concrete is resistive and protective, steel is passivated.
HCP tells you if corrosion is happening (thermodynamic probability), while ER tells you how fast corrosion could proceed (kinetic potential). Used together, they can identify both active corrosion zones and vulnerable areas at risk of future corrosion. HCP requires electrical connection to the rebar while ER does not, and ER can be measured on unreinforced concrete while HCP cannot. Both methods benefit from the same grid survey approach, and their combined use is recommended by RILEM TC 154-EMC and SHRP 2.
The Second Strategic Highway Research Program (SHRP 2, Report S2-R06A-RR-1) identified and ranked nondestructive evaluation techniques for bridge deck condition assessment. Electrical resistivity was recommended alongside ground penetrating radar (GPR), impact echo (IE), ultrasonic surface waves (USW), and half-cell potential (HCP). The SHRP 2 testing protocol defines a phased approach: Phase 1 — rapid screening using GPR (traffic speed) to identify areas of concern; Phase 2 — detailed evaluation using HCP plus ER on a grid pattern to assess corrosion condition; Phase 3 — confirmation using impact echo or ultrasonic testing for delamination detection; Phase 4 — verification using selected coring and chloride analysis.
The ER-specific field protocol includes: (1) surface preparation to remove loose debris and ensure moisture consistency across the survey area; (2) rebar location using a cover meter to map rebar positions — critical for proper probe placement; (3) probe placement oriented diagonally between rebars at 45° to the rebar grid; (4) standard 2 ft × 2 ft grid spacing with denser 1 ft × 1 ft grids for detailed investigations; (5) temperature recording of both ambient and concrete surface temperature at regular intervals; (6) moisture observation noting surface condition (dry, damp, wet); (7) reference measurements on sound concrete areas; and (8) data processing with temperature correction and contour map generation.
The FHWA study FHWA-HRT-13-024 evaluated surface resistivity testing on 25 concrete mixtures including plain portland, fly ash (Class F and C), and ternary mixtures with limestone powder. The study found excellent correlation between surface resistivity (AASHTO TP 95) and RCPT (ASTM C1202) with R² values exceeding 0.85 for most mixture types. The surface resistivity test could successfully differentiate between high, moderate, low, and very low chloride penetrability levels. High-volume fly ash mixtures showed the highest resistivity values. The correction factor of 1.1 was validated for lime-water cured 100 × 200 mm cylinders. The study recommended surface resistivity as a routine quality control and quality assurance tool, leading to adoption by multiple state departments of transportation (DOTs). The Rutgers Bridge Deck Concrete Study (CAIT-UTC-NC35) tested six bridge deck concrete mixtures with various supplementary cementitious materials and found that surface and bulk resistivity measurements provide consistent results when properly corrected for geometry. SCM mixtures showed 2 to 5 times higher resistivity than plain portland at 56 days, and resistivity increased significantly with age due to continued hydration and pore refinement. The study recommended minimum 56-day testing for SCM mixtures to capture pozzolanic reaction benefits.
Resistivity is highly sensitive to curing quality because continuous moist curing increases the degree of hydration, producing more hydration products that fill capillary pores and reduce porosity and connectivity. This increases resistivity over time. Inadequate curing produces slower resistivity development and lower resistivity at the test age. Properly cured concrete shows consistent resistivity gain. Comparison of field-cured versus laboratory-cured specimens can reveal curing deficiencies in the field. At early ages (1 to 7 days), resistivity increases rapidly as concrete hydrates and pore refinement occurs. During standard curing (7 to 28 days), resistivity continues to increase at a steady rate. Extended curing (28 to 90+ days) produces further increases, especially for SCM mixtures where continued pozzolanic reactions refine the pore structure.
Performance Engineered Mixtures (PEM) specifications using resistivity criteria are increasingly adopted by state DOTs. Example specification criteria include minimum surface resistivity of 21 kΩ·cm at 28 days (Low penetrability) per AASHTO T 358, minimum surface resistivity of 37 kΩ·cm at 56 days (Very Low penetrability) for SCM mixtures, minimum formation factor of 500 per AASHTO PP 84 for PEM compliance, and minimum bulk resistivity of 21 kΩ·cm per ASTM C1876. The NYSDOT has implemented a new concrete specification requiring surface resistivity (AASHTO T 358) for mix development and qualification, as well as final acceptance under Performance Engineered Mix requirements, replacing or lowering reliance on RCPT for acceptance testing.
| Aspect | Traditional (RCPT / ASTM C1202) | Resistivity (AASHTO T 358 / ASTM C1876) |
|---|---|---|
| Test time | 6 hours plus 18+ hours preparation | Less than 2 minutes |
| Sample preparation | Cutting, vacuum saturation, mounting | None (surface) or minimal (bulk) |
| Destructive? | Yes (samples are cut) | No (completely non-destructive) |
| Can same sample be used for strength? | No | Yes |
| Field applicability | Lab only | Lab and field |
| Temperature effects | Severe (Joule heating up to 20°C rise) | Correctable (3% per °C) |
| Operator skill required | High | Moderate |
| Cost per test | High (equipment, labor, disposal) | Low |
Resistivity can also be used for setting time measurement — as fresh concrete sets and hardens, depercolation (discontinuity) of the capillary pore space increases electrical resistivity. Bentz et al. studied the feasibility of using ER for setting time determination. Uniformity assessment on-site can identify areas with differing permeability rates, water-to-cementitious materials ratio variations, differences in degree of consolidation, curing effectiveness variations, and segregation. Resistivity correlates well with water absorption and sorptivity — lower resistivity indicates higher absorption potential. The development of microcracks in cementitious composites under tensile stress can be detected through resistivity changes, as demonstrated by Ranade et al. for engineered cementitious composites.
The correlation between resistivity and compressive strength depends on both properties being influenced by the same underlying factors: degree of hydration, porosity and pore structure refinement, and water-to-cement ratio. For the same mixture, higher resistivity generally corresponds to higher compressive strength. However, the relationship is mixture-specific and requires calibration for each mix design — different binders produce different strength-resistivity curves. Nadelman and Kurtis (2014) demonstrated that surface resistivity can assess the influence of binder composition on microstructural development rate, offering a potential alternative for future performance assessment. Bulk resistivity measurements on 100 × 200 mm cylinders can be performed before compression testing, preserving samples for subsequent strength testing as a completely non-destructive preliminary evaluation.
| Standard | Title | Focus |
|---|---|---|
| ASTM C1202 | Electrical Indication of Concrete’s Ability to Resist Chloride Ion Penetration | RCPT — 6-hr charge passed (coulombs) |
| ASTM C1760 | Bulk Electrical Conductivity of Hardened Concrete | Bulk conductivity (inverse of resistivity) |
| ASTM C1876-24 | Bulk Electrical Resistivity or Bulk Conductivity of Concrete | Direct bulk resistivity measurement |
| AASHTO T 358 | Surface Resistivity Indication of Concrete’s Ability to Resist Chloride Ion Penetration | Wenner 4-probe surface resistivity |
| AASHTO PP 84 | Developing Performance Engineered Concrete Pavement Mixtures | Formation factor framework |
| ASTM C876 | Corrosion Potentials of Uncoated Reinforcing Steel in Concrete | Half-cell potential |
| RILEM TC 154-EMC | Test methods for on site measurement of resistivity of concrete | Field measurement guidance |
| Equation | Description |
|---|---|
| ρ = γ × R | Resistivity from measured resistance and geometry factor |
| ρ_surface = 2πaR | Wenner four-probe resistivity for semi-infinite half-space |
| F = ρ_concrete / ρ_pore_solution | Formation factor relating concrete to pore solution resistivity |
| D_cl = (RT)/(z²F²ρc_cl) | Nernst-Einstein relationship for chloride diffusion coefficient |
| ρ(T) = ρ_ref × exp[(E_a/R)(1/T - 1/T_ref)] | Arrhenius-based temperature correction (E_a ≈ 27.4 kJ/mol) |
| ρ(S) = ρ_sat × S^(-n) | Saturation function correction (n = 3.5 to 5.0 for concrete) |
| i_corr = k/ρ | Corrosion rate approximation (k = 0.03 to 0.3 V) |
Our team provides comprehensive concrete testing services including electrical resistivity surveys, half-cell potential mapping, and corrosion risk assessments for bridges, parking structures, and infrastructure assets.
Chloride content testing determines the concentration of chloride ions at various depths in concrete, indicating corrosion risk to reinforcement. Total chloride...
Corrosion rate measures the actual rate of reinforcement cross-section loss (µm/year or µA/cm²) using electrochemical techniques — linear polarization resistanc...
Corrosion of reinforcing steel is the electrochemical deterioration of rebar within concrete, driven by chloride ingress or carbonation destroying the protectiv...