The Equivalent Single Axle Load (ESAL) converts mixed vehicle axle loads and configurations into equivalent applications of a standard 80 kN (18 kip) single axle with dual tires, enabling cumulative traffic loading to be expressed as a single number for pavement design. Covers ESAL factors, calculation, truck factors, and relationship to pavement consumption observed during inspection.
The Concept of Load Equivalency
The Equivalent Single Axle Load (ESAL) is a dimensionless traffic loading unit that expresses the cumulative pavement damage from any combination of axle weights, axle configurations, and number of load applications in terms of an equivalent number of passes of a standard reference axle. The concept emerged from the AASHO Road Test, conducted from 1958 to 1960 in Ottawa, Illinois, which remains the largest and most consequential full-scale pavement experiment ever undertaken. The Road Test subjected over 200 carefully constructed flexible and rigid pavement sections to more than 1,114,000 load applications from trucks of varying axle weights and configurations. The test data produced the empirical relationships that became the foundation of the AASHTO Guide for Design of Pavement Structures and introduced the concept of Load Equivalency Factors (LEFs), also called ESAL factors.
The fundamental premise of ESAL is that the damaging effect of an axle load on a pavement structure is not proportional to the load itself but follows a highly nonlinear relationship. The AASHO Road Test data showed that pavement damage increases approximately as the fourth power of the axle load ratio. This means a single pass of a 30,000 lb (133 kN) single axle causes roughly 7.9 times more pavement damage than a single pass of an 18,000 lb (80 kN) single axle, even though the weight ratio is only 1.67:1. Doubling the axle load from 18,000 lb to 36,000 lb produces approximately 16 times more damage, not 2 times. This exponential relationship makes ESAL a powerful tool for quantifying the disproportionate contribution of heavy trucks and overloaded vehicles to pavement consumption.
The load equivalency approach allows engineers to answer a question that is central to pavement design: given the mix of vehicle types, axle configurations, and loading intensities expected on a particular road over its design life, how many passes of a standard axle would produce equivalent damage? By converting all traffic to ESALs, the designer can enter the traffic loading into empirical design equations — such as the AASHTO 1993 flexible pavement performance equation — as a single cumulative number, designated as W18 (cumulative 18 kip ESAL applications over the design life). The AASHTO equations then relate W18 to the required Structural Number (SN) for flexible pavements or slab thickness (D) for rigid pavements, given the subgrade resilient modulus (Mr) and target terminal serviceability.
The Standard Axle: 80 kN (18 kip) Single Axle with Dual Tires
By convention established during the AASHO Road Test, the standard axle for ESAL calculations is an 80 kN (18,000 lb) single axle equipped with dual tires. One pass of this standard axle over a pavement section is defined as 1.00 ESAL. All other axle loads and configurations are expressed relative to this reference. The selection of 18,000 lb as the standard was not arbitrary — it corresponded to the maximum legal single-axle load limit in most U.S. states at the time of the Road Test and represented a common loading condition on the interstate highway system being designed and constructed during that period. The standard axle has remained the benchmark for pavement design in North America for over six decades.
The standard axle is defined not only by its total load but also by its tire configuration and contact pressure. The dual-tire arrangement distributes the 18,000 lb load over a larger contact area than a single tire, reducing the contact pressure at the pavement surface. The tire contact pressure is typically assumed equal to the tire inflation pressure, which for standard dual tires is in the range of 80 to 100 psi (550 to 690 kPa). The tire contact area for a dual-tire assembly supporting 4,500 lb per tire (half of an 18,000 lb single axle) is approximately 45 to 56 square inches per tire at typical inflation pressures. These parameters influence the distribution of stresses through the pavement structure to the subgrade and are embedded in the empirical relationships derived from the AASHO Road Test.
Several other standard axle definitions exist internationally. In the United Kingdom, the standard axle is a 10,000 kg (98 kN) single axle with dual tires, reflecting European vehicle weight regulations. The FAA standard for airport pavement design uses a single-wheel load with a specific tire pressure appropriate to aircraft operations, rather than an axle load. However, the 80 kN (18 kip) single axle with dual tires remains the most widely used standard globally for highway pavement design, adopted by AASHTO, the Federal Highway Administration (FHWA), state departments of transportation, and many international road authorities.
Load Equivalency Factors (LEF or EALF)
The Load Equivalency Factor (LEF), also called the Equivalent Axle Load Factor (EALF) , is a multiplier that converts the damage effect of a specific axle load and configuration into an equivalent number of 18 kip single-axle passes. LEF values are derived from the AASHTO load equivalency equations, which differ for flexible and rigid pavements. The generalized fourth-power approximation is:
LEF = (Load / 18,000)⁴
However, the exact AASHTO equations incorporate additional parameters including pavement structural capacity and terminal serviceability. For flexible pavements, the equation includes the Structural Number (SN), which represents the overall pavement strength derived from the thickness and material properties of each layer. For rigid pavements, the equation includes the slab thickness (D) in inches. Both equations also include the terminal serviceability index (pt) — the lowest acceptable pavement condition, typically set at 2.0 or 2.5 on the 0-5 PSI scale.
The AASHTO 1993 Guide (Part III, Chapter 5) provides tabulated LEF values for various axle loads, axle configurations, and pavement types. The following table presents selected LEF values for flexible pavements (SN = 3.0, pt = 2.5) :
Axle Load (lb)
Axle Load (kN)
Single Axle LEF
Tandem Axle LEF
Tridem Axle LEF
2,000
8.9
0.0003
0.0001
0.0001
10,000
44.5
0.118
0.011
0.005
14,000
62.3
0.399
0.042
—
18,000
80.0
1.000
0.109
—
22,000
97.9
1.96
0.232
—
30,000
133.4
7.9
0.703
0.351
34,000
151.2
—
1.11
0.591
For rigid pavements (D = 9.0 inches, pt = 2.5) :
Axle Load (lb)
Single Axle LEF
Tandem Axle LEF
18,000
1.000
0.133
30,000
8.28
1.14
34,000
—
1.92
40,000
—
3.74
Several important observations emerge from these LEF tables. Tandem axles produce significantly less damage than single axles for the same total load because the load is distributed over two axles spaced 4 feet (1.2 m) apart. An 18,000 lb tandem axle (9,000 lb per axle) has an LEF of only 0.109 on flexible pavement, compared to 1.00 for an 18,000 lb single axle. This is the engineering basis for allowing higher gross vehicle weights on trucks with additional axles — more axles reduce pavement damage per ton of payload. Michigan’s unique weight regulations allow up to 164,000 lb gross vehicle weight but limit axle loads to 13,000 lb, resulting in lower ESALs per ton of payload than standard five-axle tractor-semitrailers operating at 80,000 lb.
The LEF for any axle load and configuration can be computed using the AASHTO 1993 load equivalency equations. For flexible pavements, the equation is:
Where W₁₈ is the number of 18 kip single-axle load applications to terminal serviceability, Wₓ is the number of x-kip axle load applications to terminal serviceability, Lₓ is the axle load in kips, L₂ is the axle code (1 for single, 2 for tandem, 3 for tridem), and G and β are functions of serviceability. The equation is furnished in the AASHTO Guide with complete solution charts and computer algorithms.
The Truck Factor
The truck factor is the total ESALs generated by a single pass of a particular vehicle. It is calculated by summing the LEFs for each individual axle on the vehicle. For example, a typical five-axle tractor-semitrailer (FHWA Class 9) with a steering axle at 12,000 lb, drive tandem at 34,000 lb, and trailer tandem at 34,000 lb has a truck factor of approximately 2.0 to 2.5 ESALs depending on actual axle loads and pavement type. The truck factor is the basis for converting traffic counts into cumulative ESALs for design.
Truck factors are highly specific to vehicle class, loading patterns, axle configuration, and regional freight characteristics. They are derived from weigh-in-motion (WIM) data or static weigh station surveys. State DOTs typically develop truck factors calibrated to their local truck traffic using WIM data collected on representative highway segments. The FHWA classifies vehicles into 13 classes for traffic analysis, with classes 4 through 13 (buses and trucks) contributing essentially all of the ESAL loading. Classes 1 through 3 (motorcycles, passenger cars, and light pickups) contribute negligible ESALs — typically less than 0.0004 ESAL per vehicle — and are omitted from truck factor calculations by most agencies.
ESAL Calculation Methodology
The calculation of cumulative design ESALs — designated as W18 — for a pavement design project follows a structured methodology that incorporates traffic volume, vehicle classification, loading characteristics, and design parameters. The fundamental equation is:
Design ESALs = AADT × T/100 × D_d × L_f × T_f × 365 × G × Y
Where each term represents a critical input parameter:
AADT (Annual Average Daily Traffic) is the total two-direction daily traffic volume on the roadway section, typically obtained from automated traffic recorder counts. The AADT must be from the most recent year of available data and should represent average conditions, not seasonal peaks. AADT values are obtained from permanent traffic count stations, short-duration portable counts, or statewide traffic monitoring programs compliant with FHWA’s Traffic Monitoring Guide (TMG) .
T% (Percent Trucks) represents the proportion of the AADT composed of trucks (FHWA classes 4 through 13). This is determined from vehicle classification counts that separate traffic into the 13 FHWA classes. The percent trucks varies widely by functional class — rural interstates may carry 20 to 40% trucks while local urban collectors may carry 2 to 8% trucks. The directional distribution (D_d) splits the two-direction AADT into the design direction, typically 0.5 (50%) for balanced two-way traffic on most highways. On routes with directional imbalance (e.g., commuter routes, recreational routes), the directional split may be 0.6 or higher in the peak direction.
L_f (Lane Distribution Factor) accounts for the fact that not all trucks use the design lane — typically the slow lane or rightmost lane. On two-lane highways, the lane distribution factor is effectively 1.0 since all traffic uses the single lane in each direction. On multi-lane highways, lane distribution is a function of the number of lanes, traffic volume, and access density. The following lane distribution factors for trucks in the design lane are specified by the 1993 AASHTO Design Guide (Table 5.2):
Lanes per Direction
Percent Trucks in Design Lane
1
100
2
80-100
3
60-80
4
50-75
The values reflect the observation that on roads with three or more lanes, trucks tend to concentrate in the rightmost lane (the design lane) but some travel in adjacent lanes, reducing the proportion of total truck traffic in any single lane. The designer must select a value within the AASHTO-recommended range based on local conditions and engineering judgment.
T_f (Truck Factor) is the ESALs per truck, calculated as the sum of LEFs for all axles on a representative truck of each class. Truck factors can be computed as either a mixed-fleet average truck factor (a single value representing the average ESALs per truck across all truck classes) or class-specific truck factors (separate values for each FHWA class). Class-specific truck factors are preferred for accuracy because heavy trucks (Classes 8-13) have much higher ESAL contributions than lighter trucks (Classes 4-7). The truck factor is typically obtained from WIM data or from axle load spectra collected during traffic monitoring. Many state DOTs publish truck factor tables for use in routine pavement design, updated periodically based on the WIM data collected statewide.
Y (Design Life) is the number of years the pavement structure is expected to serve before requiring major rehabilitation or reconstruction. Typical design lives are 20 years for new flexible pavements, 20 to 40 years for new rigid pavements, and 10 to 15 years for overlays and rehabilitation projects. The design life is selected based on the facility’s importance, available funding, and agency policy.
G (Growth Factor) accounts for the expected growth in truck traffic over the design life, compounded annually. The growth factor is calculated using the standard geometric series:
G = [(1 + r)ⁿ - 1] / r
Where r is the annual growth rate expressed as a decimal (e.g., 0.02 for 2% growth) and n is the design life in years. For example, a 2% annual growth over 20 years produces G = [(1.02)²⁰ - 1] / 0.02 = 24.3. This means the total ESALs over the design life are 24.3 times the first-year ESALs, not 20 times the first-year ESALs. Growth rates are determined from historical traffic trend analysis, regional economic development projections, and freight movement forecasts. The FHWA’s Freight Analysis Framework (FAF) provides national and regional freight growth projections used for establishing truck traffic growth rates.
Complete ESAL Calculation Example
Consider a rural interstate highway with the following parameters:
AADT: 50,000 vehicles per day (two directions)
Trucks (Class 4-13): 22% of AADT
Directional distribution: 50% (0.50)
Lane distribution: 85% (three lanes per direction, select 0.85)
Truck factor: 1.8 ESALs per truck (mixed fleet average)
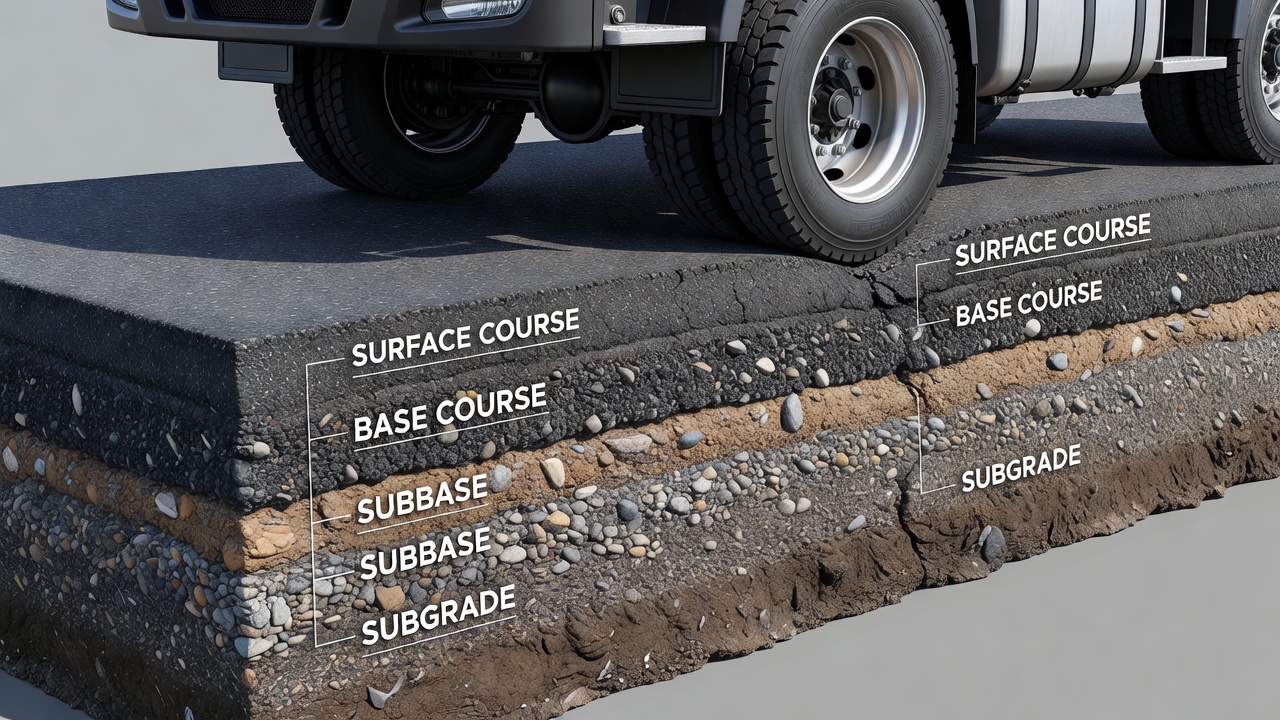
This W18 value of 78.4 million would be entered into the AASHTO 1993 flexible pavement design equation to determine the required Structural Number, then converted into layer thicknesses for the surface, base, and subbase courses.
ESALs for Flexible vs. Rigid Pavements
The AASHO Road Test and subsequent AASHTO Guides recognize that flexible and rigid pavements respond to loading through fundamentally different structural mechanisms, and therefore the load equivalency relationships are not identical between the two types. Flexible pavements — composed of asphalt concrete surface over granular base and subbase layers — distribute loads through aggregate interlock, particle friction, and cohesion. The structural response is primarily compressive, with tensile strains developing at the bottom of the asphalt layer under traffic loads, leading to fatigue cracking from the bottom up. Rigid pavements — composed of Portland cement concrete (PCC) slabs — distribute loads through beam action and bending resistance, with tensile stresses developing at the bottom of the slab between wheel loads and at the slab edges and corners.
These different structural responses produce different LEF values for the same axle load. The key differences are:
Tandem axle effects are more severe on rigid pavements. A 34,000 lb tandem axle produces 1.11 ESALs on flexible pavement (SN = 3.0) but 1.92 ESALs on rigid pavement (D = 9.0). This is because the stress interaction between closely spaced axles has a greater effect on bending-induced tensile stresses in PCC slabs than on compressive load distribution in flexible pavements. The load transfer efficiency at joints in rigid pavements also influences stress distributions under tandem axle configurations.
The exponent in the load equivalency equation differs. The flexible pavement equation uses a fourth-power relationship (exponent ≈ 4.0), while the rigid pavement equation approximates a 3.9-power relationship. While this difference may appear small, it produces diverging LEF values at high axle loads. For example, a 30,000 lb single axle has LEF = 7.9 on flexible pavement but 8.28 on rigid pavement.
The conversion factor between pavement types. The 1993 AASHTO Guide recommends a multiplier of 1.5 to convert flexible pavement ESALs to rigid pavement ESALs (or 0.67 to convert rigid to flexible). This conversion accounts for the systematic differences in load equivalency between the two pavement types over typical structural capacities. However, the conversion is an approximation, and the 2002 Mechanistic-Empirical Pavement Design Guide (MEPDG) eliminates the need for separate ESAL computations by using full axle load spectra as direct input.
Structural capacity parameters. The LEF for flexible pavements is sensitive to the Structural Number (SN) , while the LEF for rigid pavements is sensitive to the slab thickness (D) . Thicker pavements have lower LEFs for a given axle load because the greater structural capacity distributes the load over a wider area, reducing critical stresses and strains. For example, a flexible pavement with SN = 5.0 will have lower LEF values than one with SN = 2.0 for the same axle load.
Cumulative Design ESALs (W18)
W18 — also called cumulative ESALs or design ESALs — is the total number of 18 kip equivalent single-axle load applications expected over the pavement design life. This is the fundamental traffic loading input in the AASHTO 1993 empirical design equations. The AASHTO flexible pavement performance equation relates W18 to the required Structural Number (SN) through:
Z_R is the standard normal deviate for the chosen design reliability level (e.g., Z_R = -1.645 for 95% reliability)
S₀ is the standard deviation (typically 0.40 to 0.50 for flexible pavements)
ΔPSI is the serviceability loss from initial (p₀ = 4.2) to terminal (p_t = 2.0 to 2.5)
M_R is the subgrade resilient modulus in psi
The equation is solved iteratively for the required SN, which is then distributed into layer thicknesses using the layer coefficients for each material. The AASHTO design nomographs — graphical solutions of the performance equation — were the standard design tool for decades, and many agencies still use them.
The magnitude of W18 has a dramatic effect on the required pavement thickness. A pavement designed for W18 = 1 million ESALs might require an SN of 3.0 (approximately 6 inches of asphalt concrete over 8 inches of base), while a pavement designed for W18 = 100 million ESALs might require an SN of 6.0 or more (approximately 12 inches of asphalt concrete over 18 inches of base). However, the relationship exhibits diminishing returns — increasing pavement thickness becomes progressively less effective at accommodating additional traffic. The AASHTO Guide notes that “increasing a rigid pavement from 9 to 10 inches in depth will approximately double the traffic loadings that can be accommodated by the pavement.”
The AASHTO 1993 method categorizes design traffic into five ranges:
Medium (W18 = 10⁵ to 10⁶): Collector roads, minor arterials
Heavy (W18 = 10⁶ to 10⁷): Principal arterials, moderate truck routes
Very Heavy (W18 = 10⁷ to 10⁸): Interstate highways, major truck routes
Extremely Heavy (W18 > 10⁸): Major urban interstates, freight corridors
The Fourth Power Law and Overload Damage
The fourth power law is the most widely recognized relationship in pavement loading analysis. It states that the damage caused by an axle load is proportional to the load raised to the fourth power relative to the standard axle. This empirical law emerged from the AASHO Road Test data and forms the basis of the Load Equivalency Factor concept. The generalized relationship is:
Damage ∝ (L / L_std)⁴
Where L is the actual axle load and L_std is the standard 18,000 lb reference. While this approximation is widely used for back-of-envelope calculations and regulatory analysis, the exact AASHTO equations produce LEF values that deviate from the pure fourth power relationship, particularly at very low or very high axle loads and for tandem and tridem axles. The fourth power is a convenient and useful approximation, but actual LEFs should be obtained from the AASHTO tables or equations for design.
Overload damage is the critical consequence of vehicles operating at axle loads exceeding legal limits. Because damage follows a fourth-power function, even modest overloads cause disproportionate pavement damage. A 20,000 lb single axle (11% overload above the 18,000 lb standard) generates 1.57 ESALs on rigid pavement — 57% more damage than a legal 18,000 lb axle producing 1.00 ESAL. A 22,000 lb single axle (22% overload) generates 1.96 ESALs — essentially double the pavement consumption of a legal axle. A 30,000 lb single axle (67% overload) generates 7.9 to 8.28 ESALs, meaning one overloaded truck can cause eight times the pavement wear of a legal truck.
The economic implications of overload damage are substantial. The FHWA Comprehensive Truck Size and Weight Study (Working Paper 3, 2000) found that ESALs per ton of payload increase sharply with vehicle weight: a five-axle combination carrying 80,000 lb generates approximately 2.5 ESALs per 1,000 trips, while a nine-axle combination carrying 110,000 lb generates lower ESALs per ton due to the additional axles. This is why enforcement of axle weight limits is a critical function of state highway patrol and commercial vehicle enforcement agencies, who operate weigh-in-motion (WIM) systems and static weigh stations to identify and penalize overloaded vehicles.
The fourth power law also explains why pavement damage from passenger cars is negligible. A 2,000 lb passenger car axle produces LEF ≈ 0.0003 — it would take over 3,300 passenger cars to cause the same pavement damage as a single 18,000 lb truck axle. This is why virtually all pavement design methods in the world consider only commercial vehicles (trucks and buses) for traffic loading calculations.
Airport Traffic: ESALs vs. Coverages
The ESAL concept is primarily a highway pavement design tool. For airport pavement design, the International Civil Aviation Organization (ICAO) and the FAA use a different approach based on the Aircraft Classification Number (ACN) and Pavement Classification Number (PCN) system, along with the concept of coverages or pass-to-coverage ratios.
In airport pavement design, the critical loading parameter is the pass-to-coverage ratio — the number of tire load applications per unit width of pavement required to achieve one full coverage of the pavement with the design load. The FAA’s FAARFIELD (FAA Rigid and Flexible Iterative Elastic Layer Design) software uses a layered elastic analysis to compute stresses and strains in the pavement structure under the landing gear configuration of the design aircraft. The design is based on the number of departures (not total operations) because landings typically involve lower loads from aircraft with partially consumed fuel.
The ACN-PCN method (ICAO Annex 14, Aerodromes) provides a standardized system for reporting and evaluating airport pavement bearing strength. The ACN is a number expressing the relative effect of an aircraft on a pavement for a specified subgrade strength category (high, medium, low, or ultra-low). The PCN represents the bearing strength of the pavement. An aircraft with ACN ≤ PCN can operate on the pavement without restriction. The ACN is computed using the equivalent single wheel load (ESWL) concept at the subgrade level — the load on a single wheel that would produce the same subgrade stress as the actual multi-wheel landing gear configuration.
The relationship between ESAL (highway) and ACN/PCN (airport) is one of engineering analogy rather than direct conversion. Both concepts address the same fundamental problem — expressing the damaging effect of complex loading in terms of a standard — but they use different standard references, different structural models, and different failure criteria. A direct mathematical conversion between ESALs and aircraft operations is not generally possible because the loading geometry (tire pressure, wheel spacing, gear configuration) and pavement response differ fundamentally between highway and airport pavements.
ESALs and Observed Pavement Distress
The relationship between cumulative ESAL loading and observable pavement distress is the basis for connecting pavement design assumptions with field inspection findings. When a pavement inspection reveals distress at an earlier age than predicted by the design, the discrepancy typically originates from one of three sources: (1) actual traffic loading exceeded the design ESALs, (2) the pavement structure was weaker than assumed in design, or (3) environmental factors (freeze-thaw, moisture) accelerated deterioration beyond the ESAL-based prediction.
The Pavement Condition Index (PCI) , as defined by ASTM D6433 (Standard Practice for Roads and Parking Lots Pavement Condition Index Surveys), quantifies pavement condition on a 0-100 scale based on the type, severity, and extent of observed distress. The relationship between PCI and cumulative ESALs is typically a decreasing exponential function — initially rapid deterioration as the pavement accumulates the first few million ESALs, followed by a more gradual decline, then accelerating deterioration as the pavement approaches terminal serviceability.
Specific distress types that correlate directly with cumulative ESAL loading include:
Fatigue (alligator) cracking is the most direct structural distress caused by repeated traffic loading. It initiates as longitudinal cracks in the wheel paths at the bottom of the asphalt layer, where tensile strains are highest, and propagates upward to the surface as the number of ESAL applications increases. As cracking progresses, the interconnected cracks form a pattern resembling alligator skin. The AASHTO design equation is fundamentally a fatigue relationship — the equation predicts the number of load applications to reach a terminal serviceability index, which corresponds to a specific extent of fatigue cracking (typically 10 to 20% of the wheel path area at terminal serviceability).
Rutting is permanent deformation in the wheel paths caused by densification and shear displacement of the pavement layers and subgrade. Each ESAL pass causes a small increment of permanent deformation that accumulates over the design life. The ESAL-to-rutting relationship depends on the structural number (SN), subgrade strength, and temperature. A typical flexible pavement designed for W18 = 10 million ESALs might experience 0.25 to 0.50 inches of rutting at terminal serviceability.
International Roughness Index (IRI) is a measure of pavement ride quality that correlates with cumulative ESAL loading. As a pavement accumulates ESALs, the roughness increases due to cracking, rutting, patched areas, and differential settlement. Pavement management systems use IRI and ESAL data to predict remaining service life and optimize maintenance and rehabilitation timing.
The AASHTO Road Test established the Present Serviceability Index (PSI) , which directly links cumulative ESAL applications to pavement condition. The flexible pavement PSI equation is:
Where SV is the slope variance (related to roughness), C is the extent of cracking (ft²/1,000 ft²), P is the extent of patching (ft²/1,000 ft²), and RD is the average rut depth (inches). The PSI ranges from 5.0 (perfect) to 0.0 (impassable), with a typical initial PSI of 4.2 for new flexible pavements and a terminal PSI of 2.0 to 2.5. The AASHTO performance equation predicts how many ESAL applications are required to reduce PSI from initial to terminal, making PSI the physical link between cumulative traffic loading and measurable pavement condition.
ESAL in AASHTO and FAA Design
AASHTO Pavement Design
The AASHTO Guide for Design of Pavement Structures (1993) is the most widely used pavement design standard in the United States. The entire empirical design framework is built around the ESAL concept. The Guide provides:
Load Equivalency Factors (LEFs): Tabulated values for single, tandem, and tridem axles on flexible and rigid pavements, with options for adjusting for different structural numbers (SN), slab depths (D), and terminal serviceability (pt).
Traffic Analysis Procedures: Detailed guidance on determining design ESALs including AADT, vehicle classification, growth factors, lane distribution, and directional distribution. The Guide specifies minimum traffic data collection periods (48 hours continuous for short counts, 7 days including weekends) and recommends weigh-in-motion data for axle load distributions.
Design Reliability: The concept of design reliability (R%) — the probability that the pavement will survive the design ESALs without failure — is integrated into the performance equation through the standard normal deviate (Z_R). Typical reliability levels range from 50% for low-volume roads to 99.9% for interstate highways.
ESAL-based Performance Prediction: The flexible and rigid pavement performance equations predict the number of applications to terminal serviceability as a function of SN (flexible) or D (rigid), subgrade resilient modulus (Mr), and terminal serviceability. The equations are solved iteratively to determine the required SN or D for the design W18.
The Mechanistic-Empirical Pavement Design Guide (MEPDG) , adopted as AASHTOWare Pavement ME Design, represents a significant evolution beyond the 1993 ESAL-based method. MEPDG uses full axle load spectra — the frequency distribution of axle loads by axle type (single, tandem, tridem, quad) — rather than reducing traffic to a single ESAL number. This approach allows the mechanistic response model to compute stresses and strains for each axle load level and accumulate damage using Miner’s hypothesis, providing more accurate performance predictions for different loading conditions. The load spectra also eliminate the need for flexible-to-rigid ESAL conversions. However, the ESAL concept remains the standard for routine pavement design in most state and local agencies, and MEPDG produces equivalent ESAL outputs when load spectra are aggregated for reporting purposes.
FAA Pavement Design
The FAA Advisory Circular 150/5320-6G (Airport Pavement Design and Evaluation) governs the design of airport pavements in the United States. The FAA’s design method differs fundamentally from AASHTO’s ESAL approach in several respects:
Design Aircraft: Airport pavements are designed for a specific design aircraft — the aircraft whose loading requires the greatest pavement thickness among the fleet expected to operate on the pavement. The design aircraft is characterized by its maximum takeoff weight, landing gear configuration, tire pressure, and annual departures.
Pass-to-Coverage Ratio: The number of gear load passes in the traffic mix is converted to equivalent coverages of the design gear configuration. A coverage occurs when every point on the pavement surface has been subjected to one pass of the design gear. The pass-to-coverage ratio is a function of the gear geometry and wheel spacing.
Layered Elastic Analysis: FAARFIELD uses layered elastic theory to compute critical stresses and strains, which are compared with allowable values based on the number of design coverages. The flexible pavement failure criterion is horizontal tensile strain at the bottom of the asphalt layer (fatigue) and vertical compressive strain at the top of the subgrade (rutting). For rigid pavements, the critical parameter is the edge stress in the PCC slab.
Equivalent Annual Departures: For mixed aircraft traffic, each aircraft type is converted to equivalent annual departures of the design aircraft using a load ratio raised to a power — analogous to the ESAL concept but specific to aircraft loads, gear configurations, and pavement type. The FAA’s COMFAA software computes these equivalent departures.
The ACN-PCN method (ICAO Annex 14) provides a universal system for reporting pavement bearing strength at airports worldwide. The ACN computation considers the aircraft weight, tire pressure, gear geometry, pavement type (rigid or flexible), and subgrade strength category. The PCN is determined from the pavement’s construction history, empirical evaluation, technical analysis (using COMFAA), or by operating experience. The ACN-PCN system serves the same purpose as ESAL for highways — it enables a standardized comparison between loading demand (aircraft) and structural capacity (pavement) — but uses completely different standards and computation methods.
Limitations and Evolution of the ESAL Concept
The ESAL concept, while revolutionary when developed and still widely used, has recognized limitations that the pavement engineering community has addressed through the evolution of design methods:
Averaging of axle loads: ESAL reduces the entire spectrum of axle loads to a single number, losing information about the load distribution. A pavement may respond differently to 1,000 passes of a 30,000 lb axle (LEC = 7,900) than to 7,900 passes of an 18,000 lb axle (LEC = 7,900), even though the ESAL total is the same. The sequence and spectrum of loading affect pavement fatigue through the Miner’s law cumulative damage mechanism, which ESAL cannot capture.
Single failure criterion: ESAL-based design uses a single terminal serviceability criterion (typically PSI = 2.0 or 2.5) that combines roughness, cracking, and rutting into one index. This obscures the specific failure mode — a pavement may reach terminal serviceability from excessive rutting without significant fatigue cracking, or vice versa. The MEPDG approach evaluates fatigue cracking, rutting, and roughness as separate distresses.
Climate and environmental effects: The ESAL concept treats all ESALs as equal regardless of environmental conditions. However, pavement damage per ESAL varies with temperature (flexible pavement rutting is more severe at high temperatures), moisture (subgrade weakening during spring thaw), and freeze-thaw cycling. The MEPDG incorporates climate input (hourly temperature, precipitation, freeze-thaw cycles) to compute the environmental effect on pavement response.
Load spectra in MEPDG: The transition from ESAL to axle load spectra in the MEPDG represents a fundamental advancement in the characterization of traffic loading. The load spectra — consisting of the frequency distribution of axle loads for each axle type — are input directly into the mechanistic response model. The spectra capture the full range of axle loads rather than a single equivalency factor, and different axle load distributions produce different strain levels even when the total ESALs are equal. Research by Turochy, Timm, and Tisdale (2005, Auburn University Highway Research Center) demonstrated that site-specific load distributions can produce significant differences in required pavement thickness compared with using statewide average load distributions.
The continued use of ESAL for routine design is justified by its simplicity, familiarity, and the extensive empirical database that supports the AASHTO 1993 method. For design traffic levels below approximately W18 = 30 million, the ESAL method provides reliable results consistent with decades of pavement performance observation. For very high traffic levels (W18 > 50 million), critical facilities, and projects where life-cycle cost optimization is essential, the MEPDG with axle load spectra provides a more sophisticated and accurate analysis.
ESALs in Pavement Management Systems
Pavement management systems (PMS) use ESALs as a fundamental input for network-level and project-level analysis. At the network level, ESALs are used to segment the highway network into pavement sections with similar loading characteristics, prioritize maintenance and rehabilitation projects, and forecast future pavement condition. The remaining service life (RSL) of a pavement section is computed as:
The ratio of consumed ESALs (from traffic counts over the pavement’s life) to design ESALs is the pavement consumption factor. When this factor approaches 1.0, the pavement is at terminal serviceability and requires rehabilitation. When inspection data — such as PCI, IRI, rut depth, or cracking extent — indicate distress levels exceeding those predicted by the ESAL-based consumption factor, the discrepancy may indicate construction deficiencies, environmental damage, or overloaded traffic not captured in the traffic monitoring data.
The FHWA’s Highway Performance Monitoring System (HPMS) requires state DOTs to report traffic loading in terms of ESALs for all sections of the National Highway System (NHS). The HPMS ESAL reporting is based on vehicle classification data from traffic monitoring stations, truck factors developed from WIM data, and growth projections. The HPMS ESAL data are used for federal funding allocation, performance measurement, and policy analysis. The Moving Ahead for Progress in the 21st Century Act (MAP-21) and subsequent Infrastructure Investment and Jobs Act (IIJA) established pavement condition performance measures that are directly linked to ESAL loading data reported through HPMS.
Frequently Asked Questions
An Equivalent Single Axle Load (ESAL) is a dimensionless unit that expresses the pavement damage caused by a single pass of any axle load relative to the damage caused by a single pass of a standard 80 kN (18,000 lb) single axle with dual tires. By convention, one pass of the standard 18 kip single axle equals 1.0 ESAL. A vehicle carrying 40,000 lb on a tandem axle may produce approximately 0.7 to 1.1 ESAL depending on pavement type, while a fully loaded five-axle tractor-semitrailer typically generates between 2.0 and 2.5 ESALs per pass. ESAL is the fundamental traffic input parameter in the AASHTO 1993 pavement design procedure.
The cumulative design ESALs (W18) are calculated using the formula: ESAL = AADT × T% × Tf × Lf × Df × Y × G, where AADT is the annual average daily traffic in both directions, T% is the percentage of trucks in the traffic stream, Tf is the truck factor (ESALs per truck), Lf is the lane distribution factor (the fraction of trucks in the design lane), Df is the directional distribution factor (usually 0.5 for 50/50 split), Y is the design life in years, and G is the growth factor accounting for annual traffic growth compounded over the design period. The truck factor itself is calculated by summing load equivalency factors (LEFs) for each individual axle on a representative truck and is obtained from weigh-in-motion (WIM) data or axle load surveys.
The fourth power law states that pavement damage is approximately proportional to the axle load raised to the fourth power. This empirical relationship was derived from the AASHO Road Test data and forms the theoretical basis for Load Equivalency Factors (LEFs). For example, if a standard 18,000 lb single axle has LEF = 1.0, then a 30,000 lb single axle has LEF ≈ (30,000/18,000)⁴ = (1.667)⁴ = 7.7, which closely matches the AASHTO tabulated value of 7.9. This exponential relationship means doubling the axle load increases pavement damage by approximately 16 times. The fourth power law applies to both flexible and rigid pavements, though the exact exponents in the AASHTO equations are 4.0 for flexible and 3.9 for rigid pavements with typical structural numbers.
Yes, ESAL values differ between flexible and rigid pavements because the two pavement types respond to loading through fundamentally different mechanisms. Flexible pavements distribute loads through aggregate interlock and particle friction, while rigid pavements distribute loads through beam action and bending resistance of the Portland cement concrete slab. The AASHTO 1993 Guide provides separate load equivalency factor tables for each pavement type. A 34,000 lb tandem axle produces approximately 1.11 ESALs on flexible pavement (SN = 3.0) but 1.92 ESALs on rigid pavement (D = 9.0 inches). The 1993 AASHTO Guide recommends a multiplier of 1.5 to convert flexible ESALs to rigid ESALs. However, the newer Mechanistic-Empirical Pavement Design Guide (MEPDG) eliminates the need for this conversion by using full axle load spectra instead of ESALs.
ESALs directly correlate with several observable pavement distress types that are documented during pavement condition inspections. Fatigue cracking (alligator cracking) in the wheel paths is the most direct structural consequence of cumulative ESAL loading. Rutting — permanent deformation in the wheel paths — accumulates with each ESAL pass and reduces the pavement serviceability index (PSI). The AASHO Road Test established the relationship between cumulative ESAL applications and serviceability loss, which became the foundation of the present serviceability index (PSI) concept. When field-observed distresses such as rutting depth exceeding 0.5 inches, alligator cracking covering more than 20% of the wheel path area, or a PSI below 2.0 are encountered during inspection, they indicate that the design ESALs have likely been exceeded. This is why comparing design ESALs with actual loading history is essential for diagnosing premature pavement failure.
Need pavement inspection and condition assessment?
TarmacView provides comprehensive pavement inspection solutions including traffic loading assessment, ESAL verification, pavement condition indexing (PCI), and structural evaluation. Our team of experienced pavement engineers can help you understand the relationship between traffic loading and observed pavement distress.
Traffic loading data — vehicle classifications, axle loads, and counts — is a primary input for pavement structural design and determines the rate of pavement c...
The Structural Number (SN) is an abstract index value expressing the structural capacity of a flexible pavement required to carry a given traffic loading, compu...
Resilient Modulus (Mr) is the dynamic elastic modulus of subgrade soil or unbound pavement materials under repeated (cyclic) loading, measuring recoverable stra...
26 min read
Geotechnical
Pavement design
+3
Cookie Consent We use cookies to enhance your browsing experience and analyze our traffic. See our privacy policy.