The Falling Weight Deflectometer (FWD) is a non-destructive pavement testing device that drops a known impulse load onto a loading plate, measuring surface deflections at multiple sensor locations to evaluate structural capacity, back-calculate layer moduli, and assess remaining pavement life for highways and airfields.
Falling Weight Deflectometer – Principles and Equipment
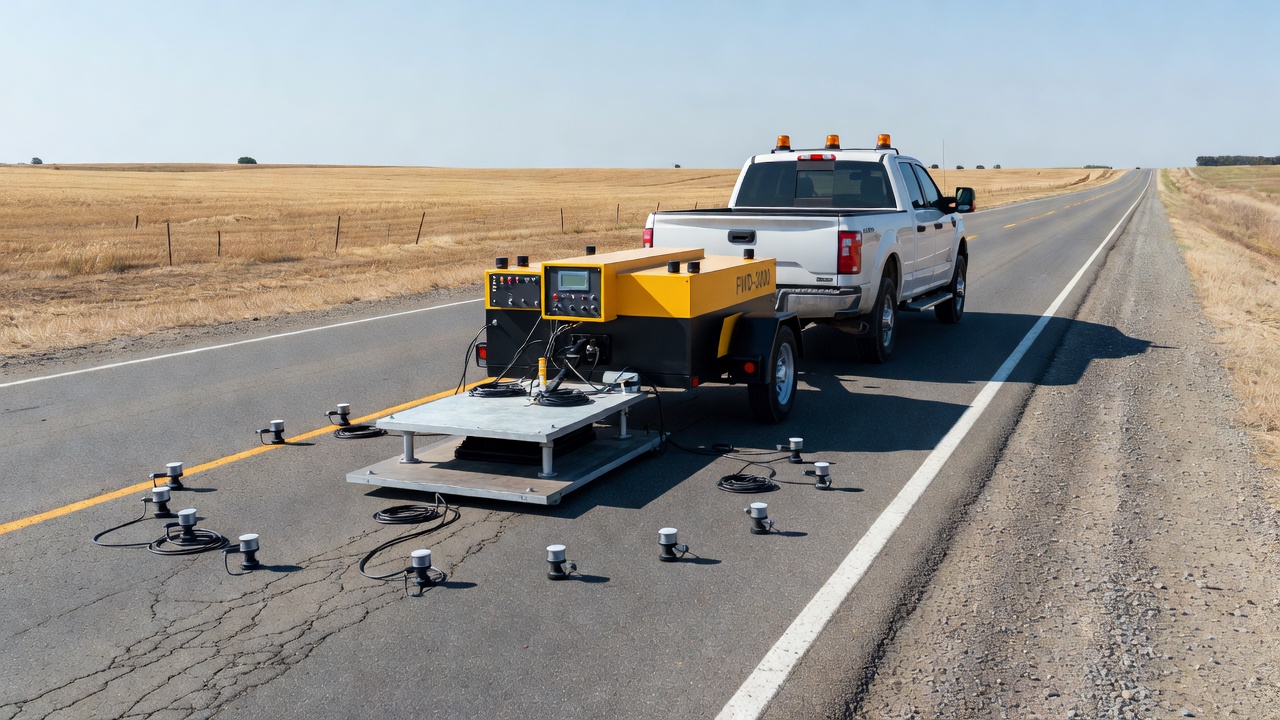
The Falling Weight Deflectometer (FWD) is the primary non-destructive testing (NDT) device used worldwide for structural evaluation of pavement systems. It operates by applying a controlled impulse load — a mass dropped from a predetermined height onto a circular segmented loading plate resting on the pavement surface — and measuring the resulting vertical surface deflections. The FWD simulates the dynamic loading effect of a moving vehicle wheel without damaging the pavement, allowing rapid, repeatable, and cost-effective structural assessment at both network and project levels.
The fundamental principle behind FWD testing is impulse loading mechanics. A weight (mass) is lifted by an electro-hydraulic or mechanical system to a specified drop height and released. Upon impact with the loading plate, the kinetic energy of the falling mass generates a force pulse that closely approximates the shape and duration of a moving wheel load — typically a haversine pulse lasting 25 to 30 milliseconds. The peak force is determined by the drop height and mass, with modern FWD systems capable of applying loads ranging from 4 kN to 150 kN (approximately 900 to 33,700 lbf). The loading plate, typically 300 mm (11.8 inches) in diameter, is segmented into four sections connected by a swivel mechanism, allowing the plate to conform to uneven or rutted pavement surfaces for uniform load distribution.
The pavement’s response to the impulse load propagates through the pavement structure as stress waves, creating a deflection basin — a three-dimensional bowl-shaped deformation of the pavement surface centered at the load application point. The shape and magnitude of this deflection basin are functions of the applied load magnitude, the stiffness and thickness of each pavement layer, and the subgrade support condition. A stiff pavement structure (thick concrete slabs or high-modulus asphalt over strong base and subgrade) produces a shallow, wide deflection basin with small maximum deflection. A weak pavement structure produces a deep, narrow deflection basin with large maximum deflection and sharp curvature near the load center.
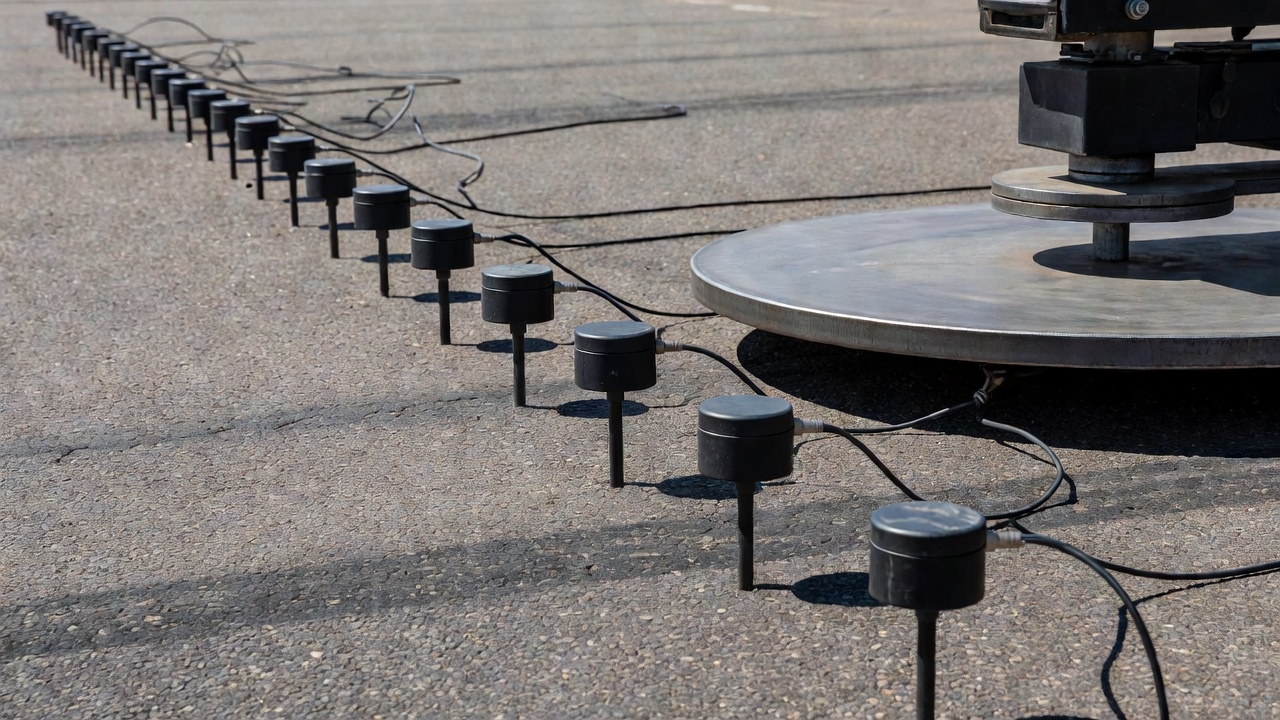
Deflection sensors — typically high-precision velocity transducers called geophones — are arranged in a linear array along the FWD trailer, with one sensor located at the center of the loading plate (measuring D0, the maximum deflection) and additional sensors spaced at standard radial offsets. A typical FWD configuration includes 7 to 9 sensors positioned at distances of 0, 200, 300, 450, 600, 900, 1200, 1500, and 1800 mm (0, 8, 12, 18, 24, 36, 48, 60, and 72 inches) from the load center, depending on the specific model and testing protocol. Some advanced systems can accommodate up to 15 sensors for research applications or specialized testing. Geophones measure the velocity of the pavement surface during the deflection event, and the onboard computer integrates the velocity signal to compute peak deflection values in micrometers or mils (thousandths of an inch).
The complete FWD system consists of several integrated components: the trailer or truck-mounted frame housing the drop mechanism and sensors; the electro-hydraulic lifting system for raising the mass; the load cell mounted between the drop mass and the loading plate for precise force measurement; the geophone array with signal conditioning electronics; the onboard computer running data acquisition and real-time quality control software; air and pavement surface temperature sensors; a distance measuring instrument (DMI) for test location tracking; and optional equipment such as GPS receivers for spatial referencing, video cameras for test location documentation, and Ground Penetrating Radar (GPR) for concurrent pavement thickness measurement. The system is designed for single-person operation, with the operator remaining in the towing vehicle, controlling tests via a computer interface, and monitoring the loading plate position through a video camera feed.
FWD Equipment Configurations and Specifications
Two primary equipment configurations exist: the trailer-mounted FWD, which is towed behind a vehicle and lowered to the pavement surface at each test location, and the truck-mounted FWD (also referred to as a deflectograph), which is integrated into a heavy vehicle chassis. The trailer-mounted configuration is more common, offering flexibility, lower acquisition cost, and ease of transport between projects. The truck-mounted configuration provides higher testing productivity, better mobility in heavy traffic, and improved operator comfort for large-scale network surveys. PennDOT’s Bureau of Project Delivery, for example, operates Dynatest Model 8000 FWD units — single-mass systems capable of testing with weights between 1,500 and 27,000 pounds (6.7 kN to 120 kN) — with testing performed from March through November when temperatures exceed 40°F and the subgrade is not frozen.
The leading manufacturer of FWD equipment is Dynatest (Denmark), whose systems are considered the industry standard, compliant with ASTM D4694-09 and used in over 100 countries. Other manufacturers include Carl Bro/JTM (now part of Dynatest), KUAB (Sweden), and Pavement Testing Services (Australia). Dynatest FWD systems feature a peak load range of approximately 4 to 120 kN (standard) or up to 150 kN (extended), testing productivity of up to 60 test points per hour with a typical four-drop sequence, and compliance with TRL (UK) and CROW (Netherlands) correlation trials.
Calibration is critical for FWD measurement quality. AASHTO R32-11 defines the standard practice for calibrating the load cell and deflection sensors. Annual reference calibration at an approved FWD calibration center is required, along with monthly relative calibrations (or before and after each major survey) to verify sensor consistency. Calibration procedures involve placing sensors on a rigid surface, applying a known load, and verifying that each sensor produces outputs within acceptable tolerance. Temperature effects on geophone sensitivity must be accounted for, and modern FWD software includes automated real-time monitoring of load cell, geophone, and data variation to ensure collected data quality.
Deflection Basin Parameters and Analysis
The deflection basin captured by FWD sensors contains a wealth of information about pavement structural condition. Over decades of pavement engineering research, numerous deflection basin parameters have been developed to extract specific pavement layer properties directly from the measured deflection bowl without requiring full back-calculation. These parameters, summarized comprehensively by Horak (1987), focus on four distinct zones of the deflection basin: the maximum deflection under the load center (total pavement response), the near-field slope or curvature (upper bound layer stiffness), the mid-field deflection differences (base and subbase layer condition), and the far-field deflections (subgrade stiffness).
The maximum deflection (D0) is the deflection measured directly at the center of the loading plate. It represents the total structural response of the entire pavement system — all layers and the subgrade. While D0 has been used as a primary input for empirical overlay design procedures since the Benkelman Beam era, it cannot distinguish between individual layer contributions. A high D0 may indicate weak subgrade, thin pavement layers, or deteriorated bound layers.
The Surface Curvature Index (SCI) is defined as D0 minus D300, where D300 is the deflection at 300 mm (12 inches) from the load center. This parameter reflects the relative stiffness of the upper bound pavement layers — the asphalt concrete or Portland cement concrete surface course. A high SCI value (large deflection difference between D0 and D300) indicates a weak or deteriorated surface layer, whereas low SCI values suggest stiff, intact bound layers. The SCI has been directly correlated with the modulus of the asphalt layer and is used as a screening tool for identifying sections requiring further investigation.
The Base Damage Index (BDI) corresponds to D300 minus D600, reflecting the condition of the base and subbase layers. The Base Curvature Index (BCI) corresponds to D600 minus D900, providing insight into the lower pavement layers and the subgrade surface zone. The Area parameter integrates the deflection basin shape over the first three feet from the load center, providing a single value characterizing overall basin curvature. The Shape Factors F1 (D0-D2)/D1 and F2 (D1-D3)/D2 have been used to characterize the degree of bowl curvature.
The deflections measured at far-field sensors — typically at 900 mm (36 inches), 1200 mm (48 inches), and 1500 mm (60 inches) — are used to estimate the subgrade resilient modulus (MR) . Because the stress bulb from the applied load spreads with depth, far-field deflections are predominantly influenced by the subgrade, with minimal contribution from the overlying pavement layers. The AASHTO 1986 Guide provides regression equations for subgrade modulus estimation. For instance, ESG = 0.00803 × (P/D3) where D3 is the deflection at 3 feet (914 mm) from the load center, and P is the applied load. Similarly, the equation MR = P × (1 - μ²) / (π × Dr × r) from the NCHRP study by Darter et al. (1991) provides a theoretically justified approach incorporating Poisson’s ratio effect, reducing to MR = 0.00743 × (P/D3) for a Poisson’s ratio of 0.40.
The Area under the deflection basin parameter, defined as A = 4D0 + 6D0.67 + 8D1 + 12D2 + 6D3 (with sensor positions in feet), provides a composite shape factor that correlates with the overall pavement structural number. South African researchers developed correlations linking far-field deflection at 2000 mm (78.7 inches) to subgrade modulus: log10 ESG = 9.727 - 0.989 × log10 δ2000, where δ2000 is the deflection in micrometers at 2000 mm from the load.
Back-Calculation of Pavement Layer Moduli
Back-calculation is the analytical process of determining pavement layer elastic moduli from measured deflection basin data. The process works inversely to forward pavement analysis: whereas forward analysis calculates deflections from known layer properties and loads, back-calculation starts with measured deflections and derives the layer moduli that would produce those deflections. This is accomplished through iterative computational methods using layered elastic theory (LET) or finite element analysis (FEA) .
The back-calculation process begins with an initial estimate of layer moduli and thicknesses for each pavement layer — typically surface, base, subbase, and subgrade. The analyst inputs these initial values along with the measured load magnitude and sensor geometry into back-calculation software. The software computes theoretical deflections at each sensor location using layered elastic theory and compares them to the measured deflections. The difference between computed and measured deflections is quantified by the root mean square (RMS) error between the measured and computed deflection basins. The software then iteratively adjusts the layer moduli (typically using modified Newton-Raphson or genetic algorithm optimization) to minimize the RMS error. The process continues until the RMS error drops below a user-defined threshold, typically 1% to 3%, and the moduli converge to stable values.
Common back-calculation software packages include ELMOD (Evaluation of Layer Moduli and Overlay Design) by Dynatest, DARWin by AASHTO, EVERCALC by the Washington State DOT, MODCOMP by Cornell University, BACKGA (genetic algorithm-based), and MODULUS by the Texas Transportation Institute. ELMOD, developed by Dynatest and available exclusively for their FWD equipment, performs back-calculation in less than one second per drop sequence and includes modules for seasonally adjusted moduli, residual life calculation, overlay design, and life-cycle cost analysis.
Critical inputs required for accurate back-calculation include: layer thicknesses (typically obtained from construction records, coring, or Ground Penetrating Radar), the applied load magnitude, measured deflections at all sensor positions, Poisson’s ratio for each layer (typically assumed as 0.35 for asphalt, 0.20 for concrete, 0.40 for granular base, and 0.45 for subgrade), and the layer configuration (number of layers and whether the subgrade is semi-infinite or has a rigid boundary at depth). The thickness of each layer must be known or estimated, as the back-calculation problem is mathematically underdetermined — different combinations of modulus and thickness can produce similar deflection basins.
The uniqueness problem — the fact that multiple combinations of layer moduli can produce nearly identical deflection basins — requires careful interpretation of back-calculation results. To improve reliability, practitioners should: constrain moduli to realistic ranges based on material type; use independent thickness measurements (GPR or coring); validate results against known pavement performance; and conduct sensitivity analyses to assess the effect of input variations. FHWA’s LTPP program has developed extensive guidelines for standardized back-calculation procedures to ensure consistency across different agencies and software platforms.
For flexible pavements, back-calculation typically solves for the modulus of the asphalt concrete surface, the granular base modulus, and the subgrade resilient modulus. The effective structural number (SN_eff) can then be computed from the back-calculated moduli using AASHTO equations, providing a direct comparison with the required structural number for future traffic. For rigid pavements, back-calculation solves for the concrete modulus of rupture, the modulus of subgrade reaction (k-value), and the load transfer efficiency at joints.
Load Transfer Efficiency at Joints and Cracks
In rigid (concrete) pavements, the Load Transfer Efficiency (LTE) across transverse joints and cracks is a critical performance parameter that FWD testing can quantify directly. Load transfer is the mechanism by which a load applied to one concrete slab is partially transferred to the adjacent slab across the joint or crack, reducing the deflection and stress on the loaded slab. The primary load transfer mechanisms in jointed concrete pavements are aggregate interlock (mechanical interlocking of fractured aggregate particles at the joint interface) and dowel bars (steel bars placed across joints to transfer shear loads).
The FWD test for LTE measurement involves positioning the loading plate approximately 150 mm (6 inches) from the joint on the approach (loaded) slab, with deflection sensors placed on both sides of the joint. The test is typically conducted with a 40 kN (9,000 lbf) load for highway pavements. LTE is calculated as: LTE = (D_unloaded / D_loaded) × 100%, where D_loaded is the deflection at the sensor on the joint edge of the loaded slab, and D_unloaded is the deflection at the sensor on the opposite side of the joint on the adjacent slab.
LTE interpretation thresholds are well established in pavement practice. Values above 80% indicate excellent load transfer, suggesting sound aggregate interlock or properly functioning dowel bars. Values between 60% and 80% indicate moderate load transfer, warranting monitoring and potentially corrective action if the trend is deteriorating. Values below 60% indicate poor load transfer, suggesting loss of aggregate interlock, dowel bar deterioration, or joint faulting, requiring rehabilitation such as dowel bar retrofit or slab stabilization. For airport pavements, FAA guidelines specify more stringent LTE thresholds due to the higher consequences of joint failure under heavy aircraft loads.
Void detection beneath concrete slabs is performed concurrently with LTE testing. The FWD drops multiple loads at the same test point — typically 40 kN, 53 kN, and 71 kN (9,000, 12,000, and 16,000 lbf) — and plots the measured deflection against the applied load. If subsurface voids exist beneath the slab, the slab must first compress the void space before deflecting the subgrade, producing a non-linear deflection-load relationship. The y-intercept of the best-fit line through the data points represents the deflection at zero load (D0). A D0 value greater than 0.003 inches (3 mils, or approximately 75 micrometers) indicates the likely presence of voids beneath the slab. Void detection is critical for planning slab stabilization (grouting) and preventing slab cracking and faulting.
Remaining Life Estimation from FWD Data
FWD deflection data can be used to estimate the remaining structural life of a pavement — the number of years or traffic load applications before the pavement requires major rehabilitation. This estimation uses either empirical or mechanistic-empirical methods, depending on the available data and analysis software.
The empirical approach using the AASHTO method converts back-calculated layer moduli into an effective structural number (SN_eff) for flexible pavements or an effective slab thickness for rigid pavements. The SN_eff is compared to the structural number required for the anticipated future traffic (SN_req), and the remaining life is expressed as a ratio. For flexible pavements, the remaining life factor (RLF) is calculated using: RLF = (SN_eff / SN_req)^n, where n is an empirical exponent typically ranging from 2.5 to 4.0 depending on the terminal serviceability level. The remaining number of equivalent single axle loads (ESALs) that the pavement can carry is: N_remaining = N_initial × RLF, where N_initial is the traffic at which the structural number was originally designed.
The mechanistic-empirical approach uses back-calculated layer moduli to compute critical pavement responses — the horizontal tensile strain at the bottom of the asphalt layer (for fatigue cracking) and the vertical compressive strain at the top of the subgrade (for permanent deformation/rutting). These computed strains are entered into transfer functions (calibrated failure models) to predict the number of load repetitions to failure. The AASHTO Mechanistic-Empirical Pavement Design Guide (MEPDG) and the FAA’s FAARFIELD program use this approach. The remaining life is expressed as 1 - (N_applied / N_failure) × 100%, where N_applied is the traffic already applied and N_failure is the predicted traffic to failure.
Seasonal effects significantly influence remaining life estimates. Subgrade modulus varies substantially between spring thaw (lowest modulus, highest vulnerability), summer (intermediate), and winter (highest modulus when frozen). FWD testing conducted during the spring thaw recovery period — when the subgrade is weakest — produces the most conservative (shortest) remaining life estimate. The FHWA LTPP program recommends testing at minimum in spring and fall to capture seasonal variation. ELMOD software includes seasonal adjustment modules that normalize moduli to standard conditions for consistent year-round assessment.
The integration of FWD structural data with Pavement Condition Index (PCI) survey data provides the most comprehensive pavement condition assessment. While PCI captures surface distresses that affect ride quality and immediate maintenance needs, FWD data reveals structural deficiencies that visual inspection cannot detect — subgrade weakening, base deterioration, and layer delamination. Research by Gkyrtis et al. (2021) demonstrated that integrating FWD deflectometric data with Road Surface Profiler (RSP) roughness data and Ground Penetrating Radar (GPR) thickness data provides a holistic assessment that neither method can achieve independently. A pavement with good surface condition (high PCI) but low structural capacity (low back-calculated moduli) requires different rehabilitation than a pavement with poor surface condition but adequate structure.
Heavy Weight Deflectometer for Airport Pavements
The Heavy Weight Deflectometer (HWD) is the variant of the FWD specifically designed for airport pavement structural evaluation. Developed by Dynatest as the first commercially available HWD, it shares the same operating principles as the standard FWD but applies significantly higher loads — ranging from 30 kN to 320 kN (approximately 6,700 to 72,000 lbf) — to simulate the wheel loads of the largest commercial aircraft, including the Boeing 777, Boeing 747, Airbus A340, and Airbus A380. The HWD loading plate is typically 300 mm or 450 mm in diameter, depending on the testing protocol and the gear configuration being simulated.
Airport pavement structural evaluation using HWD is governed by standards from the International Civil Aviation Organization (ICAO) and the Federal Aviation Administration (FAA) . ICAO Annex 14 establishes the framework for airfield pavement strength reporting, while FAA Advisory Circulars provide detailed technical guidance. The HWD is the primary NDT device used for determining the Pavement Classification Rating (PCR) under the new ACR/PCR (Aircraft Classification Rating / Pavement Classification Rating) system that replaced the legacy ACN/PCN system in November 2024.
The ACR/PCR system, approved by ICAO in 2019 and mandated for all ICAO member states from September 2024, represents a fundamental shift in how airport pavement strength is reported. Unlike the previous ACN/PCN system — which was based on empirical CBR design procedures from 1983 and used equivalencies to single wheels — the ACR/PCR system uses critical strain as the damage indicator, calculated through layered elastic analysis. This provides consistency between pavement design models (FAARFIELD) and pavement strength rating models, eliminating the paradox where a pavement designed for a specific aircraft could receive a PCN that restricted that same aircraft’s operation. The HWD provides the deflection data required to calculate PCR using the mechanistic-empirical framework, including back-calculated layer moduli and computed critical strains at the bottom of bound layers and top of subgrade.
The HWD enables airport operators to conduct bearing capacity surveys for runway, taxiway, and apron pavements in accordance with FAA requirements. The output includes layer moduli that feed directly into the FAARFIELD design program, estimates of remaining structural life in terms of equivalent annual departures of the critical design aircraft, and identification of the weakest layer in the pavement structure for targeted rehabilitation. HWD testing is also used for quality assurance of new airport pavement construction, verifying that as-built structural capacity meets design specifications before the pavement is opened to traffic.
Dynatest’s ELMOD software includes a dedicated ACR/PCR module that calculates both the new ACR/PCR classification and the traditional ACN/PCN values for transitional periods. The module performs full mechanistic analysis using the ICAO-specified layered elastic procedures, computing the pavement response in terms of horizontal strain at the bottom of bound layers and vertical strain at the top of subgrade, and comparing these against allowable strain criteria for the specified number of coverages.
FWD Testing Frequency and Network-Level Surveys
The implementation of FWD testing for network-level pavement management requires careful consideration of testing frequency, spatial sampling density, and seasonal timing. The objective of network-level FWD surveys is to obtain representative structural data across an entire pavement network without testing every section at every location, balancing data quality against survey cost and traffic disruption.
Spatial sampling for network-level FWD surveys typically employs a stratified random sampling approach. FHWA research by the Kansas Department of Transportation (KDOT) recommended testing approximately 20% of the network mileage for network-level structural evaluation, translating to approximately 750 lane-miles of FWD testing per year for a typical state highway network. Testing intervals of 160 m to 320 m (0.1 to 0.2 miles) per lane are standard for network-level surveys, with project-level evaluations using intervals of 15 m to 30 m for detailed analysis of specific sections. The required test spacing depends on the variability of the pavement structure and the desired confidence level of the structural assessment.
Temporal frequency — how often each pavement section should be retested — depends on pavement type, traffic level, age, and historical performance trends. Typical recommendations call for FWD testing every 3 to 5 years for network-level monitoring, with more frequent testing (every 1 to 2 years) for high-traffic routes and pavements approaching their design life. Seasonal testing at multiple times per year (spring, summer, fall) is recommended for the first year of a new survey program to establish seasonal modulus variation baselines, after which testing can be reduced to a single season with seasonal adjustment factors applied. The spring thaw period (March to May in northern climates) is particularly critical for flexible pavements, as this is when subgrade modulus is lowest and pavement vulnerability to load-induced damage is greatest.
Operational considerations significantly affect FWD survey planning. Testing speeds are typically 2 to 5 km/h (1 to 3 mph) between test points, with each test requiring 20 to 30 seconds for positioning, dropping, and recording. At 60 test points per hour with a four-drop sequence (one seating drop plus three recording drops), a typical network survey can cover 15 to 25 km (10 to 15 miles) per day, depending on traffic control requirements and site access conditions. Traffic control — including lane closures, shadow vehicles with arrow boards, and flaggers — is required as the FWD operates as a stationary testing device, making night-time or off-peak testing advantageous for high-volume highways.
Data management for network-level FWD surveys involves integration with the agency’s Pavement Management System (PMS) . FWD test results — including D0, SCI, back-calculated layer moduli, and remaining life estimates — are georeferenced using GPS coordinates and linked to the PMS’s pavement section inventory. The PMS uses this structural data alongside surface condition data (PCI, IRI, rut depth) to determine optimal maintenance and rehabilitation strategies, typically through a prioritized ranking of sections by remaining life, traffic level, and criticality.
Integration with Visual Condition Surveys and Ground Penetrating Radar
The most effective pavement evaluation programs integrate FWD structural data with visual condition surveys (PCI) and Ground Penetrating Radar (GPR) thickness measurements to produce a comprehensive understanding of pavement condition that no single method can provide independently.
PCI surveys document the type, severity, and density of surface distresses — cracking, rutting, spalling, faulting, raveling, and other defects — according to standardized protocols (ASTM D5340 for airports, ASTM D6433 for roads). While PCI indicates surface condition and functional performance, it cannot assess structural capacity. A pavement may exhibit low PCI (many surface defects) but adequate structural capacity requiring only surface treatment, or high PCI (few surface defects) but critically low structural capacity requiring full reconstruction. The integration of FWD data with PCI data resolves these ambiguities, enabling the development of treatment selection matrices that recommend the appropriate rehabilitation strategy based on both structural and functional condition.
For example, transportation agencies commonly apply the following decision logic: sections with high PCI (>70) and high structural capacity (remaining life > 10 years) require only routine maintenance. Sections with high PCI but low structural capacity require structural overlay or reconstruction despite good surface appearance. Sections with low PCI but high structural capacity are candidates for surface treatments (mill and fill, slurry seal, thin overlay) without structural strengthening. Sections with low PCI and low structural capacity require major rehabilitation including structural overlay or full reconstruction.
GPR provides accurate layer thickness measurements that are essential for accurate back-calculation. The back-calculation problem is mathematically ill-posed — different combinations of layer modulus and layer thickness can produce identical deflection basins. Without accurate thickness data, back-calculation results may be non-unique and unreliable. GPR systems operating at 1.0 GHz (air-launched horn antenna) can measure layer thicknesses to within 5% to 10% accuracy at highway speeds, eliminating the need for extensive coring programs. When combined with FWD testing, GPR reduces coring requirements by 80% to 90%, significantly reducing project costs while providing more comprehensive structural data than traditional coring programs.
The integration of FWD, GPR, and PCI data within a Pavement Management System (PMS) enables lifecycle cost analysis (LCCA) that optimizes maintenance timing and treatment selection. Research demonstrates that data-driven pavement management using structural data typically extends overall network life by 20% to 30% compared to visual inspection-based decisions, while maximizing budget efficiency through appropriate treatment application at the optimal time.
Standards Governing FWD Testing
FWD testing is governed by a suite of international and national standards that ensure consistency, repeatability, and regulatory acceptance of deflection measurements worldwide.
ASTM D4694-09 — Standard Test Method for Deflections with a Falling-Weight-Type Impulse Load Device — defines the equipment specifications and test procedure for FWD measurements. The standard specifies the loading plate diameter (300 mm), the allowable load pulse duration (20-40 milliseconds), the peak force range (minimum 6.7 kN for routine testing), the deflection sensor accuracy requirements (±2% of reading or ±2 micrometers, whichever is greater), and the sensor spacing configuration. ASTM D4694 requires that the load cell be calibrated annually and deflection sensors be calibrated at intervals not exceeding 12 months, with relative calibrations performed before and after each major survey.
ASTM D4695-03 (Reapproved 2020) — Standard Guide for General Pavement Deflection Measurements — provides comprehensive guidance on the planning, execution, and reporting of deflection testing programs. It covers test location selection, testing patterns (wheelpath versus between wheelpaths), frequency of testing, temperature monitoring, data recording requirements, and reporting formats. The guide addresses both flexible and rigid pavement testing protocols and provides recommendations for deflection measurement applications including structural evaluation, joint efficiency assessment, void detection, and overlay design.
ASTM D5858 — Guide for Calculating In Situ Equivalent Elastic Moduli of Pavement Materials — provides standardized procedures for calculating layer moduli from deflection measurements using back-calculation analysis. The guide addresses the selection of layered elastic theory parameters, convergence criteria, modulus constraints, and validation procedures. It emphasizes the importance of independent layer thickness measurements and recommends reporting ranges of moduli rather than single values to reflect the inherent variability and uncertainty in back-calculation results.
AASHTO R32-11 — Standard Practice for Calibrating the Load Cell and Deflection Sensors for Falling Weight Deflectometers — establishes the calibration protocol that ensures measurement traceability to national standards. The practice specifies annual reference calibration at an approved FWD calibration center, monthly relative calibration checks, and calibration documentation requirements. The calibration procedure involves placing all sensors in a single line on a rigid surface and applying known loads, with each sensor’s output compared against a reference sensor to verify consistency within ±2%.
ICAO Annex 14 — Aerodromes, Volume I — establishes the international requirements for airfield pavement strength evaluation, including the use of HWD for determining PCR under the ACR/PCR system. The standards specify testing intervals, data analysis requirements, and reporting formats for airport pavement structural evaluations.
FAA Advisory Circular AC 150/5335-5D — Standardized Method of Reporting Airport Pavement Strength — PCR — provides detailed guidance for conducting HWD testing and calculating PCR for airport pavements. The AC references the use of layered elastic analysis per FAARFIELD procedures and specifies the equivalent annual departure calculations, material characterization protocols, and reporting requirements.
Summary
The Falling Weight Deflectometer is the established standard for non-destructive structural evaluation of pavement systems, providing quantitative deflection data that enables back-calculation of layer moduli, assessment of load transfer efficiency, detection of subsurface voids, and estimation of remaining pavement life. The Heavy Weight Deflectometer extends this capability to airport pavements, supporting the ICAO ACR/PCR classification system with loads that simulate the largest commercial aircraft. When integrated with Ground Penetrating Radar, visual condition surveys, and Pavement Management Systems, FWD data enables optimized, data-driven pavement maintenance and rehabilitation decisions that extend network life by 20% to 30% compared to visual inspection-based approaches alone. Compliance with ASTM D4694, D4695, D5858, and AASHTO R32 standards ensures consistent, repeatable, and regulatory-accepted measurements worldwide.
Frequently Asked Questions
A Falling Weight Deflectometer is a trailer-mounted or vehicle-mounted non-destructive testing device that applies a controlled impulse load to the pavement surface by dropping a known mass from a predetermined height onto a circular loading plate. The device measures the resulting vertical deflections at the center of the load plate and at multiple radial offset positions using geophone sensors. The measured deflection basin is analyzed using layered elastic theory to back-calculate the elastic moduli of pavement layers, evaluate structural capacity, and estimate remaining service life.
The FWD typically applies load ranges from 4 kN to 120 kN (900-27,000 lbf), suitable for highway and secondary road pavements. The HWD applies higher loads ranging from 30 kN to 320 kN (6,700-72,000 lbf), capable of simulating the wheel loads of large commercial aircraft such as the Boeing 777, Airbus A340, and A380. HWD testing is specifically required for airport pavement structural evaluation per FAA and ICAO standards, particularly for determining Pavement Classification Rating (PCR) under the new ACR/PCR classification system.
Deflection basin analysis involves evaluating the shape and magnitude of the pavement surface deflection bowl created by the FWD impulse load. The maximum deflection (D0) occurs at the load center, while outer sensors measure deflections at increasing radial distances. Back-calculation is an iterative mathematical process where measured deflections are matched against theoretical deflections computed using layered elastic analysis. Computer software such as ELMOD, DARWin, or EVERCALC adjusts layer moduli until the computed deflection basin matches the measured one within an acceptable error tolerance.
Load Transfer Efficiency measures how effectively a concrete pavement joint or crack transfers load from one slab to the adjacent slab. The FWD drop is positioned approximately 6 inches from the joint on the approach slab, with sensors placed on both sides of the joint. LTE is calculated as (D_unloaded / D_loaded) × 100%, where D_loaded is the deflection of the loaded slab and D_unloaded is the deflection of the adjacent slab. LTE values above 80% indicate good load transfer, while values below 60% suggest the need for joint rehabilitation.
FWD testing is governed by several international standards: ASTM D4694-09 (Standard Test Method for Deflections with a Falling-Weight-Type Impulse Load Device), ASTM D4695-03 (Standard Guide for General Pavement Deflection Measurements), ASTM D5858 (Guide for Calculating In Situ Equivalent Elastic Moduli of Pavement Materials), and AASHTO R32-11 (Standard Practice for Calibrating the Load Cell and Deflection Sensors for Falling Weight Deflectometers). For airport applications, ICAO Annex 14, FAA AC 150/5335-5D, and FAA AC 150/5370-11B provide additional guidance.
For network-level pavement management surveys, FWD testing is typically performed at intervals of 160 m to 320 m (one test every 0.1 to 0.2 miles) in each lane, representing approximately 20% of the total network mileage. Testing is conducted at a rate of up to 60 test points per hour with a typical sequence of four load drops per test point. For project-level evaluations, testing intervals are reduced to 15 m to 30 m. Seasonal testing (spring, summer, fall) is recommended to capture subgrade modulus variations due to frost thaw and moisture changes.
Yes, FWD data is most effective when integrated with complementary evaluation methods. Ground Penetrating Radar (GPR) provides accurate pavement layer thickness measurements, eliminating the need for extensive coring and improving back-calculation accuracy. Visual condition surveys (PCI surveys) provide surface distress mapping that correlates with structural findings. Road Surface Profiler (RSP) data provides International Roughness Index (IRI) measurements. The integration of FWD, GPR, and surface condition data enables a comprehensive pavement management approach that optimizes maintenance planning and budget allocation.
Optimize Your Pavement Management Program
Leverage FWD structural evaluation data for data-driven pavement maintenance, rehabilitation planning, and lifecycle cost optimization. Contact our specialists to learn how deflection testing can extend your pavement network's service life.
FWD deflection data analysis processes the measured deflection basin from FWD testing to back-calculate the elastic modulus of each pavement layer (HMA, base, s...
Light Weight Deflectometer (LWD) for Construction QC
The Light Weight Deflectometer (LWD) is a portable non-destructive testing device that drops a known weight onto a loading plate to measure surface deflection a...
Load transfer devices (dowel bars, tie bars, aggregate interlock, keyed joints) transfer wheel loads across joints and cracks in concrete pavements, preventing ...
22 min read
Concrete Design
Pavement Engineering
+1
Cookie Consent We use cookies to enhance your browsing experience and analyze our traffic. See our privacy policy.