Fatigue testing evaluates a material’s resistance to repeated loading, measuring the number of cycles to failure at various stress/strain levels. For asphalt, this includes beam fatigue (4-point bending per AASHTO T321) and indirect tensile fatigue (AASHTO TP107); for concrete, flexural fatigue per ASTM C78. Fatigue life is a primary input for mechanistic-empirical pavement design. Covers test types, S-N curves, and relevance to alligator cracking inspection.
What is Fatigue Testing?
Fatigue testing is a laboratory procedure that determines the resistance of a material to failure under repeated (cyclic) loading. In pavement engineering, fatigue testing evaluates how many load applications an asphalt mixture or concrete material can withstand before cracking initiates and propagates to failure. The test measures the relationship between applied stress or strain level and the number of cycles to failure (Nf) , expressed graphically as an S-N curve (stress vs. cycles) or a strain-based fatigue relationship.
Fatigue testing is essential because pavement materials in service experience millions of repeated loading cycles from traffic. Each vehicle pass generates a tensile strain pulse at the bottom of the asphalt layer (for flexible pavements) or a flexural stress in the concrete slab (for rigid pavements). Over time, these repeated loads cause the accumulation of micro-damage in the material — micro-cracks that initiate, grow, and coalesce into visible macro-cracks that appear on the pavement surface as alligator (fatigue) cracking.
The concept of fatigue failure in pavements was first recognized in the 1950s and 1960s through accelerated pavement testing and field performance observations. Research by the Asphalt Institute, the University of California at Berkeley (Monismith, 1966), and the Shell Laboratories established the fundamental relationships between tensile strain and fatigue life that form the basis of modern pavement design. The Shell Pavement Design Manual (1978) and the Asphalt Institute MS-1 (9th Edition, 1981) incorporated fatigue relationships that remain in use today, refined through subsequent research under the Strategic Highway Research Program (SHRP) , the National Cooperative Highway Research Program (NCHRP) , and the Long-Term Pavement Performance (LTPP) program.
Fatigue testing serves multiple critical functions in pavement engineering. It provides material characterization data used to rank mixtures for fatigue resistance during the mix design process. It supplies input parameters for the Mechanistic-Empirical Pavement Design Guide (MEPDG) implemented in the AASHTOWare Pavement ME Design software. It enables forensic evaluation of premature pavement failures by comparing measured fatigue properties to design expectations. And it supports research and development of improved materials, including polymer-modified binders, recycled asphalt pavement (RAP) mixtures, warm-mix asphalt technologies, and fiber-reinforced materials.
AASHTO T321 — Beam Fatigue Test (4-Point Bending)
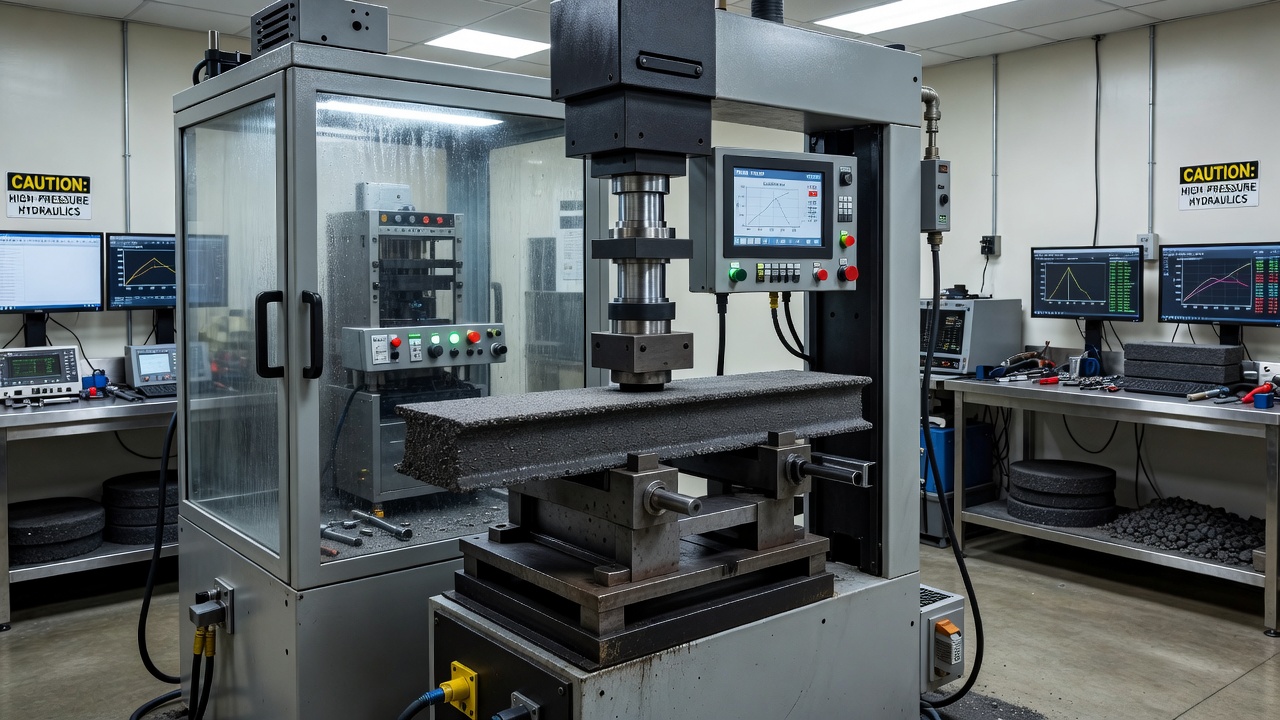
AASHTO T321-17 (Standard Method of Test for Determining the Fatigue Life of Compacted Asphalt Mixtures Subjected to Repeated Flexural Bending) is the primary standard for asphalt mixture fatigue testing in North America and internationally. The test, known as the beam fatigue test or 4-point bending fatigue test, subjects a rectangular prismatic beam specimen to repeated haversine (sinusoidal) loading in controlled-strain mode until failure.
Test Specimen Requirements
The test specimen is a rectangular beam sawed from a laboratory-compacted slab or a field core, with finished dimensions of 380 ± 6 mm length × 50 ± 6 mm height × 63 ± 6 mm width. The beam is prepared from material compacted according to AASHTO PP 3 (Slab Compaction) or from roadway cores obtained per ASTM D5361. A minimum of 6 mm must be sawed from both sides of the compacted slab to produce parallel, smooth saw-cut surfaces free of edge damage. The target air void content is typically 7% ± 1%, representing the in-service air void level after construction compaction and some initial traffic densification. The Nominal Maximum Aggregate Size (NMAS) of the mixture must be ≤ 19 mm to ensure the specimen dimensions provide adequate aggregate-to-specimen size ratio.
Test Procedure and Setup
The test is conducted in a servo-hydraulic or electromechanical testing frame equipped with a 4-point bending fixture that applies loading through two inner clamps (119 mm center-to-center) while the beam is supported on two outer clamps spaced 357 mm apart. The loading fixture is housed in a temperature-controlled chamber maintained at the test temperature ± 0.5°C.
The standard test procedure involves conditioning the specimen at the test temperature (typically 20°C for standard testing) for a minimum of 2 hours, mounting the beam in the 4-point bending fixture with the clamps tightened to prevent slippage without inducing pre-stress, applying a haversine (sinusoidal) loading waveform at a frequency of 5-10 Hz (10 Hz is standard) in controlled-strain mode (constant displacement amplitude), selecting a strain level typically in the range of 250-750 microstrain for conventional mixtures (up to 2000 microstrain may be used for highly modified or experimental mixtures), continuing loading until the specimen reaches the defined failure criterion, and recording load, deflection, and phase angle data at specified intervals.
Key Calculated Parameters
Parameter
Formula
Units
Typical Values
Maximum Tensile Stress (σₜ)
σₜ = (0.357 × P) / (b × h²)
Pa (kPa or MPa)
500-3000 kPa
Maximum Tensile Strain (εₜ)
εₜ = (12 × δ × h) / (3L² - 4a²)
m/m (microstrain)
200-800 με
Flexural Stiffness (S)
S = σₜ / εₜ
Pa (MPa)
5000-12000 MPa
Phase Angle (φ)
φ = 360 × f × s
degrees
20-45°
Dissipated Energy per Cycle (D)
D = π × σₜ × εₜ × sin(φ)
J/m³
100-500 J/m³
Where: P = peak-to-peak load (N), b = beam width (m), h = beam height (m), δ = maximum deflection at beam center (m), L = span between outer clamps (0.357 m), a = spacing between inner and outer clamps (0.119 m), f = loading frequency (Hz), s = time lag between load and deflection peaks (s).
Failure Definition
AASHTO T321-17 defines failure as the cycle at which the product of flexural stiffness × number of load cycles (S × n) reaches a maximum (peak) value. This point corresponds to the initiation of a macro-crack in the beam. The method uses a 6th-order polynomial fit to smooth the S×n vs. cycles data, and the peak is identified as the maximum of the fitted curve. Testing continues until the S×n value has reduced from the peak by at least 15%.
The older failure criterion — 50% reduction from initial stiffness (measured at cycle 50) — is still used by some practitioners for comparative purposes but is no longer the primary criterion in the current standard. The energy-based S×n peak criterion (similar to the now-withdrawn ASTM D7460) provides a more physically meaningful definition of fatigue failure and is less sensitive to the arbitrary selection of the initial stiffness reference point.
Typical Fatigue Life Results
Strain Level (με)
Typical Cycles to Failure
Test Duration
200
500,000 - 2,000,000+
Days to weeks
400
10,000 - 200,000
Hours to days
800
500 - 10,000
Hours
1600
50 - 500
Minutes to hours
Interpretation and Application
The beam fatigue test produces a strain-fatigue life relationship that follows a power law model: Nf = K₁(1/ε_t)^K₂ where Nf = cycles to failure, ε_t = tensile strain, and K₁ and K₂ are mixture-specific regression constants. The slope parameter K₂ typically ranges from 3 to 6, with higher values indicating greater strain sensitivity (more rapid reduction in fatigue life with increasing strain). The intercept parameter K₁ reflects the overall fatigue resistance level.
A shift factor of 10 to 20 is applied to relate laboratory beam fatigue life to field pavement performance. This shift accounts for several differences between laboratory and field conditions: continuous loading in the lab versus intermittent loading with rest periods in the field, lateral wander of wheel loads distributing damage across the pavement width, healing during rest periods, temperature and moisture gradients in the field, and crack propagation differences between thin beams and full-depth pavement layers.
AASHTO TP107 — Direct Tension Cyclic Fatigue Test (AMPT)
AASHTO TP107-18 (Determining the Damage Characteristic Curve of Asphalt Mixtures from Direct Tension Cyclic Fatigue Tests) is a provisional standard that uses the Asphalt Mixture Performance Tester (AMPT) to determine the fundamental damage characteristic curve of an asphalt mixture under cyclic direct tension loading. Unlike the empirical beam fatigue test, TP107 is rooted in continuum damage mechanics and provides a fundamental material property rather than an empirical index.
Test Specimen and Setup
The test uses cylindrical specimens 100 mm in diameter × 130 mm in height cored from Superpave Gyratory Compactor (SGC) compacted specimens. End plates are glued to both ends of the specimen with fully-cured epoxy to transmit direct tension loading without eccentricity. The gauge length for deformation measurement is typically 70 mm.
Test Procedure
The test temperature is determined from the LTPP Bind weather database using the formula T_test = (HTPG + LTPG)/2 + 4°C, with a maximum test temperature of 21°C. The test is conducted at a minimum of three different strain levels (typically 300, 500, and 800 microstrain) selected based on the mixture’s dynamic modulus (|E*|) per FHWA lookup tables. Each specimen is tested in less than one hour, making the AMPT method significantly faster than beam fatigue testing.
Between the fingerprint test and the cyclic fatigue test, a 20-45 minute rest period is required to allow the specimen to recover from any viscoelastic effects induced during the fingerprint characterization.
Theoretical Foundation and Key Output
The TP107 method is based on three principles: filtering of test data to isolate fatigue damage from viscoelastic and viscoplastic effects, a universal damage evolution law relating stiffness reduction to accumulated damage, and application of time-temperature superposition (t-TS) to reduce testing time.
The fundamental output is the damage characteristic curve — a plot of the pseudo stiffness (C) versus damage parameter (S) . This curve is a material property independent of loading mode, temperature, and loading history. The failure criterion is defined by the peak in the phase angle — the cycle at which the phase angle reaches a maximum and begins to decrease, indicating the formation of a macro-crack.
Advantages Over Beam Fatigue
The AMPT method offers several significant advantages over beam fatigue testing: test duration is measured in hours rather than days or weeks, specimen preparation is simpler and requires less material, the method provides a fundamental material property (damage characteristic curve) rather than an empirical fatigue index, and the results can be used to predict both bottom-up and top-down cracking in structural analysis platforms.
Limitations
The AMPT method is a provisional standard (TP designation) and has not yet been elevated to full AASHTO standard status. The test requires specialized equipment (the AMPT) and software for data analysis. The damage characteristic curve is not directly compatible with the traditional fatigue transfer functions used in the MEPDG, requiring additional analysis to convert the results to conventional fatigue parameters.
Texas Overlay Test (TxDOT Tex-248-F)
The Texas Overlay Test (TxDOT Tex-248-F) is a specialized fatigue test developed by the Texas Department of Transportation (TxDOT) in collaboration with the Texas A&M Transportation Institute (TTI) to evaluate an asphalt mixture’s resistance to reflective cracking in overlay applications. While beam fatigue (AASHTO T321) simulates bottom-up fatigue cracking from traffic loading, the overlay test directly simulates the opening and closing movement of an existing crack or joint beneath a new asphalt overlay.
Test Specimen
Specimens are prepared from SGC-compacted cylinders (150 mm diameter × 115 ± 5 mm height) or field cores. The compacted cylinder is trimmed to final dimensions of 150 ± 2 mm length × 76 ± 0.5 mm width × 38 ± 0.5 mm height, with a rectangular cross-section of approximately 76 × 38 mm. Laboratory specimens are compacted to 93% ± 1% relative density (95% ± 1% for Crack Attenuating Mixture, CAM). Three replicate specimens are tested per mixture.
Test Procedure
A centerline is drawn on the specimen, and the specimen is glued between two steel base plates using epoxy, with a 4.2 mm gap between the plates representing the opening in the existing pavement. The epoxy is cured for a minimum of 24 hours. The assembly is conditioned at 25 ± 0.5°C for at least one hour, then mounted in the Overlay Tester.
Loading is applied as a triangular waveform at 0.1 Hz (10 seconds per cycle) using a constant maximum displacement of ±0.315 mm (0.025 inches) , producing a total stroke of 0.63 mm. This displacement simulates the thermal and traffic-induced opening and closing of an underlying crack. The test terminates when the peak load reduces by 93% from the first cycle or at 1,000 cycles, whichever occurs first.
Key Output Parameters
Parameter
Formula/Source
Interpretation
Critical Fracture Energy (Gc)
Gc = Wc / (b × h)
Energy required to initiate a crack; higher values indicate better crack initiation resistance
Crack Resistance Index (CRI, β)
Fitted from y = x^(0.0075β - 1)
Ductility/flexibility during crack propagation; higher values indicate more ductile behavior
Cycles to Failure
Extrapolated to 93% load reduction
Total fatigue life under reflective cracking conditions
Where: Wc = area under the load-displacement curve (first cycle), b = specimen width (76.2 mm), h = specimen height (38.1 mm).
Application
The overlay test is used primarily for evaluating asphalt overlay mixtures designed to retard reflective cracking over existing cracked or jointed pavements. It is also applied to assess the crack resistance of modified binders, RAP/RAS mixtures, warm-mix asphalt, and other experimental materials. The Critical Fracture Energy (Gc) is the primary parameter used for mix acceptance and ranking in TxDOT specifications.
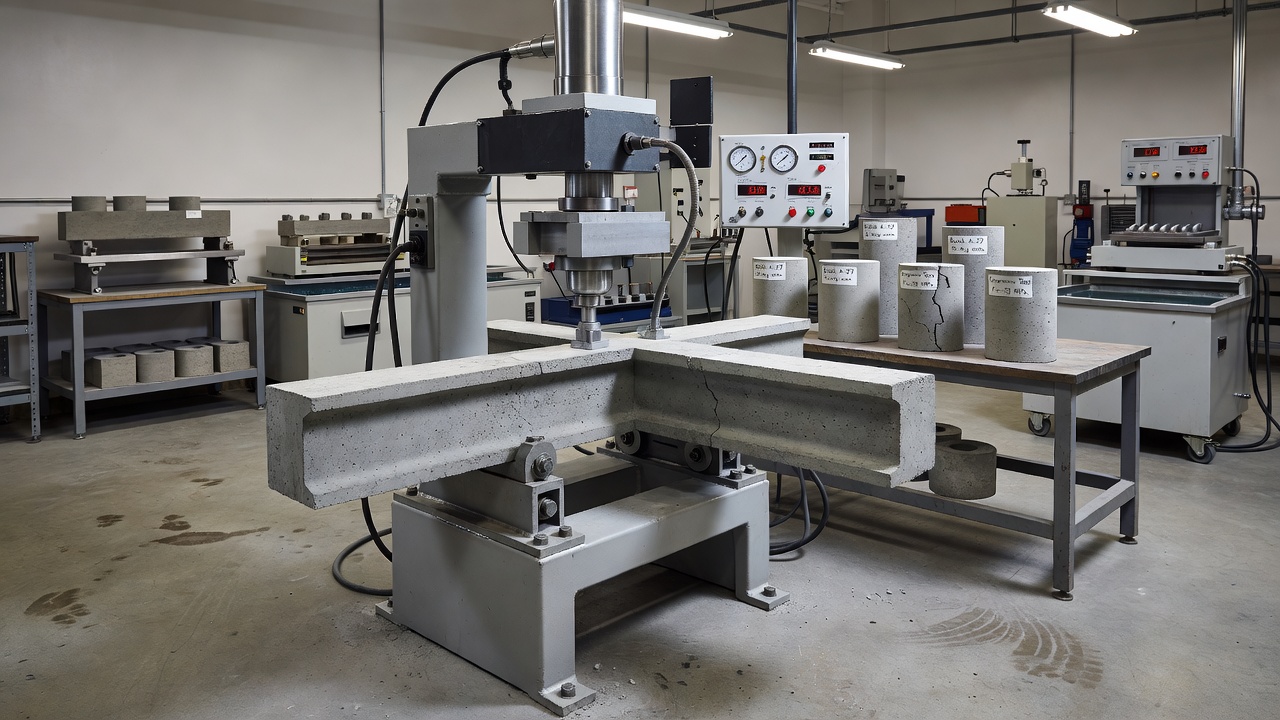
Concrete Fatigue Testing (Flexural Fatigue)
Concrete fatigue testing evaluates the resistance of Portland Cement Concrete (PCC) to failure under repeated flexural loading. Concrete is a brittle, elastic material that does not exhibit the viscoelastic healing behavior of asphalt. Its fatigue behavior is characterized by the stress ratio — the ratio of the applied flexural stress to the Modulus of Rupture (MOR) .
ASTM C78 — Modulus of Rupture Test
ASTM C78/C78M (Standard Test Method for Flexural Strength of Concrete Using Simple Beam with Third-Point Loading) is the standard test for determining the static flexural strength (MOR) of concrete. The test uses a 150 mm × 150 mm × 530 mm beam (standard size) loaded at the third points with a span length of 450 mm. Loading is applied at a rate that increases the extreme fiber stress at 0.9-1.2 MPa/min. The modulus of rupture is calculated as:
R = (P × L) / (b × d²)
Where: R = modulus of rupture (MPa), P = maximum applied load (N), L = span length (mm), b = average beam width (mm), d = average beam depth (mm).
Concrete Type
MOR (psi)
MOR (MPa)
Normal strength concrete
400-700
2.8-4.8
High strength concrete
700-1,000
4.8-6.9
Pavement concrete
550-750
3.8-5.2
Concrete Fatigue Relationships
Concrete fatigue under repeated loading follows an S-N relationship where the key parameter is the stress ratio (R = σ_max / MOR) . The Portland Cement Association (PCA) developed the standard fatigue equations for concrete pavement design:
Stress Ratio (σ/MOR)
Fatigue Relationship
> 0.55
log N = 11.737 - 12.077(σ/MOR)
0.45 < σ/MOR ≤ 0.55
N = (4.2577 / (σ/MOR - 0.4325))^3.268
σ/MOR ≤ 0.45
Infinite life (fatigue limit)
The concrete fatigue limit is approximately 50-55% of MOR, meaning that if the applied flexural stress is less than 50-55% of the static flexural strength, the pavement can theoretically withstand an infinite number of load repetitions without fatigue failure. This is analogous to the endurance limit concept in asphalt pavements but lacks the healing component that makes asphalt’s endurance limit partially reversible.
Practical Application
For rigid (concrete) pavement design using the MEPDG or the AASHTO Pavement ME Design software, the concrete fatigue relationship is used to calculate the allowable number of load repetitions based on the edge stress computed from Westergaard’s equations or layered elastic analysis. The fatigue damage is accumulated using Miner’s hypothesis, and failure is predicted when cumulative damage reaches 1.0.
S-N Curves — Stress vs. Cycles to Failure
The S-N curve (stress-number curve), also called the Wöhler curve, is the fundamental graphical representation of fatigue behavior. It plots the applied stress amplitude (S) on the vertical axis against the number of cycles to failure (N) on the horizontal axis, both on logarithmic scales.
Three Regions of an S-N Curve
An S-N curve exhibits three characteristic regions. The Finite Life Region is the inclined portion of the curve where increasing stress amplitude dramatically reduces the number of cycles to failure. This region follows a power law relationship and represents the domain where fatigue damage accumulates at a measurable rate. The Transition Zone (Knee Point) is the region where the curve begins to flatten, marking the transition from finite life to infinite life behavior. The knee point typically occurs between 10⁶ and 10⁷ cycles for pavement materials. The Endurance Limit Plateau is the horizontal asymptote representing the stress or strain level below which the material can theoretically withstand an infinite number of loading cycles without fatigue failure.
Basquin’s Equation
The classical representation of the S-N curve is Basquin’s equation: σₐ = σ’f × (2Nf)^b where σₐ = stress amplitude, σ’f = fatigue strength coefficient (approximately equal to the true fracture strength), Nf = cycles to failure, and b = fatigue strength exponent (the slope of the log-log S-N curve).
Material
Typical b Value
Steels
-0.05 to -0.12
Aluminum alloys
-0.06 to -0.14
Asphalt mixtures (strain-based)
-0.15 to -0.30 (corresponding to K₂ = 3-6)
Concrete
-0.03 to -0.07
S-N Curves for Asphalt Materials
For asphalt mixtures, the fatigue relationship is expressed as a strain-based power law rather than a stress-based relationship: Nf = K₁ × (1/ε_t)^K₂ or Nf = K₁ × (1/ε_t)^K₂ × (1/E)^K₃ where Nf = cycles to fatigue failure, ε_t = tensile strain at the bottom of the asphalt layer, E = stiffness modulus, and K₁, K₂, K₃ = regression constants.
Model
K₁
K₂
K₃
Source
Asphalt Institute
0.0796
3.291
0.854
AI MS-1
Shell (original)
0.0685
5.671
2.363
Shell Pavement Design Manual
MEPDG (default)
0.007566
-3.9492
-1.281
AASHTOWare Pavement ME
Monismith & Epps (1969)
2.38×10⁻⁵ to 5.85×10⁻¹⁰
3.0-5.7
—
Lab beam fatigue
S-N-P Curves
S-N-P curves (Stress-Number-Probability) account for the statistical scatter inherent in fatigue testing. The fatigue life at any given stress or strain level follows a log-normal distribution or, more accurately, a Weibull distribution. Design codes typically specify a 95% or 99% survival probability for critical structural components, meaning the design S-N curve represents the stress level at which only 5% or 1% of specimens would fail.
For pavement design using the MEPDG, the scatter in fatigue life is incorporated through the reliability input parameter, which adjusts the transfer function constants to achieve a specified probability of acceptable performance over the design life.
Miner’s Cumulative Damage Rule
Miner’s rule (also called Palmgren-Miner’s linear damage hypothesis) is the standard method for accumulating fatigue damage under variable loading: D = Σ(nᵢ / Nᵢ) where D = cumulative damage, nᵢ = number of applied cycles at stress/strain level i, and Nᵢ = number of cycles to failure at stress/strain level i. Fatigue failure is predicted to occur when D ≥ 1.0.
Miner’s rule is fundamental to the MEPDG approach where traffic is distributed across multiple axle loads and configurations. The tensile strain at the bottom of the asphalt layer is calculated for each load level, and the damage from each pass is accumulated using Miner’s hypothesis. The MEPDG uses a time-hardening approach rather than the simpler cycle-ratio approach, accounting for the order of loading in the damage accumulation process.
Fatigue in the Mechanistic-Empirical Pavement Design Guide (MEPDG)
The Mechanistic-Empirical Pavement Design Guide (MEPDG) , implemented in the AASHTOWare Pavement ME Design software, uses a mechanistic-empirical approach where fatigue testing data is directly incorporated into the pavement structural design process.
MEPDG Fatigue Cracking Model
The complete MEPDG bottom-up fatigue cracking model is:
Where: Nf = allowable number of load repetitions for fatigue cracking, ε_t = horizontal tensile strain at the bottom of the asphalt layer (from layered elastic analysis), E = dynamic modulus of the asphalt mixture (psi), k₁, k₂, k₃ = laboratory regression constants (nationally calibrated: k₁ = 0.007566, k₂ = -3.9492, k₃ = -1.281), βf₁, βf₂, βf₃ = local calibration factors (default = 1.0 for national calibration), and C = volumetric correction factor: C = 10^(4.84 × (Vb/(Va+Vb) - 0.69)) where Vb = effective binder content (%) and Va = air voids (%).
Transfer Function to Cracking Extent
The fatigue damage calculated by Miner’s rule is converted to a predicted cracking extent (in percent of lane area) using a sigmoidal transfer function: Fatigue Cracking (%) = 1 / (1 + e^(C₁ - C₂ × log(D))) where D = cumulative fatigue damage, and C₁ and C₂ are calibration constants (C₁ ≈ 1.0 for bottom-up cracking, C₂ ≈ 2.0 for bottom-up cracking).
This transfer function accounts for the fact that not all damage results in visible surface cracking — the damage must accumulate to a threshold level before cracks appear on the pavement surface. The sigmoidal shape produces an S-shaped curve where cracking increases slowly at first, then accelerates, and finally plateaus.
Laboratory-to-Field Shift Factor
The MEPDG incorporates a built-in laboratory-to-field shift factor that relates the laboratory Nf from beam fatigue testing to field performance. The shift factor is not simply a single multiplier but is embedded in the calibration of the k coefficients. The nationally calibrated default constants (k₁, k₂, k₃) already incorporate this shift, so they should not be used directly with laboratory fatigue test results without adjustment.
When a local agency wishes to perform local calibration, they must test mixtures with their local materials, construct test sections, monitor performance, and adjust the βf coefficients to match observed field performance. The AASHTO PP 105 (Provisional Standard for Local Calibration of the MEPDG) provides the procedures for this calibration process.
Key MEPDG Fatigue Inputs
Parameter
Typical Value
Determination Method
AC dynamic modulus (E*)
200,000 - 2,000,000 psi
AASHTO TP79 (AMPT)
AC layer thickness
100-400 mm (4-16 in.)
Design decision
Air voids (Va)
4.0% at Ndesign
AASHTO T312 / T209
Effective binder content (Vbe)
10-14%
Volumetric calculations
Poisson’s ratio (AC)
0.30-0.40
Assumed or measured
Fatigue shift factor
10-20
Local calibration
Fatigue and Alligator Cracking
Alligator cracking (also called fatigue cracking or crocodile cracking) is the direct field manifestation of the fatigue process measured in the laboratory. The interconnected, multi-directional cracks forming a pattern resembling alligator skin or crocodile skin result from the fatigue failure of the asphalt layer under repeated traffic loading.
Crack Development Mechanism
Alligator cracking develops through three distinct phases. Phase 1 — Crack Initiation: Under repeated traffic loading, the highest tensile strain occurs at the bottom of the asphalt layer (for conventional pavements) or at the surface (for thick pavements where the neutral axis shifts downward). When the tensile strain exceeds the material’s fatigue resistance, micro-cracks initiate at the location of maximum tensile stress. For bottom-up cracking, these micro-cracks are invisible from the surface during the initiation phase.
Phase 2 — Crack Propagation: Multiple micro-cracks propagate vertically upward (bottom-up) or downward (top-down) through the asphalt layer, coalescing with adjacent cracks to form interconnected crack networks. The propagation rate depends on the material properties, the magnitude of the tensile strain, the temperature of the pavement, and the presence of moisture. The characteristic alligator pattern — a series of interconnected polygons — develops as cracks propagate at different rates and intersect.
Phase 3 — Surface Failure: When the cracks reach the pavement surface, they become visible as the classic alligator cracking pattern. The cracks allow water to infiltrate the pavement structure, weakening the underlying layers through moisture damage and pumping of fines. As deterioration continues, the cracked pieces may become dislodged under traffic, leading to potholing.
Strain at the Bottom of the Asphalt Layer
The key parameter controlling fatigue cracking in the MEPDG is the horizontal tensile strain at the bottom of the asphalt layer (ε_t) computed from layered elastic analysis. Typical values for different pavement configurations:
Fatigue life ↓ (higher voids reduce effective cross-section)
Effective binder content ↑
Fatigue life ↑ (thicker binder films provide better durability)
Polymer modification
Improved fatigue resistance (up to 2-5× life extension)
Rest periods (healing)
Extended fatigue life (10-100× under favorable conditions)
Fatigue in PCC (Rigid) Pavements
Fatigue in Portland Cement Concrete (PCC) pavements differs fundamentally from fatigue in asphalt pavements due to the contrasting material properties of concrete and asphalt. Concrete is brittle, elastic, and does not heal — once damage occurs, it is permanent and irreversible. The fatigue design of concrete pavements is therefore based on limiting the applied stress to a fraction of the material’s strength.
Concrete Fatigue Mechanism
In rigid pavements, fatigue cracking typically initiates at the bottom of the concrete slab (directly beneath the wheel load) or at the edge of the slab (where thermal curling and moisture warping create tensile stresses at the surface). The repeated flexure of the slab under traffic loading generates tensile stresses that eventually exceed the concrete’s fatigue strength.
The fatigue process in concrete involves the progressive growth of micro-cracks at the aggregate-paste interface (the interfacial transition zone or ITZ). These micro-cracks grow and coalesce with continued loading, forming a macro-crack that propagates through the slab. Unlike asphalt, there is no healing mechanism to reverse this damage.
PCA Fatigue Model for Concrete Pavements
The Portland Cement Association (PCA) developed the most widely used fatigue model for concrete pavement design. The model relates the stress ratio (σ/MOR) to the allowable number of load repetitions. For stress ratio > 0.55: log N = 11.737 - 12.077(σ/MOR) . For 0.45 < stress ratio ≤ 0.55: N = (4.2577 / (σ/MOR - 0.4325))^3.268 . For stress ratio ≤ 0.45: N = infinite (fatigue limit) .
These equations were developed from extensive laboratory testing of concrete beams under repeated flexural loading and validated through field performance observations of in-service concrete pavements.
ICAO and FAA Concrete Fatigue Standards for Airports
The International Civil Aviation Organization (ICAO) and the Federal Aviation Administration (FAA) have specific fatigue-based design requirements for airport concrete pavements. ICAO Annex 14 and Aerodrome Design Manual (Doc 9157, Part 3) specify that concrete pavement strength must be reported using the ACR-PCR method (Aircraft Classification Rating / Pavement Classification Rating), which replaces the former ACN-PCN system.
The FAA uses the FAARFIELD (FAA Rigid and Flexible Iterative Elastic Layer Design) software for airport rigid pavement design. The concrete flexural strength (Modulus of Rupture) is a primary input, typically ranging from 4.5 to 6.5 MPa (650-950 psi) for airport pavements. The design process uses a standard working stress of 2.75 MPa for rigid pavement reporting under the ACR-PCR system.
The cumulative damage factor (CDF) concept is central to the FAA’s design methodology. The CDF accumulates the damage from each aircraft type and loading configuration, and the design is considered adequate when the sum of damage factors is less than 1.0 over the design life. The FAA defines four standard subgrade categories for airport pavement design:
Subgrade Code
Category
Elastic Modulus (MPa)
Modulus Range (MPa)
A
High strength
200
≥ 150
B
Medium strength
120
100 to < 150
C
Low strength
80
60 to < 100
D
Ultra-low strength
50
< 60
Healing and Rest Periods
Healing is a unique property of asphalt materials that distinguishes their fatigue behavior from that of concrete and other structural materials. Healing refers to the recovery of stiffness and strength during periods when the material is not under load (rest periods). This recovery occurs through the flow and diffusion of asphalt binder into micro-cracks, driven by surface energy forces and capillary action.
Mechanism of Healing
When an asphalt mixture is subjected to repeated loading, micro-cracks develop within the binder film and at the binder-aggregate interface. These micro-cracks are extremely small — typically less than 10-20 microns in width. When loading ceases, the asphalt binder flows into these cracks through two mechanisms: surface energy-driven wetting (the thermodynamic tendency of the binder to wet crack surfaces) and capillary flow (the pressure-driven movement of binder into narrow crack openings).
The healing process is temperature-dependent, with higher temperatures accelerating the rate of binder flow and molecular reorientation. The binder grade significantly affects healing potential — softer binders (e.g., PG 58-28) typically exhibit greater healing than harder binders (e.g., PG 76-22) due to their lower viscosity and greater molecular mobility. Polymer-modified binders have been shown to exhibit enhanced healing properties when the polymer network re-establishes across crack surfaces.
The Endurance Limit and Healing
The concept of the endurance limit in asphalt pavements — approximately 70 microstrain as proposed by Monismith (1970) — is directly related to healing. At very low strain levels, the damage accumulated during each loading cycle is small enough that it can be fully recovered during the subsequent rest period (either between vehicles or during nighttime traffic-free periods). Under these conditions, fatigue damage does not accumulate, and the pavement theoretically has infinite fatigue life.
This concept is the foundation of perpetual pavement design, where the asphalt layer thickness is selected to ensure that the tensile strain at the bottom of the layer remains below the endurance limit. Perpetual pavements are designed to require only periodic surface milling and replacement (every 15-25 years) while the structural asphalt layers remain in service indefinitely.
Laboratory vs. Field Healing
Condition
Laboratory Tests
Field Pavements
Loading pattern
Continuous, no rest periods
Intermittent with rest periods between vehicles, at night, and on weekends
Temperature
Constant at test temperature (typical 20°C)
Varies diurnally and seasonally; cooler at night
Healing potential
Negligible (no rest periods in standard tests)
Significant (healing occurs during daily and seasonal rest periods)
Time scale
Hours to days (continuous loading)
Months to years (intermittent loading with cumulative healing)
Implications for Shift Factors
The difference between laboratory fatigue testing (continuous loading, no rest periods, constant temperature) and field conditions (intermittent loading, rest periods, variable temperature with healing) is a primary reason for the laboratory-to-field shift factor of 10-20 used in fatigue analysis. Without this shift, laboratory fatigue tests would significantly underestimate field fatigue life because they do not account for healing.
The MEPDG accounts for healing through the shift factor embedded in the nationally calibrated fatigue coefficients. The MEPDG does not directly model healing as a time-dependent process but incorporates its effects through the empirical calibration between laboratory fatigue life and observed field performance.
Quantifying Healing
The healing ratio is defined as the percentage of stiffness recovery during a rest period: Healing (%) = (S_recovered - S_damaged) / (S_initial - S_damaged) × 100 where S = flexural stiffness modulus.
Research has shown that healing ratios of 20-80% are achievable depending on rest period duration, temperature, binder type, and damage level. Longer rest periods generally produce greater recovery, though with diminishing returns after approximately 24 hours. Rest periods of practical significance in pavements include inter-vehicle gaps (seconds to minutes), nighttime traffic-free periods (6-10 hours), and weekend traffic reductions (24-48 hours).
Fatigue Testing and Pavement Life Prediction
Fatigue testing provides the essential input data for pavement life prediction — the process of estimating the number of years or traffic applications a pavement can withstand before developing unacceptable levels of fatigue cracking.
The Life Prediction Process
Pavement life prediction using fatigue data follows a systematic process: determine the fatigue relationship (K₁ and K₂ constants) from beam fatigue testing (AASHTO T321) or damage characteristic curve from AMPT testing (AASHTO TP107); determine the expected traffic loading in ESALs (Equivalent Single Axle Loads) or axle load spectra over the design life; using layered elastic analysis (LEA) or finite element method (FEM), calculate the tensile strain at the critical location (bottom of the asphalt layer for bottom-up cracking, surface for top-down cracking) for each load level; apply Miner’s rule with the fatigue relationship to compute cumulative damage from all traffic loads; apply the transfer function to convert cumulative damage to expected cracking extent; and identify the year or traffic level at which the predicted cracking exceeds the allowable level (typically 20-25% of lane area for design).
Probabilistic Life Prediction
Fatigue life prediction is inherently probabilistic due to the variability in material properties (fatigue test results have coefficients of variation of 20-50%), traffic loading (magnitude, frequency, and lateral wander), environmental conditions (temperature and moisture throughout the year), and construction quality (in-place air voids, layer thickness, bond between layers).
The MEPDG addresses this variability through the reliability input parameter. A reliability of 50% means that 50% of pavements designed to the same criteria are expected to perform adequately — half will fail before the design life. Higher reliability levels (90-95%) require thicker pavements that provide a higher probability of satisfactory performance.
Inspection Implications
Fatigue testing data provides the scientific foundation for understanding and interpreting alligator cracking observed during pavement condition inspection. When a pavement inspector observes alligator cracking, the fatigue testing data explains why the cracking developed and how severe the underlying structural damage is.
Forensic Interpretation Using Fatigue Data
When alligator cracking is observed during a pavement condition survey (per ASTM D6433 — Standard Practice for Roads and Parking Lots Pavement Condition Index Surveys or ASTM D5340 — Standard Test Method for Airport Pavement Condition Index Surveys), the inspector should consider:
Crack pattern analysis — Advanced alligator cracking (high density of interconnected polygons) indicates that the fatigue damage has progressed well beyond the initiation phase into the propagation and failure phases. Isolated, widely-spaced cracks indicate earlier-stage damage. The Pavement Condition Index (PCI) method classifies alligator cracking by severity levels: Low (cracks < 3 mm wide, no spalling, pattern density < 20% of area), Medium (cracks 3-6 mm wide, slight spalling, pattern density 20-50% of area), and High (cracks > 6 mm wide, significant spalling, pattern density > 50% of area or pieces may be dislodged).
Wheel path correlation — Alligator cracking is typically concentrated in the wheel paths where the highest number of load applications occur. If cracking extends across the entire lane width or appears in non-wheel-path areas, causes other than traffic fatigue (such as subgrade failure or construction defects) should be investigated.
Structural thickness verification — If premature alligator cracking is observed, the actual pavement thickness should be verified through coring. A thinner-than-designed asphalt layer would produce higher tensile strains and reduced fatigue life, explaining the observed cracking.
Mixture property correlation — If the distress is widespread across similar pavement sections, the mixture may have inadequate fatigue resistance. Laboratory beam fatigue testing of field cores can confirm whether the in-place mixture meets the design fatigue requirements. Binder extraction and testing can determine if the PG grade is appropriate for the climate and traffic.
Condition Assessment Using Fatigue Knowledge
The inspector’s understanding of fatigue mechanics enables a more informed condition assessment:
Distress progression prediction — Knowledge of the relationship between fatigue strain level and cycles to failure allows the inspector to estimate the rate at which existing alligator cracking will progress. A pavement section with alligator cracking at Low severity on a high-traffic highway will likely deteriorate more rapidly than the same cracking on a low-volume road.
Treatment selection — Early-stage alligator cracking (Low severity, cracking without spalling) can be addressed with preventive maintenance treatments such as crack sealing or thin surface treatments. Moderate to High severity alligator cracking requires structural rehabilitation such as mill-and-overlay, structural overlay, or full-depth patching. Pavements with extensive high-severity alligator cracking (pieces loose or dislodged) require reconstruction.
Load restriction recommendations — When fatigue cracking is progressing rapidly, load restrictions may be necessary to extend the pavement’s remaining service life until rehabilitation can be performed. The fatigue relationship can be used to estimate the life extension achievable through load restrictions.
Remaining life estimation — The inspector can estimate remaining service life by relating the observed cracking extent to the predicted fatigue life from design analysis. For example, if the observed cracking extent is 10% at 12 years and the design predicted 10% cracking at 15 years, the remaining service life is approximately 3 years before reaching the terminal cracking level (typically 20-25%).
Practical Inspection Protocol
For field inspection of pavements with known fatigue testing data, the following protocol is recommended: document cracking extent and severity per ASTM D6433 or D5340; core at selected crack locations to verify crack depth and mode (bottom-up vs. top-down); extract and test field cores using AASHTO T321 (beam fatigue on sawed cores) if fatigue performance is in question; compare measured fatigue life to design fatigue life using the laboratory-to-field shift factor; and determine root cause using the comparison: if field cores show fatigue life significantly below design, the mixture or construction is deficient; if fatigue life meets design, the structural design (thickness) may be inadequate.
The integration of fatigue testing data with field inspection provides a powerful framework for understanding pavement performance, diagnosing causes of premature distress, and selecting appropriate rehabilitation strategies. For airport pavements, ICAO Annex 14 and FAA Advisory Circulars require that pavement condition be monitored through regular inspections and that fatigue cracking above specified thresholds triggers engineering evaluation and rehabilitation planning to maintain the safety of aircraft operations.
Frequently Asked Questions
In strain-controlled (controlled-displacement) fatigue testing, the specimen is deflected by a constant amount each cycle, and the load required to achieve that deflection decreases as the specimen accumulates damage. This mode is more representative of thin asphalt pavements where the response is dominated by the underlying layers. In stress-controlled (controlled-force) testing, a constant load is applied each cycle, and the deflection increases as damage accumulates. Stress-controlled testing is more representative of thick pavements. Most standard asphalt fatigue tests (AASHTO T321, TP107) use controlled-strain mode with haversine loading at 5-10 Hz.
The fatigue life of an asphalt pavement is highly variable and depends on mixture properties, layer thickness, traffic loading, temperature, and subgrade support. In the laboratory, beam fatigue tests at 400 microstrain typically yield fatigue lives ranging from 10,000 to 200,000 cycles depending on the mixture. In the field, properly designed asphalt pavements are expected to withstand 10-40 million Equivalent Single Axle Loads (ESALs) before developing significant fatigue cracking, assuming a well-designed mix and adequate structural thickness.
The endurance limit is the strain level below which an asphalt material theoretically has infinite fatigue life. For asphalt mixtures, the endurance limit is approximately 70 microstrain (Monismith, 1970). At strain levels below this threshold, any micro-damage accumulated during loading is fully recovered during rest periods through the healing properties of the asphalt binder. This concept is fundamental to perpetual pavement design, where the asphalt layer thickness is designed to keep tensile strains below the endurance limit.
Fatigue testing directly simulates the mechanism that causes alligator (fatigue) cracking in pavements. Alligator cracking initiates when repeated traffic loading generates tensile strains at the bottom of the asphalt layer that exceed the material's fatigue resistance. The interconnected crack pattern resembling alligator skin develops as multiple micro-cracks initiate, propagate upward through the layer, and coalesce. Fatigue testing quantifies the number of load applications a material can withstand before cracking, providing the data needed to predict when alligator cracking will appear.
The primary standards for asphalt fatigue testing are: AASHTO T321-17 (Determining the Fatigue Life of Compacted Asphalt Mixtures Subjected to Repeated Flexural Bending) — the 4-point bending beam fatigue test; AASHTO TP107-18 (Determining the Damage Characteristic Curve of Asphalt Mixtures from Direct Tension Cyclic Fatigue Tests) — the AMPT direct tension test; and TxDOT Tex-248-F (Overlay Test) — for reflective cracking evaluation. ASTM D7460-10 (withdrawn 2019) was an alternative beam fatigue method now superseded by AASHTO T321.
AASHTO T321 recommends a minimum of 3 replicate beams per mixture per test condition. For a complete fatigue characterization across multiple strain levels (typically 3-4 levels such as 200, 400, and 800 microstrain), a minimum of 10-12 beams is recommended. The coefficient of variation for beam fatigue testing typically ranges from 20-50%, so adequate replication is essential for reliable results. AASHTO TP107 (AMPT direct tension) requires testing at a minimum of three different strain levels with at least two replicates per level.
Concrete fatigue and asphalt fatigue differ fundamentally in material behavior and test methodology. Concrete is a brittle, elastic material that exhibits minimal healing, so its fatigue behavior is characterized by stress ratio (applied stress divided by modulus of rupture, MOR). The concrete fatigue limit is approximately 50-55% of MOR at 2 million cycles. Asphalt is a viscoelastic, temperature-sensitive material that exhibits significant healing during rest periods. Asphalt fatigue is characterized by tensile strain level, and the endurance limit is approximately 70 microstrain. Concrete fatigue testing uses flexural beams per ASTM C78 while asphalt uses beam bending per AASHTO T321.
Key factors affecting field fatigue life include: asphalt layer thickness (thicker layers reduce tensile strain at the bottom of the layer), mixture properties (binder content, air voids, VMA, aggregate gradation, binder grade), traffic loading magnitude and frequency (heavier loads and more passes increase damage), temperature (intermediate temperatures around 20 degrees Celsius are most critical for fatigue), subgrade support (weaker subgrade increases tensile strains), construction quality (compaction, bonding between layers), environmental conditions (aging, moisture), and rest periods (traffic gaps and cooler nighttime temperatures allow healing).
Need Expert Pavement Condition Assessment?
Our team provides professional pavement inspection and fatigue testing evaluation services for airport and highway pavements, including alligator cracking assessment, pavement life prediction, and mechanistic-empirical design support.
Alligator cracking — also called fatigue cracking — is an interconnected crack pattern resembling alligator skin that indicates structural failure of the asphal...
Resilient Modulus (Mr) is the dynamic elastic modulus of subgrade soil or unbound pavement materials under repeated (cyclic) loading, measuring recoverable stra...