Photogrammetry
Photogrammetry is the science of deriving reliable 3D measurements and geometric information from overlapping 2D photographs. In infrastructure inspection, dron...
24 min read
Surveying
Mapping
+6
Image overlap (forward overlap and side overlap) is the percentage of image area shared between consecutive and adjacent photos in a photogrammetric survey. Typical requirements are 75-80% forward overlap and 60-70% side overlap for infrastructure mapping and inspection.
Image overlap is the percentage of the total image area shared between two or more successive aerial photographs. It is the single most critical acquisition parameter in photogrammetry, directly determining whether automated 3D reconstruction succeeds or fails. Without adequate overlap, Structure from Motion (SfM) algorithms cannot find reliable tie points between images, camera positions cannot be triangulated, and the resulting point cloud or orthomosaic contains gaps, distortions, and measurement errors.
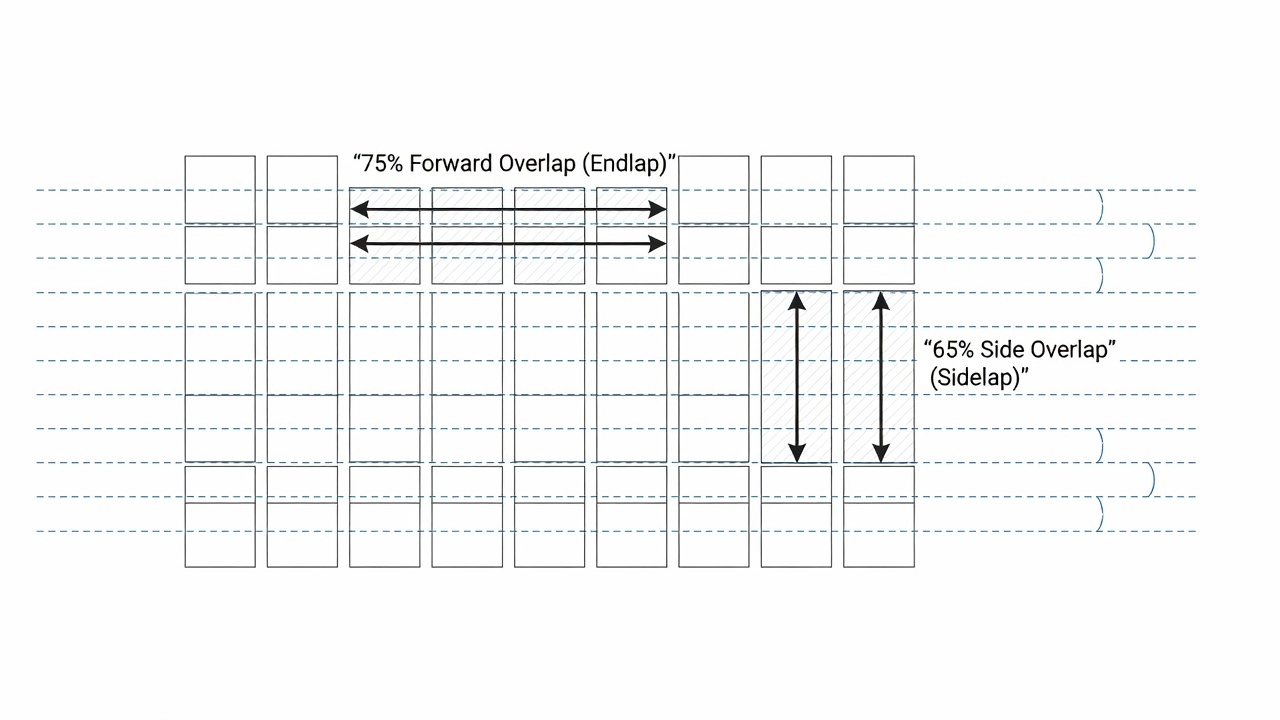
Overlap is expressed as two independent parameters: forward overlap (also called endlap or along-track overlap), which is the overlap between consecutive images along the direction of flight, and side overlap (also called sidelap, lateral overlap, or cross-track overlap), which is the overlap between images in adjacent flight lines flown side by side. Both parameters must be independently configured in mission planning software and are influenced by flight altitude, camera sensor geometry, ground speed, and the camera trigger interval.
The mathematical principle underlying image overlap is the photogrammetric requirement that every point on the ground must be visible in at least two, and ideally three or more, images from different camera positions. This multi-view geometry enables epipolar line triangulation — the core of automated photogrammetry — where the 3D coordinates of any point are computed by finding its corresponding pixel location in multiple overlapping images and solving the intersection of the ray lines from each camera position through that pixel.
Forward overlap is the percentage of the image area that is shared between two consecutive photographs captured sequentially along a single flight line. It is expressed as a percentage of the along-track image dimension (the dimension of the image footprint in the direction of flight). If consecutive images share 80% of their along-track area, the forward overlap is 80%.
The forward overlap determines how many times a given ground point along the flight path will be imaged. At 80% forward overlap, each ground point appears in every image whose position covers that point — typically 5 to 7 images for a single flight line. This multiplicity is essential for reliable tie point matching: the SfM pipeline needs at least three observations of each tie point to accurately solve for camera position and orientation, and additional observations improve the redundancy that drives accuracy.
Forward overlap is also referred to as endlap in traditional aerial photogrammetry literature. The term “endlap” originates from the era of analog aerial film cameras mounted on manned aircraft, where the film strip from a single flight run was physically overlapped end-to-end for stereoscopic viewing. The term persists in modern digital photogrammetry, though “forward overlap” and “along-track overlap” are more descriptive for drone operations.
The calculation of forward overlap depends on three parameters: the ground footprint dimension of the image in the flight direction, the flight speed over ground, and the camera trigger interval. For any given image footprint (determined by flight altitude and camera field of view), the desired forward overlap determines the maximum allowable distance between consecutive camera positions:
D_max = L × (1 — O_f / 100)
Where D_max is the maximum distance between consecutive exposure stations, L is the image footprint length along the flight direction, and O_f is the desired forward overlap percentage. For a image footprint of 100 m along-track and a desired forward overlap of 80%, the camera must trigger every 20 m of forward movement.
Side overlap is the percentage of the image area shared between images in adjacent flight lines. It is expressed as a percentage of the cross-track image dimension (the dimension of the image footprint perpendicular to the flight direction). If the images from two adjacent flight lines share 65% of their lateral area, the side overlap is 65%.
Side overlap is also called sidelap, lateral overlap, or cross-track overlap. In traditional photogrammetry, sidelap was the overlap between adjacent film strips in a mapping block. In drone operations, side overlap is the overlap between two parallel flight lines in a grid mission.
The side overlap determines whether there are gaps in coverage between adjacent flight lines. At 60% side overlap, the edges of the effective coverage from one flight line overlap with those of the next by 60% of the cross-track image dimension, ensuring continuous coverage across the full width of the survey area. Below 30% side overlap, the coverage between flight lines becomes discontinuous, creating actual gaps in the imagery where no data exists.
The spacing between flight lines is calculated from the side overlap requirement:
S = W × (1 — O_s / 100)
Where S is the spacing between adjacent flight lines, W is the image footprint width across the flight direction, and O_s is the desired side overlap percentage. For an image footprint of 150 m cross-track and a desired side overlap of 65%, the flight lines must be spaced 52.5 m apart.
| Parameter | Forward Overlap (Endlap) | Side Overlap (Sidelap) |
|---|---|---|
| Direction | Along flight path | Between adjacent flight lines |
| Typical value | 75-85% | 60-75% |
| Minimum for reliability | 70% | 30% |
| Impact on flight time | Higher overlap = more images per flight line | Higher overlap = more flight lines |
| Primary effect | Ensures coverage along each flight strip | Ensures coverage across survey width |
| Key variables | Flight speed, trigger interval, altitude | Flight line spacing, altitude, sensor width |
Structure from Motion (SfM) is the computational engine that drives modern digital photogrammetry. SfM algorithms process overlapping 2D images to simultaneously reconstruct camera positions, camera orientations, and the 3D geometry of the scene. Image overlap is the fundamental precondition without which SfM cannot function.
The SfM pipeline begins with feature detection — algorithms like SIFT (Scale-Invariant Feature Transform), SURF (Speeded-Up Robust Features), or AKAZE identify distinctive points in each image, such as corners, edges, and texture patches. These features must be robust, meaning they can be reliably detected regardless of illumination changes, scale differences, and small perspective shifts between images. The density and detectability of these features depend on surface texture — grass, gravel, and pavement markings produce abundant features, while uniform asphalt, snow cover, and water surfaces produce very few.
The next stage is feature matching, where the software finds corresponding features across image pairs. This is where overlap is critical: if two images do not overlap, they share no ground area, so no features can be matched between them. Even when images do overlap, the matching success rate depends on the percentage of overlap. Research shows that matching success rates decline precipitously below 60% forward overlap. At 80% overlap, typical matching rates between adjacent images are 1000-5000 tie points per image pair. At 50% overlap, this drops to 100-500 tie points, and below 40%, reliable matching often fails entirely.
The third stage is camera pose estimation via bundle adjustment. The software solves for the position (X, Y, Z) and orientation (roll, pitch, yaw) of each camera at the moment of exposure, along with the 3D coordinates of every matched tie point. This is a nonlinear least-squares optimization problem, and the quality of the solution depends critically on two factors: the number of images in which each tie point appears, and the geometric configuration of those images.
The rule of thumb in photogrammetry is that each ground point should appear in at least three images for reliable reconstruction. With 80% forward overlap and 65% side overlap, every point in the central portion of a grid survey appears in 6-12 images, providing strong geometric constraints. Dropping to 60% forward overlap and 40% side overlap reduces this to 3-5 images per point, with points near the survey boundaries appearing in only 2-3 images — the minimum threshold for reliability.
Multi-View Stereo (MVS) — the dense matching stage that follows SfM — is even more sensitive to overlap. Where SfM only needs to match sparse features, MVS attempts to produce a depth estimate for every pixel, creating a dense point cloud of millions of points. MVS algorithms evaluate the photometric consistency of small image patches across multiple views, and the quality of these depth estimates improves with the number of overlapping views. Areas imaged by only 2-3 cameras show noisy, incomplete depth maps, while areas imaged by 5+ cameras produce clean, complete reconstructions.
The standard overlap requirements for drone photogrammetry have been established through decades of photogrammetric practice, validated by extensive academic research. The values below represent general-purpose recommendations that apply to most survey scenarios.
For orthomosaic generation — producing a seamless, geometrically corrected aerial map — the minimum forward overlap is 60% and the minimum side overlap is 30%. These are the absolute lower bounds below which the photogrammetry software cannot produce a continuous orthomosaic without visible seams or gaps. However, most practitioners recommend 75-85% forward overlap and 60-70% side overlap for professional-grade orthomosaics. The higher values provide the redundancy needed for accurate orthorectification, which corrects each pixel’s position based on terrain elevation and camera perspective.
For 3D point cloud generation — producing a detailed, measurable 3D model of the surface — the requirements are more stringent. Forward overlap of 75-85% and side overlap of 60-75% are standard. The extra overlap ensures that every ground point is imaged from at least 5-8 different camera positions, providing the geometric diversity needed for accurate depth estimation in the dense matching stage.
For high-accuracy surveying — where measurement accuracies of 1-3 cm (0.5-1 inch) are required — forward overlap of 80-85% and side overlap of 70-80% are recommended. At these overlap levels, the photogrammetric network has sufficient redundancy to compensate for GPS positioning errors, wind-induced camera tilt, and other sources of uncertainty. Academic research published in Remote Sensing consistently shows that increasing overlap from 70% to 80% improves vertical accuracy by 25-40%, while increasing beyond 85% shows diminishing returns.
For infrastructure inspection — bridge decks, pavement surfaces, runway condition assessment — forward overlap of 80-85% and side overlap of 70-80% are standard. The higher overlap ensures that small surface defects (cracks, spalls, joint failures) are visible in multiple images from multiple angles, improving detection rates and measurement precision.
| Application | Forward Overlap | Side Overlap | Rationale |
|---|---|---|---|
| Orthomosaic | 75-80% | 60-65% | Seamless map production |
| 3D Model (standard) | 75-80% | 60-70% | Complete surface reconstruction |
| High-accuracy survey | 80-85% | 70-80% | Sub-centimeter accuracy |
| Pavement inspection | 80-85% | 70-75% | Crack detection at 0.3 mm |
| Bridge deck inspection | 80-85% | 70-80% | Structural defect identification |
| Urban mapping | 85-90% | 70-80% | Building reconstruction |
| Agriculture/NDVI | 70-75% | 55-65% | Efficient field coverage |
| Large-area mapping | 70-75% | 55-60% | Balance coverage and flight time |
Operating below the recommended overlap thresholds produces a cascade of negative effects that degrade or destroy the photogrammetric output.
Reconstruction gaps — the most obvious symptom of insufficient overlap. When two adjacent images do not share enough ground area, the SfM algorithm cannot find tie points between them, and the reconstruction of that area fails entirely. In the final point cloud or orthomosaic, these gaps appear as holes or missing data. In severe cases, the entire block of images fails to align into a single coherent model, fragmenting into disconnected clusters.
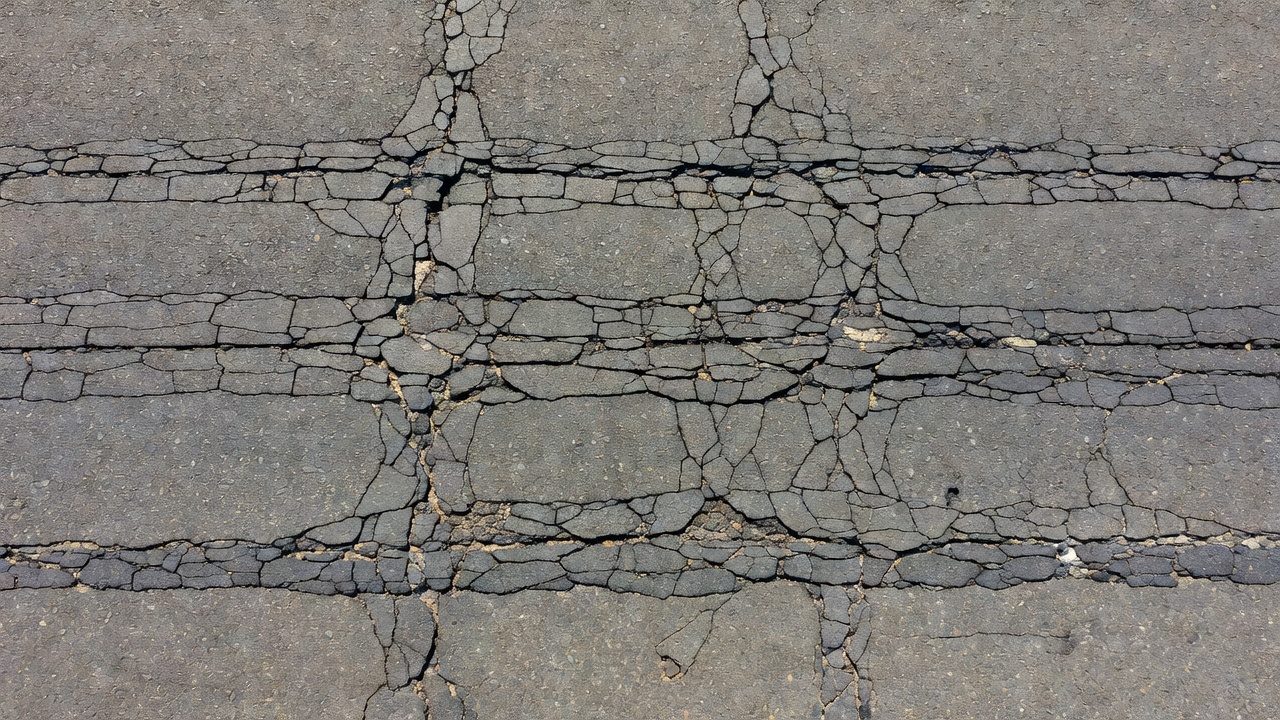
Failed tie point matching — occurs when the overlapping area between two images is too small to contain sufficient distinctive features. On uniform surfaces like asphalt or concrete, even 60% overlap may not yield enough matching points because the surface lacks texture. On such surfaces, 80% or higher overlap may be necessary to find enough features for reliable matching.
Reduced positional accuracy — even when reconstruction succeeds at marginal overlap levels, the accuracy of the result is compromised. Every measurement from the point cloud or orthomosaic carries greater uncertainty. Academic research demonstrates that dropping forward overlap from 80% to 60% increases point cloud noise by approximately 50% and reduces horizontal accuracy by 25-40%.
Poor edge quality — insufficient overlap at the boundaries of the survey area produces orthomosaic edges with visible distortion, seam lines, and misalignment. The outermost images lack the full set of neighboring views that provide geometric constraints, making them more susceptible to positioning errors.
Increased reprojection error — in the bundle adjustment solution, reprojection error (the average distance between a tie point’s projected location in an image and its observed location) increases. Higher reprojection error indicates a poorer solution with less internal consistency. While some reprojection error is unavoidable, values significantly above 0.5 pixels indicate a weak geometric solution.
Failed depth estimation — the Multi-View Stereo stage requires at least 3 overlapping views (and preferably 5+) for every pixel to produce a reliable depth estimate. With insufficient overlap, large areas of the image will have depth estimates that are noisy, incomplete, or entirely missing, producing holes in the dense point cloud.
While more overlap is generally better than less, excessive overlap carries significant costs that must be balanced against the marginal accuracy gains.
Increased flight time — higher overlap means more images per unit area, which requires more flight lines, more camera triggers, and longer total mission duration. Increasing forward overlap from 75% to 90% approximately doubles the number of images per flight line. For a mission that would take 20 minutes at 75% overlap, 90% overlap would take approximately 35-40 minutes, potentially requiring an additional battery.
Increased storage requirements — more images consume more storage on the drone’s memory card and on the processing computer. A survey that produces 500 images at 75% overlap may produce 1500 images at 90% overlap. At 20 MB per image (typical for a 20 MP sensor), this is the difference between 10 GB and 30 GB of storage.
Exponential processing time increase — the computational cost of photogrammetric processing does not scale linearly with image count. The SfM matching stage compares every image against every other image that might overlap with it. At 75% overlap with 500 images organized in a regular grid, each image overlaps with approximately 12-16 neighbors, producing roughly 5000 image pairs to match. At 90% overlap, each image overlaps with 30-40 neighbors, producing 15,000-20,000 image pairs. Processing time increases proportionally to the number of image pairs, making 90%-overlap surveys 3-5x slower to process than 75%-overlap surveys.
Data without benefit — beyond approximately 85% forward overlap and 75% side overlap, additional overlap provides negligible improvements to reconstruction quality. The SfM solution is already well-constrained by the existing image geometry, and adding redundant views introduces no new geometric information. The extra images simply duplicate existing observations, adding computational burden without meaningful accuracy gains.
| Overlap Level | Images per unit area | Relative processing time | Accuracy gain vs 75/65 baseline |
|---|---|---|---|
| 75%/65% | 1x (baseline) | 1x (baseline) | — |
| 80%/70% | 1.3x | 1.5x | +15-20% |
| 85%/75% | 2x | 3x | +25-35% |
| 90%/80% | 3.5x | 5x | +30-40% |
| 95%/85% | 8x | 15x | +32-42% |
The data clearly shows diminishing returns: the accuracy gain from 85% to 95% overlap is less than 10%, while the computational cost increases by 5x. The practical optimum for most applications lies at 75-85% forward and 60-75% side overlap.
Pavement inspection with drones requires specialized overlap considerations because of the unique characteristics of pavement surfaces: large uniform areas with low texture, high reflectivity, and the need to detect small surface defects.
The low-texture challenge. Asphalt and concrete pavement surfaces have limited visual texture — they lack the grass, gravel, soil, and vegetation that provide abundant tie points in natural terrain surveys. The SfM algorithm has fewer features to match between overlapping images, making reliable alignment more difficult. Higher overlap compensates for this by providing more potential matching area, increasing the probability that the reduced feature set will still find sufficient correspondences.
Recommended overlap for pavement. For pavement inspection, forward overlap of 80-85% and side overlap of 70-75% is standard. This higher baseline ensures reliable reconstruction even on the most uniform pavement surfaces. Some agencies specify 85% forward overlap for runway inspections to ensure every square meter of pavement surface appears in at least 7-9 images.
Crack detection requirements. The minimum detectable crack width in an orthomosaic is approximately 2-3 times the Ground Sample Distance (GSD). At 1 cm GSD (typical for pavement inspection at 60-80 m altitude), cracks as narrow as 2-3 mm can be resolved. However, accurate crack width measurement requires that the crack be visible in multiple overlapping images to average out pixel-level noise and perspective effects. Higher overlap provides more measurement redundancy and improves crack width measurement precision.
Pavement Condition Index (PCI) surveys. The ASTM D5340 standard for Pavement Condition Index evaluation requires inspectors to identify and quantify surface distress types including cracking, rutting, raveling, patching, and potholes. Drone-based PCI surveys using high-overlap imagery can achieve 90-95% agreement with ground-based surveys on distress identification, with substantially faster data collection and complete photographic documentation.
FOD detection on runways. Foreign Object Debris (FOD) detection on airport runways requires GSD of 5 mm or finer and very high overlap to ensure complete coverage. Forward overlap of 85-90% and side overlap of 75-80% is typical for FOD surveys. At these parameters, a standard runway survey requires several hundred images per kilometer of runway length. The high overlap ensures that even small debris items (nuts, bolts, tire fragments) are captured in multiple images, reducing the probability of missed detections.
Bridge inspection with drones presents unique overlap challenges because of the complex 3D geometry of bridge structures. A typical bridge includes a deck surface, girders, bearings, abutments, piers, and approach slabs — each requiring different overlap strategies.
Deck surface. The bridge deck — the pavement surface of the bridge — is surveyed using standard nadir imagery with 80-85% forward overlap and 70-80% side overlap. The deck is typically the easiest part of the bridge to image, as the drone can fly directly above it in a grid pattern. The higher overlap compared to standard mapping is necessary because bridge decks often have metal surfaces, expansion joints, and other low-texture features that reduce the number of available tie points.
Girder and underside. The girders and underside of the bridge deck require oblique or horizontal camera angles, typically flown in orbital patterns beneath or alongside the bridge. For these capture angles, forward overlap of 70-80% is recommended, recognizing that the geometry of orbital flights makes consistent overlap more difficult to achieve. The complex beam and girder geometry creates occlusions and parallax shifts that complicate feature matching, so the additional overlap helps ensure reliable reconstruction.
Bearings and piers. Bridge bearings — the mechanical assemblies that transfer loads between the superstructure and substructure — require close-range inspection with very high overlap. For bearing inspection, images are captured at close range (3-10 m) with 80-90% forward overlap to ensure every bearing surface is captured from multiple angles. Bearing defects (corrosion, cracking, displacement) are often small and require detailed multi-perspective documentation.
FHWA research findings. Research published by the Federal Highway Administration (FHWA) and in journals like Remote Sensing has systematically evaluated overlap requirements for bridge inspection photogrammetry. A 2022 study found that 80% forward overlap with 70% side overlap produced complete 3D bridge models with point cloud densities sufficient to detect cracks of 0.3 mm width on concrete surfaces. Reducing overlap to 60% forward / 40% side resulted in 30% of the bridge model having reconstruction gaps, particularly in shadowed areas under the deck.
| Bridge Element | Camera Angle | Forward Overlap | Side/Lateral Overlap | Notes |
|---|---|---|---|---|
| Deck surface | Nadir | 80-85% | 70-80% | Grid flight pattern |
| Girders | Oblique (30-45°) | 75-80% | 65-75% | Orbital or linear pass |
| Bearings | Horizontal-oblique | 80-90% | 70-80% | Close-range orbits |
| Abutments | Oblique (45-60°) | 70-80% | 60-70% | Vertical surfaces |
| Piers | Oblique (45-60°) | 70-80% | 60-70% | Multi-directional passes |
Achieving the correct image overlap in practice requires careful flight planning that accounts for the specific geometry of the survey area and the capabilities of the drone and camera.
Flight planning workflow. The standard workflow begins by defining the survey area boundary, then selecting the desired GSD and overlap percentages in mission planning software. The software calculates the required flight altitude, flight line spacing, and camera trigger interval, then generates a flight path. Modern planning tools like DroneDeploy, Pix4Dcapture, DJI Pilot 2, and UGCS automate this calculation, but the operator must understand the underlying parameters to verify that the plan is correct.
Altitude selection. The flight altitude determines both the GSD and the image footprint. Higher altitude produces larger ground footprints, meaning fewer images are needed to cover the survey area. However, higher altitude also means coarser GSD. The relationship between altitude, GSD, and overlap is:
**L_along = (Alt × Sensor_height) / Focal_length **
L_cross = (Alt × Sensor_width) / Focal_length
Where L_along and L_cross are the along-track and cross-track ground footprint dimensions respectively, Alt is the flight altitude above ground level, Sensor_height and Sensor_width are the physical dimensions of the camera sensor, and Focal_length is the lens focal length.
Camera trigger interval. The time between consecutive camera exposures determines the forward overlap. The trigger interval is calculated as:
Trigger_interval (s) = (L_along × (1 — O_f / 100)) / Flight_speed
For a drone flying at 10 m/s with an along-track image footprint of 120 m and a desired forward overlap of 80%, the camera must trigger every 2.4 seconds. Mission planning software typically handles this calculation automatically, but manual verification is advised for critical surveys.
Flight line spacing. The distance between adjacent flight lines determines the side overlap:
Line_spacing = L_cross × (1 — O_s / 100)
For a cross-track image footprint of 160 m and a desired side overlap of 65%, the flight lines should be spaced 56 m apart.
Speed considerations. Higher flight speeds require faster trigger intervals to maintain the same forward overlap. At 15 m/s, the trigger interval for 80% forward overlap with a 120 m footprint is just 1.6 seconds. Not all cameras can sustain such rapid capture rates, particularly when writing to a memory card. The camera’s maximum frame rate (typically 0.5-2 fps for professional mapping cameras) imposes a hard limit on the achievable overlap at a given speed. When higher overlap is required, the drone must fly slower.
Wind effects. Wind can cause the drone’s actual ground speed to differ from the planned speed. A headwind reduces ground speed, effectively increasing forward overlap. A tailwind increases ground speed, reducing forward overlap. For surveys at extreme overlap tolerances, the mission planning software should be configured to use ground-speed-based triggering rather than time-based triggering, ensuring consistent overlap regardless of wind conditions.
Battery management. Higher overlap generates more images and longer flight times. A typical survey at 80/65 overlap requires approximately 20-25 minutes per 50 hectares at 100 m altitude. Increasing to 85/75 overlap extends this to 35-40 minutes. For large areas, the mission must be segmented into multiple flights that are later merged in processing software.
Flight planning software calculates overlap based on the planned altitude above ground level (AGL). However, real-world terrain is rarely flat, and the actual overlap at ground level can differ significantly from the planned values.
The terrain elevation problem. When the drone flies at a planned AGL over terrain with significant elevation variation, the actual ground distance to the surface varies. Over hilltops, the drone is closer than planned, reducing the actual image footprint and increasing GSD. In valleys, the drone is farther than planned, increasing the image footprint and coarsening GSD. The overlap percentage changes correspondingly — overlap increases over hilltops (where the image footprint shrinks) and decreases in valleys (where the footprint expands).
Terrain-following flight. Terrain-following flight modes use a pre-loaded Digital Elevation Model (DEM) or real-time altitude sensing to maintain constant AGL over variable terrain. This preserves the planned overlap and GSD across the survey area. Terrain-following is essential for surveys in hilly or mountainous terrain. Without it, overlap can vary by 10-20 percentage points between hilltops and valleys, leading to coverage gaps in low areas.
Urban terrain. Buildings and other structures create dramatic local relief that affects overlap. A building that rises 30 m above the surrounding terrain reduces the effective camera-to-roof distance by 30 m, which can reduce the actual forward overlap at roof level by 15-20 percentage points compared to the planned value. For urban surveys, overlap should be increased to compensate — starting at 80-85% forward overlap to ensure adequate coverage at roof level.
Forest and canopy effects. Dense tree canopies create an effective surface that is higher and more irregular than the ground elevation. Overlap calculations based on the ground elevation will underestimate the actual overlap at canopy level. For forestry surveys, mission planning should use the expected canopy height rather than ground elevation for the AGL reference.
Occlusion shadows. Tall objects create occlusion shadows — areas that are not visible in the imagery because they are hidden behind the object. Occlusion shadows are largest in nadir imagery, where the hidden area extends away from the object. Higher overlap helps mitigate occlusion shadows by ensuring that occluded areas are visible from different camera positions along the flight line.
After capturing the imagery, the overlap should be verified before leaving the survey site to ensure the data is suitable for processing. Post-flight verification catches problems early, before the flight crew has left the area and the cost of re-flying becomes prohibitive.
On-site verification methods. The most accessible method is to review the image footprints on the mission planning app immediately after the flight. Most apps display the approximate ground coverage of each image as a rectangle overlaid on a map. Gaps between rectangles indicate coverage gaps. Adjacent rectangles with very narrow overlap zones indicate marginal overlap that may cause processing problems. Many apps also report the minimum, average, and maximum overlap achieved during the mission.
Camera position density check. A quick count of image positions relative to the survey area gives a rough overlap check. A 10-hectare area at 100 m altitude with 80/65 overlap should produce approximately 100-150 images. If the count is significantly lower, overlap may be insufficient. Mission planning apps typically provide expected image counts during planning, and the actual count should match closely.
Photogrammetry quality reports. After processing begins, photogrammetry software generates quality reports that reveal overlap problems. Key indicators include:
Re-flight planning. If verification reveals insufficient overlap, the survey must be re-flown. The simplest correction is to increase both overlap parameters by 5-10 percentage points. For sites where terrain or structures caused the problem, terrain-following flight or higher base altitude may be needed. For low-texture surfaces, adding ground control targets or artificial texture markers can improve feature matching.
Safe margins. The recommended approach is to plan with safety margins: set overlap 5% higher than the theoretical minimum for the application. This accounts for wind effects, GPS drift, terrain variation, and the inevitable minor deviations from the ideal flight path that occur in real-world operations.
Image overlap — comprising forward overlap (endlap / along-track overlap) and side overlap (sidelap / lateral / cross-track overlap) — is the fundamental acquisition parameter that determines whether a photogrammetric survey succeeds or fails. Forward overlap of 75-85% ensures that every ground point on each flight line appears in multiple sequential images. Side overlap of 60-75% ensures continuous coverage across adjacent flight lines without gaps. Together, these parameters create the geometric redundancy that Structure from Motion algorithms require for reliable feature matching, camera position triangulation, and dense 3D reconstruction.
Insufficient overlap produces reconstruction gaps, failed alignment, reduced accuracy, and missing data areas — problems that cannot be fixed in post-processing. Excessive overlap increases flight time, storage, and processing time by 3-5x without proportional accuracy gains. The practical optimum for most applications lies at 75-85% forward and 60-75% side overlap, with higher values reserved for low-texture surfaces, complex structures like bridges, and sub-centimeter accuracy requirements.
Pavement and runway inspection benefits from higher overlap (80-85% forward, 70-75% side) because uniform asphalt surfaces provide fewer natural tie points. Bridge inspection requires specialized overlap strategies for different structural elements: 80-85% forward for deck surfaces, 75-80% for girders, and 80-90% for close-range bearing inspection. Post-flight verification of image footprints and overlap quality reports ensures that problems are identified before the survey crew leaves the site, preventing costly remobilization.
TarmacView provides expert drone photogrammetry services with optimized image overlap for pavement, infrastructure, and aviation asset inspection. Contact us for a custom survey proposal.
Photogrammetry is the science of deriving reliable 3D measurements and geometric information from overlapping 2D photographs. In infrastructure inspection, dron...
A comprehensive glossary for topography, surface features, and elevation surveying, covering major concepts, tools, and technical standards from ICAO, USGS, and...
Drone flight planning for infrastructure inspection involves designing automated flight paths (waypoint missions) with appropriate altitude, speed, overlap, gim...