Non-Destructive Testing (NDT)
Non-Destructive Testing (NDT) encompasses methods to evaluate material properties, detect defects, and assess structural condition without causing damage. For i...
27 min read
Infrastructure Inspection
NDT
+4
Impact-Echo is a stress-wave nondestructive testing method where a short-duration mechanical impact on a concrete surface generates stress waves that reflect from internal flaws, delaminations, or external boundaries. Frequency analysis of the surface displacement response reveals defect depth, slab thickness, and void presence per ASTM C1383.
Impact-Echo (IE) is a stress-wave-based nondestructive testing (NDT) method developed specifically for flaw detection in concrete structures. The method was conceived in 1983 at the National Bureau of Standards (NBS, now NIST) by Mary Sansalone and Nicholas J. Carino, driven by the need for a reliable NDT technique that could overcome the fundamental challenges posed by concrete’s heterogeneous nature — challenges that had limited the effectiveness of conventional ultrasonic pulse-echo methods adapted from metal inspection. The method was formally adopted as an ASTM standard in 1998 (ASTM C1383) and has since become one of the most widely used NDT techniques for concrete infrastructure worldwide.

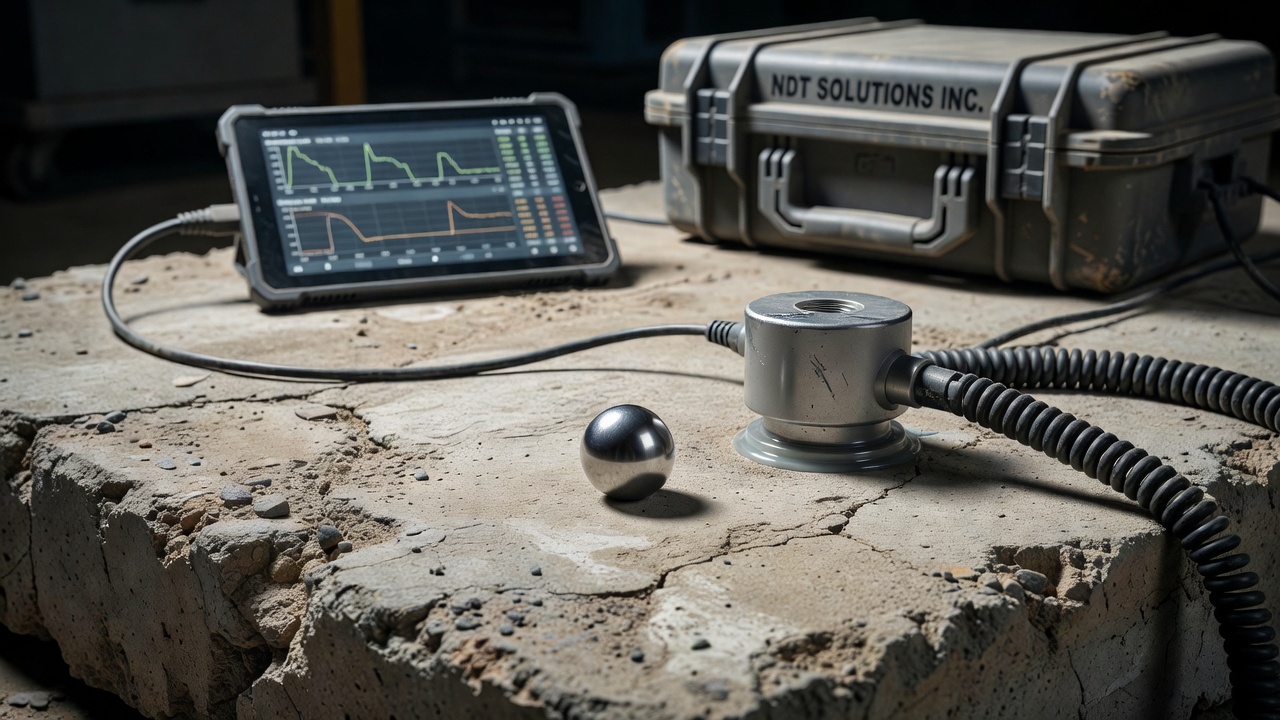
The fundamental operating principle of impact-echo begins with a short-duration mechanical impact applied to the concrete surface. This impact is typically delivered by a hardened steel sphere (diameter 3 to 20 mm) on a spring-loaded plunger, an instrumented hammer, or an electromagnetic solenoid-driven impactor. The impact produces a force-time history that approximates a half-cycle sine curve. The duration of this impact — called the contact time — is the single most important experimental parameter in impact-echo testing. Contact times typically range from 20 to 150 microseconds, depending on the sphere diameter and the hardness of the concrete surface.
When the impactor strikes the concrete surface, the disturbance propagates into the solid as three distinct types of stress waves. The P-wave (primary or compressional wave) travels fastest and is associated with normal stress — particles vibrate parallel to the direction of wave propagation. The S-wave (secondary or shear wave) travels at approximately 61% of the P-wave speed for Poisson’s ratio of 0.2 (typical for concrete) and is associated with shear stress — particles vibrate perpendicular to the direction of propagation. The R-wave (Rayleigh or surface wave) travels along the near-surface region at approximately 56% of the P-wave speed and involves elliptical particle motion. According to research by Graff (1975), the R-wave carries approximately 67% of the total impact energy, the S-wave carries 36%, and the P-wave carries only 7%. Despite its relatively low energy content, the P-wave is the principal wave type used in impact-echo testing because it is the first arrival at any interior point and its reflections provide the clearest information about internal boundaries.
The P-wave speed in concrete (Cp) is a material property related to Young’s modulus (E), Poisson’s ratio (ν), and density (ρ) by the equation:
Cp = √[E(1-ν) / (ρ(1+ν)(1-2ν))]
For typical structural concrete, Cp ranges from 3,500 to 4,500 m/s. The P-wave speed is directly proportional to concrete quality — higher velocities correlate with denser, higher-strength, better-quality concrete, while lower velocities indicate deterioration, cracking, or poor consolidation.
When a stress wave traveling through concrete encounters an interface with a different material, a portion of the wave energy is reflected back into the concrete. The amplitude and phase of the reflected wave are governed by the reflection coefficient (R), which for normal incidence is given by:
R = (Z₂ - Z₁) / (Z₂ + Z₁)
where Z₁ and Z₂ are the specific acoustic impedances of the two materials (Z = density × wave speed). The critical insight for impact-echo flaw detection is the magnitude of the reflection coefficient at a concrete-air interface. The acoustic impedance of concrete is approximately 7 to 10 × 10⁶ kg/(m²·s), while that of air is approximately 412 kg/(m²·s). Substituting these values yields a reflection coefficient of approximately -0.9999 — effectively total reflection. This means that when a P-wave traveling through concrete encounters an air-filled void, crack, or delamination, the wave is almost completely reflected at that interface. The negative sign indicates that the reflected wave experiences a phase reversal — a compressive incident P-wave reflects as a tensile P-wave.
By contrast, at a concrete-steel interface (Z_steel ≈ 47 × 10⁶ kg/(m²·s)), the reflection coefficient is approximately +0.65 to +0.75 — positive and less than 1. This means partial reflection occurs without phase reversal. This difference in reflection characteristics allows impact-echo to distinguish between air-filled defects (voids, cracks, delamination) and steel reinforcement, as demonstrated by Sansalone and Carino (1990).
The multiple reflections of the P-wave between the top surface (concrete-air interface, R ≈ -1) and a parallel reflecting interface (bottom of the slab, or a delamination) create a resonance condition. Each time the P-wave arrives at the top surface, it produces a characteristic displacement that is detected by the receiving transducer. The time interval (Δt) between successive P-wave arrivals is:
Δt = 2T / Cp
where T is the distance between the top surface and the reflecting interface, and Cp is the P-wave speed. The frequency (f) of P-wave arrival is the inverse of this time interval:
f = 1/Δt = Cp / (2T)
Rearranging gives the fundamental impact-echo equation:
T = Cp / (2f) or equivalently d = Cp / (2f)
where d is the depth of the reflecting interface (for a flaw) or T is the thickness of the plate (for sound concrete).
However, subsequent rigorous analysis by Gibson and Popovics (1990) showed that the wave speed governing thickness-mode vibration in plates is not exactly the bulk P-wave speed but rather the plate wave speed (Cplate) for the symmetric S1 Lamb wave mode. This speed is approximately 96% of the bulk P-wave speed for concrete with typical Poisson’s ratios of 0.18 to 0.22. This correction is incorporated into ASTM C1383 through the shape factor (β = 0.96) :
T = β × Cp / (2f) = 0.96 × Cp / (2f)
For prismatic members (beams, columns with square or circular cross-sections), the multiple reflections from side boundaries create additional cross-sectional modes of vibration, and different shape factors must be applied. Sansalone and Streett (1997) published comprehensive mode shape analyses for square, rectangular, and circular cross-sections.
The equipment configuration for impact-echo testing has evolved significantly since the method’s development at NIST, but the fundamental components remain consistent: an impact source, a receiving transducer, and a data acquisition and analysis system.
The impact source must generate a short-duration, repeatable mechanical impact with controlled frequency content. The contact time (tc) of the impact determines the frequency range of the generated stress waves — shorter contact times produce higher-frequency content. The relationship between steel sphere diameter (D, in meters) and the maximum useful frequency (fmax, in Hz) is:
fmax = 292 / D
A 10 mm diameter sphere produces useful frequencies up to approximately 29 kHz, while a 3 mm sphere extends to approximately 97 kHz. The choice of impactor size depends on the depth of the target interface: deeper interfaces require lower frequencies (larger impactors) for adequate penetration, while shallow defects require higher frequencies (smaller impactors) for adequate resolution. Typical impact-echo testing uses a set of interchangeable steel spheres ranging from 4 mm to 20 mm diameter, or adjustable spring-loaded impactors that provide a range of contact times from 20 to 150 microseconds.
Rigid-body compliance between the impactor and the concrete surface affects the contact time. On rough or soft surfaces, the contact time increases, reducing the maximum useful frequency. This is why surface preparation (grinding smooth) is critical for reliable results when using small impactors for shallow defect detection.
The receiver must measure surface displacement normal to the concrete surface with high sensitivity and broad frequency response. Early impact-echo research used a specially developed conical piezoelectric displacement transducer (Proctor, 1982) that provided the necessary combination of sensitivity (approximately 1 V/μm) and frequency response (1 kHz to 100 kHz). Modern commercial impact-echo systems use broadband point-contact transducers with piezoelectric elements coupled to the concrete surface through a hardened steel tip. The transducer typically incorporates a built-in preamplifier to drive long cables without signal degradation.
The transducer is placed adjacent to the impact point — typically at a distance of 20% to 50% of the depth of the shallowest reflecting interface being measured. If the transducer is placed too close (<20%), the signal is dominated by the large-amplitude surface wave (R-wave) saturation. If placed too far (>50%), the response includes S-wave contributions that complicate the frequency spectrum. For a typical bridge deck thickness of 200-250 mm, the transducer spacing is 40-100 mm from the impact point.
The data acquisition system digitizes the analog signal from the transducer at a sufficient sampling rate and record length for frequency analysis. Key parameters specified in ASTM C1383 include:
Field impact-echo equipment has evolved from laboratory prototypes to rugged, portable commercial systems. Modern systems incorporate:
Calibration of impact-echo equipment is performed using reference blocks with known thickness and known defects (ASTM C1383). A calibration block of the expected concrete type and thickness range is tested to verify the system’s accuracy for thickness measurement — typically within ±3% for sound concrete.
Data interpretation is the most critical and skill-intensive aspect of impact-echo testing. The recorded time-domain waveform must be transformed and analyzed to extract meaningful information about the internal condition of the concrete.
The primary tool for impact-echo data interpretation is the Fast Fourier Transform (FFT) , which converts the recorded time-domain displacement waveform into a frequency-domain amplitude spectrum. The FFT decomposes the waveform into its constituent sinusoidal components, revealing the dominant frequencies present in the signal.
The amplitude spectrum typically contains several peaks. The most important for impact-echo analysis are:
Thickness frequency (fT) — The peak corresponding to multiple P-wave reflections between the top and bottom surfaces of a sound (flaw-free) plate. This is the primary frequency used for thickness calculation.
Defect frequency (fd) — A peak at a higher frequency than fT, corresponding to reflection from a shallower interface such as a delamination or void. The ratio fT/fd equals the ratio of the full thickness to the defect depth.
Flexural frequency (ff) — A low-frequency peak (typically 2-6 kHz) produced by the flexural vibration of a thin delaminated surface layer. This is termed the “drum effect” and indicates shallow delamination.
Multi-modal frequencies — In prismatic members (beams, columns) or near edges, additional peaks arise from cross-sectional vibration modes that must be identified and separated from thickness and defect peaks.
For a sound, defect-free plate, the amplitude spectrum should contain a single dominant peak at the thickness frequency (fT). ASTM C1383 defines the acceptability criteria for a valid thickness measurement:
If these criteria are not met, the test point must be repeated after improving surface conditions, adjusting the impactor, or relocating slightly to avoid surface irregularities.
When a flaw (delamination, void, or crack) exists within the concrete, the amplitude spectrum changes in characteristic ways that experienced operators recognize:
Presence of a higher-frequency peak — A peak at frequency f > fT indicates reflection from an internal interface shallower than the full thickness. The depth of the flaw is calculated as:
dflaw = β × Cp / (2 × fpeak)
Shift of the thickness peak — In some cases, the thickness peak may shift to a slightly lower frequency when the flaw is small, due to the longer travel path of waves diffracting around the flaw. Research by Carino (2015) documented that this shift is typically 5-15% of fT and can serve as a “telltale indicator” of small or partial-depth flaws.
Absence of thickness peak — A large, well-defined flaw (air-filled void or delamination extending across most of the area beneath the test point) may reflect nearly all P-wave energy, preventing the wave from reaching the bottom surface. In this case, no thickness peak appears, and the spectrum is dominated by the defect peak.
Low-frequency flexural peak — Shallow delamination (depth < 100 mm) produces a flexural vibration of the thin surface layer, similar to a drumhead. This peak appears at very low frequencies (typically 2-6 kHz) and its amplitude spectrum is typically broad with less clearly defined peaks. The flexural frequency cannot be used to calculate depth — it indicates the presence of shallow delamination but not its precise depth.
Noisy spectrum — Distributed cracking from freeze-thaw damage or alkali-silica reaction (ASR) produces multiple small reflections that appear as a general increase in spectral noise with no clear dominant peak. This pattern is diagnostic of distributed damage.
The P-wave speed (Cp) is required for calculating thickness or defect depth from the measured frequency. ASTM C1383 Procedure A provides a standardized method for measuring Cp using surface transmission:
Two receiving transducers are placed on the concrete surface at known distances (X₁ and X₂) from an impact point. The time-of-flight of the P-wave between the two transducers (Δt = t₂ - t₁) is measured from the time-domain waveforms. The P-wave speed is calculated as:
Cp = (X₂ - X₁) / (t₂ - t₁)
The transducers are typically positioned at distances of 150 to 450 mm from the impact point. The concrete surface must be air-dry (high surface moisture affects results per ASTM C1383 Section 4.6). A minimum of five impacts are averaged for each velocity measurement.
Because concrete is a heterogeneous material, P-wave speed can vary from point to point due to differences in concrete age, batch-to-batch variability, moisture content, and deterioration. ASTM C1383 requires Cp measurement at each test point where a thickness determination is made, unless a statistically representative value for the structure has been established through prior testing.
Delamination detection is the most common application of impact-echo testing for bridge decks, accounting for the majority of field deployments worldwide. Delamination — the horizontal separation of concrete layers parallel to the surface — is the precursor to spalling and represents a critical safety and maintenance concern for infrastructure owners.
When a delamination is present, the P-wave generated by impact reflects from the air-filled crack at the delamination boundary rather than propagating to the bottom of the slab. Because the acoustic impedance mismatch between concrete and air produces near-total reflection (R ≈ -1.0), the P-wave is trapped between the top surface and the delamination plane. This creates a resonance condition at a frequency corresponding to the delamination depth, which is higher than the thickness frequency of the sound slab.
For a typical 225 mm (9 inch) thick bridge deck with Cp = 4,000 m/s, the thickness frequency is:
fT = 0.96 × 4,000 / (2 × 0.225) = 8,533 Hz (≈ 8.5 kHz)
If a delamination exists at a depth of 50 mm (2 inches) below the surface, the defect frequency is:
fd = 0.96 × 4,000 / (2 × 0.050) = 38,400 Hz (≈ 38.4 kHz)
The amplitude spectrum would show a dominant peak at approximately 38.4 kHz (the defect frequency) and the thickness peak at 8.5 kHz would be reduced in amplitude or absent, depending on the size and reflectivity of the delamination.
For shallow delaminations (depth < 75 mm), the thin surface layer above the delamination vibrates in flexural mode (similar to a drumhead), producing a low-frequency peak in the 2-6 kHz range. This flexural peak is the impact-echo equivalent of the hollow sound heard during chain drag or hammer sounding. The flexural frequency depends on:
Because of these dependencies, the flexural frequency does not provide a reliable depth calculation — it is a qualitative indicator of shallow delamination presence rather than a quantitative depth measurement.
The minimum detectable delamination size depends on the impactor characteristics, the material properties, and the depth of the defect. Research by Sansalone and Carino (1988) established that for impact-echo to reliably detect a delamination:
The phase reversal in the reflection coefficient at concrete-air interfaces (R negative, incident compressive P-wave reflects as tensile P-wave) versus concrete-steel interfaces (R positive, no phase reversal) produces distinguishable signal characteristics. At a concrete-steel interface, the reflected P-wave alternates between compressive and tensile stress on successive arrivals, producing a periodic pattern with twice the time interval — and therefore half the frequency — compared to a concrete-air interface at the same depth.
Cheng and Sansalone (1993) demonstrated this principle experimentally: impact-echo tests over reinforcement bars produce a lower-frequency peak than tests at the same depth over an air void. This allows experienced operators to distinguish between rebar reflections and defect reflections.
Void detection in grouted post-tensioning tendon ducts is a specialized but increasingly important application of impact-echo. In post-tensioned concrete bridges, the steel tendons are housed in ducts (corrugated steel or plastic) that are grouted after tensioning to bond the tendons and prevent corrosion. Voids in the grout — caused by incomplete grouting, bleeding, or grout segregation — create air gaps where moisture can accumulate and corrosion can initiate.
Impact-echo is effective for void detection because:
Field studies on post-tensioned bridge structures have demonstrated detection accuracy of 85-95% for voids larger than approximately 100 mm in length, when validated by subsequent coring or borescopic inspection. The ICRI (International Concrete Repair Institute) and FHWA have published guidance on impact-echo protocols for tendon duct inspection.
Thickness measurement is the second major application of impact-echo testing, and it is the application standardized under ASTM C1383. The method is used to verify in-situ concrete slab thickness for:
The procedure for thickness measurement involves:
Accuracy: Under controlled conditions on sound concrete, impact-echo thickness measurement accuracy is typically ±3% or better for plate-like structures. A study by Sansalone and Carino found that 95% of thickness measurements fall within ±5% of core-measured thickness on bridge decks with thicknesses from 150 to 350 mm.
Limitations for thickness measurement:
Concrete is not a perfectly uniform material. P-wave speed can vary by 3-8% across a single bridge deck due to normal batch-to-batch variability, moisture gradients, temperature differences, and localized deterioration. This is why ASTM C1383 requires measurement of Cp at each thickness test point — using a single global Cp value introduces systematic error in thickness calculations.
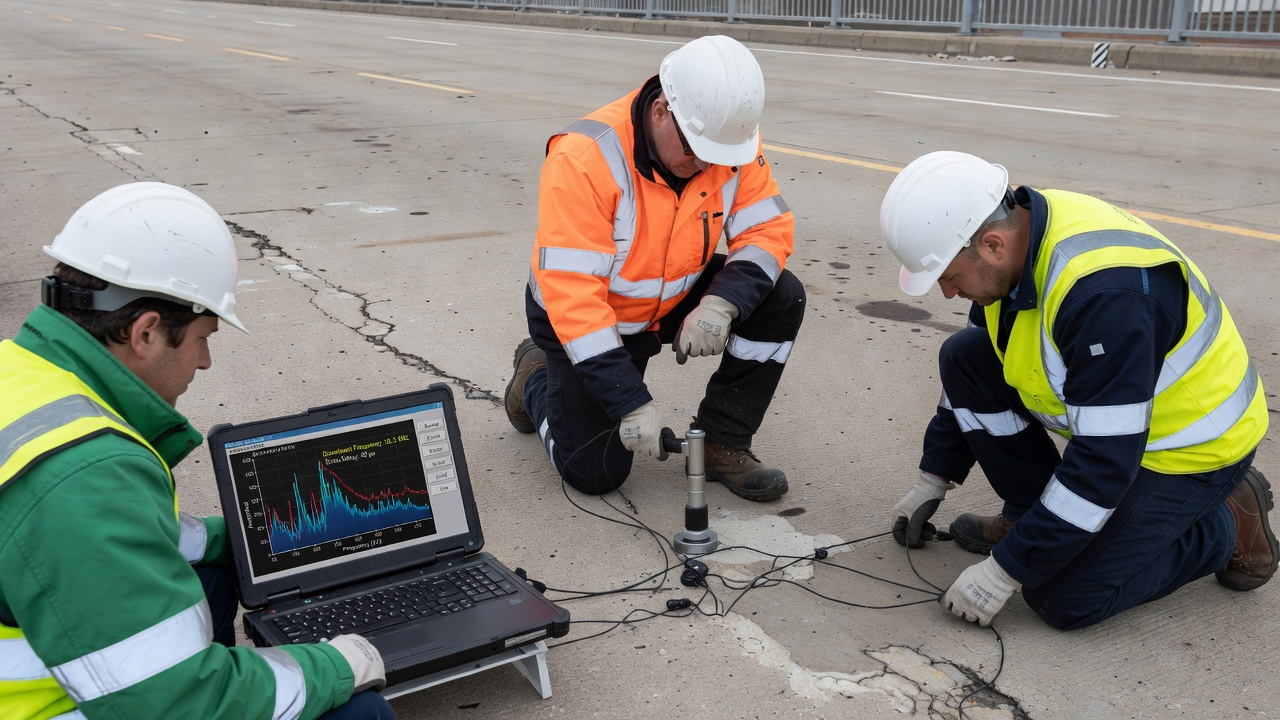
Bridge deck inspection represents the single largest application area for impact-echo testing. The FHWA InfoTechnology platform documents impact-echo as a primary NDT method for bridge deck condition assessment, particularly for delamination detection where it outperforms visual inspection and complements IRT and GPR.
Impact-echo surveys of bridge decks follow a systematic grid pattern:
Test grid spacing: Typical grid spacing is 0.3 × 0.3 m (1 × 1 ft) to 0.6 × 0.6 m (2 × 2 ft), depending on the inspection objective. Closer spacing provides higher resolution for detailed delamination mapping; wider spacing is used for rapid screening.
Data density: A 0.3 m grid on a 10 m × 15 m bridge deck (150 m²) requires approximately 1,700 test points. At a rate of 60-120 test points per hour for manual testing, this represents 14-28 hours of field testing. Multi-channel automated scanning systems can reduce this to 2-4 hours.
Reference points: A minimum of 3-5 test points on sound, defect-free concrete are used to establish the baseline thickness frequency and P-wave speed for the structure.
Calibration cores: Selective coring at representative locations (minimum 3-5 cores per bridge) provides direct thickness and condition verification to calibrate impact-echo results.
Impact-echo data for bridge decks is typically presented as:
Impact-echo is most effective when used as part of a multi-method NDT toolbox. The SHRP 2 R06A research program evaluated the effectiveness of NDT methods for bridge deck inspection and recommended combinations:
Impact-echo and ultrasonic testing are both stress-wave NDT methods, but they differ fundamentally in wave generation, frequency range, penetration, and application suitability. Understanding these differences is essential for selecting the appropriate method for a given inspection objective.
| Parameter | Impact-Echo | Ultrasonic Testing |
|---|---|---|
| Frequency range | 2-30 kHz (typical) | 50-500 kHz (concrete), 1-15 MHz (steel) |
| Wave generation | Mechanical impact (steel sphere) | Piezoelectric transducer |
| Penetration depth in concrete | Up to 1.5 m | Up to 1.0 m (UT tomography), 0.3 m (pulse-echo) |
| Sensitivity to aggregate scattering | Low (wavelength » aggregate size) | High (wavelength ≈ aggregate size) |
| Dominant wave type | P-wave (compressional) | P-wave and S-wave |
| Signal interpretation | Frequency domain (FFT) | Time domain (TOF) and frequency domain |
The key reason impact-echo succeeded where conventional ultrasonic methods failed for concrete defect detection is aggregate scattering. Concrete contains coarse aggregate particles typically 10-30 mm in diameter. When an ultrasonic wave with a wavelength comparable to or smaller than the aggregate size propagates through concrete, each aggregate-paste interface acts as a scattering center. The result is a multitude of overlapping echoes that obscure the reflections from real defects — the ultrasonic signal becomes unintelligible noise after traveling a few centimeters.
Impact-echo circumvents this limitation by using lower frequencies (longer wavelengths) generated by mechanical impact. The typical frequency range of 2-30 kHz corresponds to wavelengths of 130 mm to 1,000 mm in concrete (assuming Cp = 3,500-4,500 m/s). These wavelengths are much larger than the coarse aggregate particles (10-30 mm), so the waves “see” concrete as a homogeneous medium rather than a heterogeneous aggregate-paste composite. Scattering is dramatically reduced, and the waves can propagate through concrete for distances of 1 m or more with sufficient energy for reflection detection.
Impact-Echo excels at:
Ultrasonic testing excels at:
For complex structures, the two methods are complementary: impact-echo for rapid delamination screening and thickness measurement, ultrasonic tomography for detailed characterization of defects identified by IE screening.
ASTM C1383 — Standard Test Method for Measuring the P-Wave Speed and the Thickness of Concrete Plates Using the Impact-Echo Method — is the primary standard governing impact-echo testing. First adopted in 1998 and most recently reaffirmed in 2022 (C1383-15R22), the standard defines:
Scope: The test method covers procedures for determining the thickness of concrete slabs, pavements, bridge decks, walls, or other plate-like structures. It applies to plate-like structures with lateral dimensions at least six times the thickness.
Procedure A — P-Wave Speed Measurement: Measures the travel time of the P-wave between two transducers at known distances from an impact point on the concrete surface. The P-wave speed is calculated as the distance between transducers divided by the travel time.
Procedure B — Impact-Echo Test: Measures the frequency of P-wave reflections between parallel surfaces of a concrete plate. Thickness is calculated from the frequency and P-wave speed.
Key requirements:
Interpretation of impact-echo results requires trained and experienced personnel. The American Concrete Institute (ACI) offers a Concrete NDT Technician Certification Program that includes impact-echo methodology. NDT personnel qualification standards (ISO 9712, ASNT SNT-TC-1A) apply to impact-echo as a specialized test method.
Despite its proven effectiveness for concrete inspection, impact-echo has well-established limitations that must be understood for appropriate application.
Impact-echo cannot reliably measure thickness or detect defects in concrete covered by an asphalt overlay thicker than approximately 100 mm. The asphalt strongly attenuates the stress waves, preventing sufficient energy from reaching the concrete to produce detectable reflections. Additionally, the damping characteristics of asphalt suppress the flexural vibrations of shallow delamination, making delamination detection difficult.
For concrete with thin bonded overlays (e.g., latex-modified concrete overlay, polymer overlay), the overlay-base concrete interface may produce a reflection peak that is difficult to distinguish from a delamination or the bottom surface. If the overlay is well-bonded and has similar acoustic properties to the base concrete, it may not produce a separate reflection — the thickness peak corresponds to the combined thickness. If the overlay is partially debonded, the interface peak is indistinguishable from delamination.
ASTM C1383 is explicitly limited to plate-like structures with lateral dimensions at least six times the thickness. This restriction exists because:
Guidance for testing non-plate geometries is provided by ACI 228.2R-13 and research publications (Sansalone and Streett, 1997), but the analysis requires significantly more expertise than plate testing.
Dense reinforcement (closely spaced bars, multiple layers) creates multiple concrete-steel interfaces that produce reflection peaks in the amplitude spectrum. These peaks can obscure or be confused with defect peaks. The effect is particularly problematic when:
Experienced operators learn to identify rebar peaks by their characteristic frequency and the absence of phase-reversal signatures. Strategies for mitigating reinforcement interference include testing between rebar locations (using GPR or a cover meter to map bar locations before IE testing) and using smaller impactors (higher frequency) to improve the distinction between rebar and defect reflections.
Impact-echo is not a “black box” method. Successful field application requires:
The NIST overview document (Carino, 2001) emphasizes that “lack of adequate training can lead a user to arrive at incorrect conclusions from the NDT survey, which will cast a negative image on the NDT method.”
The integration of artificial intelligence (AI), machine learning (ML), and automation is transforming impact-echo data interpretation, addressing the method’s traditional limitations of operator dependence and slow data collection.
Traditional impact-echo interpretation relies on an operator visually examining amplitude spectra to identify dominant frequency peaks. This process is subjective, time-consuming, and requires significant experience. Recent research has successfully applied convolutional neural networks (CNNs) and deep learning (DL) to automate the classification of impact-echo signals.
Pandum et al. (2024) at Hokkaido University demonstrated a supervised deep learning approach that classifies impact-echo waveforms as “sound concrete,” “crack present,” or “delamination present” with accuracy exceeding 90%. The study used Fast Fourier Transform (FFT)-converted frequency spectra as input features to a multi-layer neural network trained on laboratory specimens with controlled defects.
Research published in Case Studies in Construction Materials (2024) proposed an automatic method to eliminate invalid impact-echo signals using a ResNet model, where time-domain signals are converted to two-dimensional images for classification. This approach filters out signals degraded by poor coupling, surface roughness, or noise before they reach the analyst — improving data quality and reducing false positives.
Beyond simple classification, ML models have been trained to estimate defect depth from impact-echo spectra with accuracy comparable to experienced human operators. The models learn the relationship between spectral peak patterns and defect depth from large training datasets of laboratory specimens with known defects. Random forest, support vector machine, and neural network models have all been applied, with neural networks generally providing the best accuracy for complex multi-defect scenarios.
Robotic scanning platforms have advanced from laboratory prototypes to field-deployable systems. Modern automated impact-echo systems incorporate:
Data from automated scanning systems is processed into:
Olson Engineering and other manufacturers have developed commercial systems that produce these output formats automatically from field data, with minimal operator intervention.
Ongoing research at universities and NDT equipment manufacturers is exploring:
The potential for AI to dramatically reduce the skill barrier for impact-echo data interpretation is significant, but validation on diverse real-world structures remains an ongoing research need. Current AI models perform well on laboratory specimens and controlled field tests but may not generalize to the full range of field conditions — surface roughness, variable moisture, temperature effects, different concrete mixtures — encountered in practice.
| Method | Detection Capability | Speed | Depth | Single-Sided | Overlay Tolerance | Data Type |
|---|---|---|---|---|---|---|
| Impact-Echo | Delamination, voids, thickness | Slow (point-by-point) | Up to 1.5 m | Yes | Limited (<100 mm) | Frequency spectrum |
| Ultrasonic Tomography | Internal voids, rebar, cracks | Slow | Up to 1.0 m | Yes | Yes | Volumetric image |
| Ground-Penetrating Radar | Rebar, voids, moisture, thickness | Fast (traffic speed) | Up to 0.5 m (2.6 GHz) | Yes | Yes | Radargram |
| Infrared Thermography | Shallow delamination | Fast (traffic speed) | <100 mm | Yes | Limited | Thermal image |
| Half-Cell Potential | Corrosion activity | Moderate | At rebar depth | Yes | No | Potential map |
| Chain Drag/Sounding | Shallow delamination | Moderate | <75 mm | Yes | No | Acoustic |
| Radiography | Voids, rebar condition, grout voids | Slow | Up to 600 mm | No (two-sided) | No | Radiographic image |
Enhance concrete infrastructure condition assessment with impact-echo NDT data integrated into TarmacView's AI-powered digital twin platform — combining stress-wave results with aerial thermal and visual inspection for comprehensive asset intelligence.
Non-Destructive Testing (NDT) encompasses methods to evaluate material properties, detect defects, and assess structural condition without causing damage. For i...
Ultrasonic Testing (UT) uses high-frequency sound waves (typically 20 kHz–200 MHz) to detect internal flaws, measure thickness, and assess material properties i...
Acoustic Emission (AE) is a passive non-destructive testing method that detects and locates transient stress waves generated by active defect processes — crack ...