Infrared Thermography (IRT) is a non-contact, non-destructive testing method that detects surface temperature variations caused by subsurface defects such as delamination, debonding, and voids in bridge decks and pavements. IRT exploits differential heat flow through materials to identify structural anomalies rapidly over large areas, deployable from vehicles or drones.
Infrared Thermography (IRT) for Bridge Deck and Pavement Inspection
Principles of Infrared Thermography
Infrared Thermography (IRT) is a non-contact, non-destructive testing (NDT) method that measures and visualizes the thermal radiation emitted from the surface of an object to detect subsurface anomalies. The physical foundation of IRT rests on the principle that every object with a temperature above absolute zero (0 K) emits electromagnetic radiation in the infrared portion of the spectrum. The intensity of this radiation is a direct function of the object’s surface temperature — the Stefan-Boltzmann law states that total radiant energy emission is proportional to the fourth power of absolute temperature (E = εσT⁴, where ε is emissivity, σ is the Stefan-Boltzmann constant of 5.67 × 10⁻⁸ W/m²K⁴, and T is absolute temperature in Kelvin). Infrared cameras detect this emitted radiation in the long-wave infrared (LWIR) band, typically 7.5–14 µm, and convert it into a visual image called a thermogram, where each pixel represents a temperature value displayed through a false-color palette.
Heat Transfer and Thermal Contrast
The detection of subsurface defects using IRT depends on the physics of heat transfer through a three-dimensional solid. Three mechanisms govern thermal behavior in bridge decks and pavements: conduction (heat flow through the material via molecular vibration), convection (heat transfer between the surface and the surrounding air), and radiation (heat exchange between the surface and the sun, sky, and surrounding objects). For IRT inspection, conductive heat flow is the primary mechanism of interest.
The governing equation for transient heat conduction (the diffusion equation) is:
∂T/∂t = α (∂²T/∂x² + ∂²T/∂y² + ∂²T/∂z²)
where T is temperature, t is time, α is thermal diffusivity (α = k/ρc, where k is thermal conductivity, ρ is density, and c is specific heat capacity). Concrete has a thermal diffusivity of approximately 0.7–1.0 × 10⁻⁶ m²/s, while air — the material filling a delamination gap — has a thermal diffusivity roughly 100 times lower. This dramatic difference in thermal diffusivity is the key physical mechanism enabling delamination detection.
When a delamination is present, the air-filled gap acts as a thermal insulator that impedes the downward conduction of heat during the heating phase (solar loading) or the upward conduction of heat during the cooling phase (radiative cooling). During solar heating, the concrete above the delamination absorbs solar radiation and heats up, but the air gap below prevents this heat from conducting deeper into the deck. As a result, the surface above the delamination becomes warmer than adjacent sound concrete — a phenomenon called positive thermal contrast or a hot spot. During nighttime cooling, the reverse occurs: the air gap prevents heat stored in the lower deck from rising to the surface, so the area above the delamination cools more slowly and appears warmer than the surrounding sound concrete — inverse thermal contrast.
The magnitude of the surface temperature differential (ΔT) caused by a delamination depends on several factors: the depth of the defect below the surface (shallower defects produce larger ΔT), the thickness of the air gap, the thermal properties of the concrete, the solar radiation intensity, wind speed (convective cooling reduces ΔT), and the presence of any overlay. Typical ΔT values for bridge deck delaminations range from 0.5°C to 3°C under good solar loading conditions. The minimum detectable ΔT is governed by the camera’s Noise Equivalent Temperature Difference (NETD), typically 20–50 mK (0.02–0.05°C) for modern microbolometer-based cameras.
Solar Loading and Diurnal Effects
Solar loading — the absorption of solar radiation by the pavement or deck surface — is the primary heat source for passive IRT bridge deck surveys. The sun provides approximately 1000 W/m² of solar irradiance at the earth’s surface on a clear day at solar noon. The amount of this energy absorbed by the deck surface depends on the surface’s solar absorptivity (typically 0.6–0.9 for concrete and asphalt) and the angle of incidence (which varies with latitude, time of day, and season).
The Federal Highway Administration (FHWA) recommends that IRT surveys be conducted when solar radiation levels exceed 250 W-h/m². According to research from the Virginia Transportation Research Council (VTRC Report 20-R22), this threshold is met for approximately 30% of daylight hours in a typical year at mid-latitude locations such as Charlottesville, Virginia. The optimal survey window is 5–9 hours after sunrise (peak heating) or 3–5 hours after sunset (peak cooling). In temperate climates, effective surveys are possible from approximately 9:00 AM to 3:00 PM on clear, sunny days from late spring through early fall. During winter months (October through February at northern latitudes), solar radiation is typically insufficient for reliable passive IRT.
The diurnal temperature cycle creates a time-dependent thermal contrast profile. Simulations show that the temperature differential between delaminated and sound areas begins to develop approximately 2–3 hours after sunrise, reaches a peak around solar noon, and decays through the afternoon. The peak differential typically occurs when the solar radiation intensity is at its maximum, but the exact timing depends on the thermal mass of the deck, overlay thickness, and ambient conditions. Cloud cover, even temporary, can dramatically reduce thermal contrast because the radiative heat source (direct sunlight) is replaced by diffuse sky radiation with much lower intensity. Wind speeds above 15–20 km/h significantly degrade thermal contrast through enhanced convective cooling at the surface.
Passive vs Active Thermography
Passive Thermography
Passive thermography measures the naturally occurring infrared radiation emitted from the target surface without applying any external thermal excitation. For bridge deck and pavement inspection, the natural heat source is solar radiation (solar loading) supplemented by the ambient thermal environment. Passive IRT is the predominant method for infrastructure inspection because it requires no additional equipment beyond the thermal camera, can be deployed at normal traffic speeds from a vehicle, and covers large areas efficiently.
In passive thermography, the thermal camera records the surface temperature distribution of the bridge deck or pavement as it heats up during the day or cools down at night. Subsurface defects appear as thermal anomalies — areas that are hotter (during heating) or cooler (during cooling) than the surrounding sound material. The analysis focuses on identifying static thermal patterns rather than dynamic thermal response. The inspector or automated software compares temperature values across the surface, looking for areas where the temperature deviates from the baseline by more than a defined threshold (typically 0.5–1.0°C under favorable conditions).
The advantages of passive thermography for infrastructure inspection include:
No external heat source required — solar radiation provides free, uniform heating over large areas
Rapid survey speed — vehicle-mounted systems can scan at driving speeds up to 70 mph (113 km/h)
Minimal traffic disruption — surveys conducted with normal traffic flow
Wide-area coverage — a single pass captures a 15-foot (4.6 m) swath
Low operational complexity — requires only a thermal camera, recorder, and vehicle
The disadvantages include:
Environmental dependence — requires clear skies, adequate solar radiation, and low wind
Time-of-day constraints — surveys limited to specific windows (5–9 hours after sunrise or 3–5 hours after sunset)
Seasonal limitations — ineffective during winter months at northern latitudes
Overlay attenuation — asphalt or concrete overlays reduce thermal contrast
Active thermography applies a controlled external energy source to the target to create a thermal differential that reveals subsurface defects. The external excitation can be optical (flash lamps, halogen lamps, lasers), convective (hot air guns), mechanical (ultrasonic vibration), or inductive (eddy current heating). After the excitation is applied, the thermal camera records the surface temperature evolution over time, analyzing how thermal waves propagate through the material and how they are reflected or attenuated by defects.
The primary active thermography methods used in NDT are:
Pulsed thermography: A short, high-energy pulse of light (typically from xenon flash lamps) heats the surface in milliseconds. The thermal camera records the surface temperature decay over time. Defects below the surface appear as areas that cool more slowly (because the air gap reflects thermal waves back toward the surface) or more quickly (if the defect is highly conductive). The time at which the maximum thermal contrast occurs is related to the defect depth — deeper defects produce later peak contrast.
Lock-in thermography: A periodic thermal wave is generated using modulated halogen lamps or lasers. The thermal camera records the surface temperature at the same frequency, and lock-in processing extracts the amplitude and phase of the thermal response. Phase images are particularly useful because they are less affected by surface emissivity variations and non-uniform heating. Defect depth can be estimated from the phase delay of the thermal wave.
For bridge deck and pavement inspection, active thermography is primarily used in research contexts or when passive methods are impractical — for example, inspecting shaded areas beneath bridge superstructures, vertical or overhead concrete surfaces, decks with thick overlays, or during periods of insufficient solar radiation. Active thermography is also used for laboratory-based concrete testing where controlled conditions enable precise defect characterization. The University of Oviedo research group has demonstrated that active thermography with flash excitation can detect debonding in concrete specimens at depths up to 50 mm.
Slow (requires excitation setup and cool-down per area)
Coverage area
Large (entire bridge deck in 30 min)
Small (localized to excitation zone)
System complexity
Low (thermal camera only)
High (requires synchronized excitation source and controller)
Depth penetration
Limited to 4–6 inches (100–150 mm)
Varies with excitation method; typically 2–10 mm for pulsed thermography
Environmental constraints
Significant (weather, time of day, season dependent)
Minimal (can be used in controlled or indoor conditions)
Cost
Lower (equipment only)
Higher (excitation source + camera + control system)
Equipment for Infrared Thermography
Thermal Camera Specifications
Modern IRT systems for bridge deck and pavement inspection use uncooled microbolometer array detectors operating in the long-wave infrared (LWIR) spectral band of 7.5–14 µm. This band is preferred because it corresponds to the peak thermal emission wavelength for objects near ambient temperatures (−20°C to +60°C), and the atmospheric transmission window in this range is excellent. The detector array consists of thousands to millions of vanadium oxide (VOx) or amorphous silicon (α-Si) microbolometer pixels, each of which changes electrical resistance in response to heating by absorbed infrared radiation.
Key specifications for IRT inspection cameras include:
Spectral range: 7.5–14 µm (LWIR). Some systems use mid-wave infrared (MWIR, 3–5 µm) with cooled detectors for higher sensitivity, but these are significantly more expensive and less common for infrastructure inspection.
Thermal sensitivity (NETD): 20–50 mK (0.02–0.05°C). NETD is the smallest temperature difference the camera can reliably detect. Lower NETD enables detection of smaller thermal anomalies. Cameras with NETD ≤ 30 mK are preferred for bridge deck surveys.
Spatial resolution: 320 × 240 to 640 × 512 pixels. Higher resolution provides better spatial detail but generates larger data volumes. For vehicle-mounted surveys, 640 × 512 is standard, providing approximately 2–5 cm ground sample distance at typical survey altitudes.
Field of view (FOV): Typically 24° × 18° to 45° × 34° for bridge deck cameras. Wider FOV covers more surface per pass but reduces spatial resolution. Narrower FOV provides better detail at longer standoff distances (e.g., drone-mounted cameras inspecting bridge girders).
Frame rate: 30–60 Hz for vehicle-mounted surveys. Higher frame rates are needed for faster survey speeds to avoid motion blur.
Temperature range: −20°C to +150°C (standard) or broader for extreme environments.
Radiometric accuracy: ±2°C or ±2% of reading (whichever is greater) for absolute temperature measurement. For defect detection, relative temperature difference (thermal contrast) is more important than absolute accuracy.
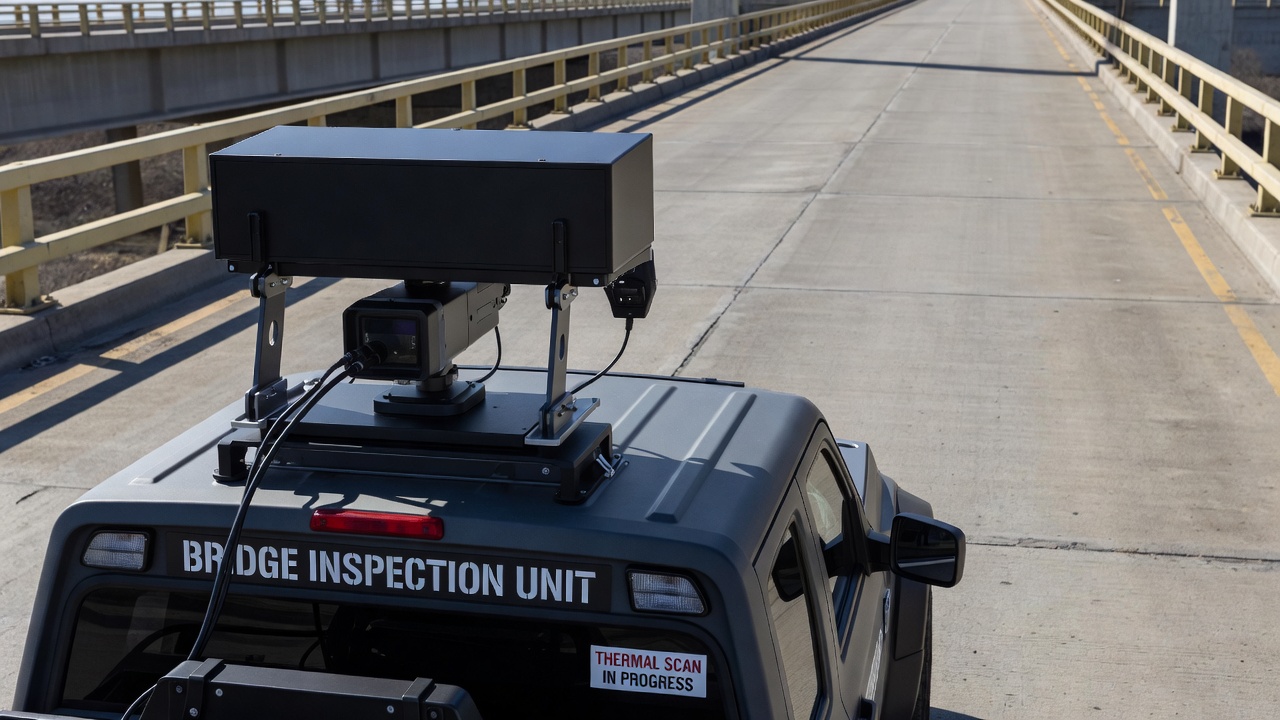
Vehicle-Mounted IR Systems
The standard deployment method for bridge deck IRT surveys per ASTM D4788 is a vehicle-mounted system. The Deck Top Scanning System (DTSS) developed by NEXCO and used by the University of Central Florida is an example of a production-grade vehicle-mounted IR system. The DTSS includes an LWIR camera and two line-scanning cameras mounted on a vehicle roof rack, enabling data collection at speeds up to 70 mph (113 km/h) with a single pass covering a 15-foot (4.6 m) swath. Multiple passes with overlapping coverage provide seamless visualization of the entire deck width.
Vehicle-mounted systems offer several advantages:
No traffic closure required — surveys conducted with normal traffic flow at highway speeds
Large-area coverage — a typical bridge deck can be surveyed in 30 minutes or less
Consistent image quality — stable platform with controlled standoff distance
Integration with GPS/GNSS — each thermal image is georeferenced for precise anomaly location
Day and night operation — systems can acquire data during both heating and cooling cycles
The FHWA guidelines recommend that vehicle-mounted surveys use overlapping passes to ensure complete coverage, with image acquisition triggered either by distance (odometer wheel) or time (fixed frame rate) synchronized with vehicle speed. Post-processing software stitches individual thermal images into a continuous thermal map of the entire deck surface.
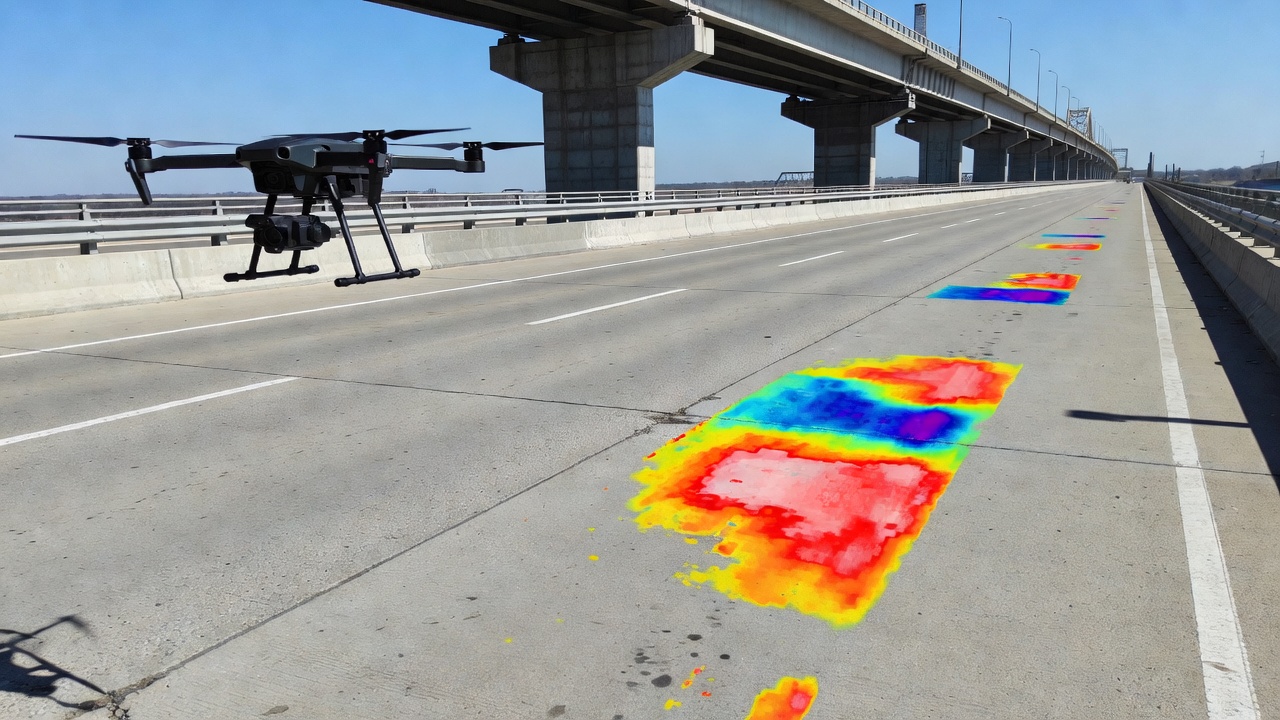
Drone-Mounted IR Systems
Unmanned aerial vehicles (UAVs) or drones equipped with thermal cameras are increasingly used for IRT inspection, particularly for bridge elements that are inaccessible to vehicle-mounted systems. Drone-based IRT enables inspection of vertical surfaces (bridge piers, abutments, retaining walls), deck soffits (underside of bridge decks), tunnel linings, and culvert interiors. Research conducted by the University of Nebraska-Lincoln and the Nebraska Department of Transportation demonstrated that drone-based thermography can effectively detect delaminations on both horizontal and vertical concrete surfaces.
Drone-mounted IR systems typically consist of:
A multi-rotor UAV with 15–30 minute flight endurance
A lightweight LWIR camera payload (typically 200–500 g) with 640 × 512 resolution
A visual (RGB) camera for data fusion and contextual reference
Real-time video downlink allowing the operator to view thermal imagery during flight
Onboard GPS/IMU for image georeferencing
Obstacle avoidance sensors for safe operation near structures
Key considerations for drone-based IRT include:
Altitude and resolution: Flight altitude determines ground sample distance. For bridge deck surveys, typical altitudes of 20–50 m above the deck surface provide GSD of 2–8 cm/pixel depending on camera specifications.
Flight path planning: Automated flight missions with programmed waypoints, overlap (typically 70–80% forward and side overlap for photogrammetric mosaicking), and camera trigger intervals ensure systematic coverage.
Regulatory constraints: Operations must comply with national aviation authority regulations. In the United States, FAA Part 107 applies for commercial drone operations, with additional restrictions for beyond visual line of sight (BVLOS) flight, flights over people, and operations near airports or critical infrastructure.
Environmental sensitivity: Drone flights are affected by wind speed (maximum 15–20 km/h for stable thermal imaging), precipitation, and visibility.
Battery limitations: Flight endurance of 20–30 minutes per battery limits the area coverage per flight to approximately 5–10 bridge decks depending on size.
Integrated Multi-Sensor Systems
State-of-the-art IRT inspection programs increasingly combine thermal imaging with complementary NDT methods. The University of Central Florida’s AI-integrated bridge deck inspection framework combines vehicle-mounted IR imaging with ultrasonic tomography (UT) for validated defect characterization. In this workflow, IRT provides rapid wide-area screening to flag potential defect areas, and UT provides detailed 3D depth and severity information on the flagged zones. This multi-sensor approach optimizes the strengths of each method — speed from IRT, precision from UT — while mitigating their individual limitations.
Other integrated systems combine IRT with ground-penetrating radar (GPR) for simultaneous surface and subsurface assessment. GPR provides information on deck thickness, reinforcement location, and deeper defects, while IRT identifies near-surface delaminations and debonding. The FHWA recommends multi-method NDE deployments for comprehensive bridge deck condition assessment.
Bridge Deck Delamination Detection
Physical Mechanisms
Bridge deck delamination is a horizontal separation within the concrete slab, typically occurring at or near the plane of the top reinforcing steel (rebar). Delamination occurs when corrosion of the top mat of steel reinforcement produces expansive corrosion products (rust) that generate tensile stresses exceeding the concrete’s tensile strength, creating a crack that propagates parallel to the deck surface. The resulting air-filled gap typically ranges from 0.1 to 5 mm in thickness and extends over areas from a few square centimeters to several square meters. This air gap creates the thermal barrier that IRT exploits.
The detection of delaminations using IRT depends on the thermal resistance introduced by the air-filled gap. The thermal conductivity of air (0.026 W/mK) is approximately 30 times lower than that of concrete (1.7–2.5 W/mK). Even a 0.5 mm air gap provides thermal resistance equivalent to approximately 30 mm of concrete. During solar heating, the concrete above this thermal barrier absorbs heat from the sun but cannot conduct it downward into the deck, causing the surface temperature above the delamination to rise above that of the surrounding sound concrete. The magnitude of this temperature differential depends on:
Delamination depth: Shallow delaminations (within 50 mm of the surface) produce larger ΔT. Delaminations deeper than 100–150 mm are typically undetectable by conventional passive IRT.
Delamination thickness: Thicker air gaps provide greater thermal resistance and larger ΔT, up to a saturation point beyond which additional thickness has no effect.
Solar radiation intensity: Higher insolation produces larger ΔT. Minimum threshold of 250 W-h/m² is required for reliable detection.
Overlay thickness: Asphalt or concrete overlays attenuate the thermal signal. An overlay of 50 mm (2 inches) can reduce ΔT by 50% or more compared to a bare deck.
Concrete thermal properties: Thermal diffusivity varies with aggregate type, water-cement ratio, and moisture content, affecting the rate of heat propagation and the magnitude of thermal contrast.
The standard test method for detecting delaminations in bridge decks using IRT is ASTM D4788-03(2022) — Standard Test Method for Detecting Delaminations in Bridge Decks Using Infrared Thermography. This standard, developed by ASTM Subcommittee D04.32 on Bridge Deck Inspection, specifies the procedures for vehicle-mounted IRT surveys of portland-cement concrete bridge decks.
Key provisions of ASTM D4788 include:
The method is applicable to both exposed concrete decks and overlaid decks (asphalt or concrete overlays up to 4 inches or 100 mm thickness).
The system must include an imaging infrared scanner and video recorder mounted on a vehicle.
The survey should be conducted during periods of adequate solar loading, typically between 5 and 9 hours after sunrise or 3 to 5 hours after sunset.
The infrared camera should have sufficient thermal sensitivity to detect temperature differences of 0.5°C or less.
The vehicle should travel at a speed that allows the camera to capture clear thermal images without motion blur.
Thermal anomalies should be marked or recorded for verification by other methods (chain drag, core sampling, or sounding).
The test results indicate areas of potential delamination that should be verified by other means — IRT is a screening tool, not a definitive acceptance test.
The FHWA Information Technology portal for Infrared Thermography (IT) provides additional guidance:
The best time for IR surveys is 5–9 hours after sunrise or the same number of hours after sunset.
Thermal imaging experiments have shown the highest surface temperature differential during these windows.
Overlaid decks require special consideration because the overlay attenuates the thermal signal.
Data Collection Procedures
The practical implementation of an IRT bridge deck survey involves several steps:
Pre-survey preparation: The survey area is identified, weather conditions are verified (clear skies, adequate solar radiation, low wind), and the optimal survey window is selected. The deck surface should be dry — standing water or wet surfaces create false thermal anomalies and reduce effective emissivity. The infrared camera is calibrated, and the recording system is configured.
Survey execution: The vehicle traverses the bridge deck at a constant speed (typically 50–70 km/h for highway bridges), maintaining consistent lane position. The IR camera records continuous thermal video or captures still images at predetermined intervals (distance-based or time-based). For decks wider than the camera’s swath width, multiple passes with overlapping coverage are conducted. Both daytime (heating phase) and nighttime (cooling phase) surveys can be conducted, with nighttime surveys often providing complementary thermal contrast.
Data recording: Each thermal image or video frame is georeferenced using GPS coordinates. Some systems integrate distance measurement instruments (DMI) for accurate longitudinal positioning. The raw data is stored for post-processing and analysis.
Post-processing: Thermal images are stitched into a continuous mosaic of the deck surface. Temperature normalization and contrast enhancement algorithms are applied to improve defect visibility. False-color palettes (ironbow, rainbow, or grayscale) are applied to highlight thermal anomalies. The processed thermal map is overlaid onto the bridge plan view for spatial analysis.
Anomaly identification: Thermal anomalies are identified as areas where the surface temperature deviates from the local baseline by more than a defined threshold. Anomalies are classified by size, shape, and temperature differential. The analyst must distinguish between true defect-related anomalies and false signals from surface features (cracks, patches, oil stains, moisture, shadows, joints, surface texture variations, or debris).
Time-Lapse Infrared Thermography
An advanced approach developed by the Virginia Transportation Research Council (VTRC Report 20-R22) is time-lapse infrared thermography (TLIRT). Instead of acquiring a single snapshot of thermal data during a vehicle pass, TLIRT collects IR data over an extended period — hours or even days — by mounting a thermal camera on a stationary structure (such as a sign bridge or adjacent building) overlooking the deck. This extended data acquisition greatly increases the probability of capturing surface temperature data at the optimal thermal contrast moment.
TLIRT offers several advantages over conventional snapshot thermography:
Reduced environmental sensitivity: The extended acquisition period averages out the effects of cloud cover, wind gusts, and other transient environmental factors.
Increased probability of optimal contrast: With hours of continuous data, the system is virtually guaranteed to capture the peak thermal differential.
Physics-based quantitative analysis: The time-temperature history enables application of inverse heat transfer models to extract quantitative information, including defect depth and type discrimination (delamination vs. overlay debondment).
Objective defect detection: Rather than subjective visual analysis of a single image, TLIRT provides quantitative thermal property data that supports automated defect detection algorithms.
VTRC developed a prototype TLIRT system and a physics-based analysis program that can distinguish between concrete deck delamination and overlay debondment, and provide depth-to-defect estimates. The system is ready for deployment on most bridges, offering full-field non-contact survey with minimal traffic impact.
Pavement Debonding and Void Detection
Asphalt Pavement Debonding
Debonding in asphalt pavements refers to the loss of bond between pavement layers — typically between an asphalt overlay and the underlying concrete deck or between asphalt lifts. Debonding creates a horizontal separation that, like delamination in concrete, introduces an air gap that impedes heat flow. IRT detects debonded areas as thermal anomalies during solar heating: the debonded overlay heats up more than the surrounding well-bonded area because the air gap below prevents heat from conducting into the lower layer.
Research conducted by the Nebraska Department of Transportation and published by the National Transportation Library (ROSAP DOT 61030) demonstrated the use of drone-mounted IRT for detecting subsurface voids and debonding in roadway pavements. The study found that IRT reliably detected near-surface voids and interlayer debonding at depths up to 75–100 mm, with detection reliability decreasing as defect depth increased.
The thermal signature of pavement debonding differs from concrete delamination in several respects:
Asphalt has higher solar absorptivity (0.85–0.95) than concrete (0.60–0.75), creating stronger heating and larger thermal gradients.
Asphalt has lower thermal conductivity (0.7–1.0 W/mK) than concrete, which affects the rate of heat propagation.
Asphalt overlays are typically thinner (25–100 mm) than concrete decks (200–300 mm), so the thermal signal from debonding at the interface propagates to the surface more efficiently.
Surface texture variations in asphalt (particularly open-graded friction courses) can create emissivity variations that complicate thermal interpretation.
Void Detection in Concrete Pavements
Voids in concrete pavements — air-filled cavities caused by poor consolidation during construction, erosion of subbase material, or culvert failures — can be detected using IRT when they are sufficiently close to the surface. The University of Nebraska-Lincoln, in collaboration with the Nebraska DOT, conducted a comprehensive study (Report M082) evaluating the feasibility of using UAV-mounted IRT and GPR for early detection of near-surface void defects in concrete pavements. The research demonstrated that IRT could detect voids at depths up to 75–100 mm under favorable thermal conditions.
Void detection relies on the same thermal insulation principle as delamination detection. The air-filled void creates a thermal barrier that causes the pavement surface above the void to heat up more rapidly and reach higher temperatures than surrounding sound pavement during solar loading. During the cooling phase, the void area retains heat longer, appearing warmer on nighttime thermograms.
Key factors affecting void detectability include:
Void depth: Shallow voids (within 50 mm of the surface) produce the strongest thermal signals.
Void size: Larger voids produce more extensive thermal anomalies. Voids smaller than 100–150 mm in diameter may not produce detectable ΔT.
Void geometry: Thin, planar voids (delaminations) produce stronger thermal contrast than spherical or irregular voids because they present a more continuous thermal barrier.
Moisture content: Water-filled voids have different thermal properties than air-filled voids. Water has much higher thermal conductivity (0.6 W/mK) than air (0.026 W/mK), so moisture-filled voids may not produce detectable thermal contrast.
Asphalt Overlay Condition Assessment
Many concrete bridge decks are overlaid with asphalt concrete (AC) wearing surfaces to provide a smoother riding surface, protect the underlying deck from water infiltration, and extend the service life of the structure. The presence of an asphalt overlay creates additional complexity for IRT inspection. The overlay adds thermal mass, attenuates the thermal signal from defects in the underlying concrete, and introduces its own potential failure modes (overlay debonding, delamination within the overlay itself).
ASTM D4788 specifically addresses that the test method can be used on asphalt or concrete overlays as thick as 4 inches (100 mm) . However, research by VTRC has shown that a 50 mm (2 inch) AC overlay can reduce the surface temperature differential from a concrete delamination by 50% or more compared to a bare concrete deck. The overlay also causes lateral thermal diffusion — the spread of heat in the horizontal direction — which makes the thermal anomaly less distinct and spreads the temperature difference over a larger area.
For overlaid decks, the following considerations apply:
Higher thermal camera sensitivity is required — cameras with NETD ≤ 30 mK are recommended.
Optimal survey timing is more critical — the narrower temperature differential requires peak thermal conditions.
Thicker overlays may preclude IRT detection — for overlays exceeding 100 mm (4 inches), IRT may not be capable of detecting underlying concrete defects.
Time-lapse IRT provides better results — the extended data acquisition in TLIRT increases probability of detecting subtle thermal anomalies through overlays.
Debonding at the overlay-deck interface is often easier to detect than delamination within the concrete because it is closer to the surface.
Data Interpretation and Image Processing
Thermal Image Analysis
The interpretation of thermal images for defect detection requires a systematic approach that accounts for the complex interaction between subsurface defects, environmental conditions, and surface features. Raw thermal images are two-dimensional arrays of temperature values, each pixel representing the surface temperature at a specific location. The analysis process transforms these raw temperature measurements into actionable defect maps.
Visual interpretation by a trained analyst is the traditional approach. The analyst reviews the thermal imagery, looking for areas where the temperature deviates from the surrounding baseline. Experienced analysts consider the thermal gradient (rate of temperature change across the anomaly), the shape and size of the anomaly, and the context of the anomaly location (edges, joints, patches, or other surface features). Delaminations typically appear as discrete, well-defined hot spots with sharp thermal boundaries during heating, or as warm areas with gradual thermal decay during cooling.
Digital image processing techniques enhance the raw thermal data to improve defect visibility and enable automated analysis. Common processing steps include:
Temperature normalization: Correcting for spatial variations in solar loading, camera response, and ambient temperature across the image. This is typically done by subtracting a second-order polynomial surface fitted to the temperature data, isolating local thermal anomalies from global temperature gradients.
Contrast enhancement: Applying histogram equalization, adaptive contrast stretching, or local contrast normalization to improve the visibility of subtle thermal anomalies. These techniques expand the temperature range of interest (typically the defect-related ΔT of 0.5–3°C) across the full dynamic range of the display.
Spatial filtering: Applying low-pass (smoothing) filters to remove high-frequency noise, median filters to remove salt-and-pepper noise from pixel dropouts, or high-pass filters to enhance edges and boundaries of thermal anomalies.
False-color mapping: Applying standardized color palettes (ironbow, rainbow, grayscale, or custom palettes) to represent temperature values. The choice of palette significantly affects the visibility of thermal anomalies. The ironbow palette is widely preferred because it provides good contrast across a range of temperatures and is intuitively interpreted (hot = white/yellow, cold = dark blue/black).
Mosaicking and georeferencing: Stitching individual thermal images into a continuous map of the deck surface, georeferenced to GIS coordinates for integration with bridge inventory systems and visual inspection data.
Distinguishing Defects from False Signals
A critical skill in IRT data interpretation is distinguishing true defect-related thermal anomalies from false signals caused by surface conditions. Common sources of false thermal anomalies include:
Source of False Signal
Thermal Signature
How to Distinguish from Real Defects
Surface moisture/standing water
Cold spots (evaporative cooling)
Check visual images; water has distinct appearance and evaporates over time
Oil stains, rubber deposits
Hot spots (different emissivity)
Visible in RGB images; typically at wheel path locations
Cracked or patched areas
Variable (depends on patch material and condition)
Correlate with visual images and chain drag
Shadows (structures, trees, bridge components)
Cold spots
Time-dependent (shadows move with sun angle); correlate with geometry
Surface texture variations (grooving, tining)
Minor temperature variations
Fine-scale pattern; typically uniform over the area
Joints and construction seams
Temperature discontinuity
Match with bridge plans and visible joint locations
Debris (leaves, trash, gravel)
Cold or hot spots (depending on material)
Visible in RGB images; typically small and irregular
Guardrails, expansion dams
Temperature gradients from thermal mass
Correlate with bridge hardware location
The FHWA emphasizes that IRT should be used in conjunction with other test methods for definitive defect identification. ASTM D4788 states that areas indicated as delaminated should be verified by other means such as chain drag, sounding, or core sampling before being scheduled for repair. Modern multi-sensor approaches combine IRT with ultrasonic tomography or impact-echo for verification.
Thermal Contrast Quantification
Quantifying the thermal contrast between defective and sound areas is essential for objective defect assessment. The most commonly used metrics are:
Absolute thermal contrast (ΔT): The temperature difference between the defective area (T_defect) and a reference sound area (T_sound). ΔT = T_defect − T_sound. Typical ΔT values of 0.5–3.0°C indicate probable delamination under good solar loading.
Normalized thermal contrast: ΔT normalized by the maximum temperature rise of the sound area, enabling comparison across different environmental conditions.
Signal-to-noise ratio (SNR): ΔT divided by the standard deviation of temperature in the sound reference area. SNR > 2–3 indicates a reliable detection.
Time-dependent contrast (for TLIRT): The evolution of ΔT over time, with the peak ΔT and the time-to-peak providing information about defect depth and severity.
Research by the Virginia Transportation Research Council established that a minimum ΔT of approximately 1.0°C provides a high probability of detection for bridge deck delaminations. Below 0.5°C, the thermal anomaly may be indistinguishable from noise or surface condition variations.
AI-Based Thermal Anomaly Detection
Deep Learning for IR Image Analysis
Artificial intelligence (AI) and deep learning have revolutionized IRT data analysis, enabling automated detection and classification of thermal anomalies with accuracy approaching or exceeding human expert performance. The integration of AI into IRT workflows addresses several limitations of manual analysis: it eliminates subjective interpretation, enables consistent defect identification across large datasets, reduces analysis time from hours to minutes, and can detect subtle thermal variations that may be missed by human operators.
Convolutional neural networks (CNNs) are the foundational architecture for thermal image analysis. CNNs learn hierarchical features from images — starting with simple edges and textures in early layers and progressing to complex defect patterns in deeper layers. For IRT bridge deck inspection, common CNN architectures include:
U-Net: An encoder-decoder architecture designed for semantic segmentation (pixel-level classification). U-Net has been successfully applied to segment delaminated areas from thermal images, producing pixel-accurate defect maps. The architecture’s skip connections preserve spatial detail, making it particularly effective for identifying the precise boundaries of thermal anomalies.
Faster R-CNN: A region-based CNN architecture for object detection (localizing defects within bounding boxes). Faster R-CNN approaches have achieved high precision in detecting cracks and delaminations in bridge components from thermal and visible imagery.
Transformer-based models: Recent advances have introduced Transformer architectures (originally developed for natural language processing) to computer vision tasks. The Grounding DINO model — a Transformer-based open-set object detection framework — has been applied to IRT bridge deck inspection by researchers at the University of Central Florida.
The UCF AI-Integrated IRT Framework
The University of Central Florida (UCF), in collaboration with NEXCO and West Nippon Expressway Company, developed and validated an AI-integrated bridge deck inspection framework that combines vehicle-mounted IR imaging, a Transformer-based detection model, and ultrasonic tomography. This framework, presented at NDT-CE 2025, represents the current state of the art in AI-IRT integration.
The UCF framework operates as follows:
Data acquisition: The Deck Top Scanning System (DTSS) captures IR data at speeds up to 70 mph over three Florida bridges, generating over 23,000 images under various environmental conditions (daytime, nighttime, different temperature ranges, and both bare and overlaid decks).
Label generation: Processed IR images are annotated by experts to identify defect areas. These annotations are mapped pixel-by-pixel to corresponding unprocessed (raw) IR images, creating a training dataset that enables the AI model to learn directly from raw data while benefiting from expert knowledge.
AI model training: The Grounding DINO Transformer-based model is trained on the labeled dataset for 100 epochs. The model integrates convolutional feature extraction with self-attention mechanisms, enabling it to detect subtle thermal variations characteristic of subsurface defects.
Detection performance: The model achieved 70% mean Average Precision (mAP@[0.5:0.95]) and 0.89 average Intersection over Union (IoU) on the test dataset, demonstrating tight alignment between predicted bounding boxes and ground truth. The model maintained high accuracy across varied conditions, including daytime and nighttime scans.
Ultrasonic Tomography (UT) validation: Areas flagged by the AI model are scanned using MIRA A1040 3D ultrasonic tomography for confirmed defect characterization, including depth and severity quantification. The UT device can detect delaminations under asphalt overlays up to 8 inches thick.
The UCF study demonstrated that the AI model exhibits a preference for over-detection over omission — producing some false positives but rarely missing actual defects. This is valuable for safety-critical infrastructure applications where missing a defect is more consequential than investigating a false positive.
Current Capabilities and Future Directions
Current AI-IRT systems offer:
Automated defect detection from raw IR images without extensive preprocessing
Real-time or near-real-time screening of thermal data during or immediately after survey
Consistent detection thresholds that eliminate subjective variation between human analysts
Integration with multi-sensor workflows where AI-flagged anomalies are verified by complementary NDT methods
Future developments in AI-IRT include:
Defect type classification distinguishing delamination from debonding, voids, moisture, and other anomaly types
Depth estimation from thermal contrast magnitude and temporal evolution using physics-informed neural networks
Defect severity assessment based on thermal signature characteristics correlated with destructive testing results
Temporal change detection comparing successive IRT surveys to track defect propagation and deterioration rates
Multi-modal fusion combining IRT with visual, LiDAR, GPR, and acoustic data for comprehensive condition assessment
Comparison with Other NDT Methods
Chain Drag and Hammer Sounding
Chain drag is the most traditional method for bridge deck delamination detection. The inspector drags a heavy chain across the deck surface while listening for changes in the acoustic response — a hollow or drum-like sound indicates a delamination, while a solid ringing sound indicates sound concrete. Hammer sounding (also called tap testing or percussion) uses a hammer or mallet to tap the surface at regular intervals.
Advantages of chain drag:
Low cost (only requires a chain and trained inspector)
Can be performed on any accessible deck surface
Immediate results (no data processing required)
Well-understood by inspection community
Disadvantages of chain drag:
Subjective — depends on inspector hearing and interpretation
Labor-intensive — requires walking the entire deck, typically 4–8 hours for a standard bridge
Traffic closure required — cannot be performed with traffic present
Ineffective on overlaid decks — asphalt overlays dampen the acoustic response
No permanent record — results are typically marked on the deck with spray paint
Fatigue — inspector concentration degrades over long surveys
Comparison studies have shown that chain drag is not more accurate or reliable than IRT for detection of shallow delaminations (ResearchGate: Comparison of NDT Methods for Assessment of a Concrete Bridge Deck). IRT typically identifies more potential delamination areas than chain drag, but some of these may be false positives requiring verification.
Impact-Echo
Impact-echo (IE) is an NDT method that uses mechanical impact (a small steel sphere or solenoid hammer) to generate stress waves in the concrete. The waves propagate through the deck, reflect off internal interfaces (delaminations, voids, the deck bottom), and are detected by a transducer on the surface. The frequency spectrum of the reflected waves reveals the depth of reflecting interfaces.
Advantages of impact-echo:
Provides defect depth information — can distinguish between surface, shallow, and deep delaminations
Works on overlaid decks — stress waves penetrate through asphalt overlays
Reliable — high probability of detection for delaminations
Disadvantages of impact-echo:
Slow — point-by-point testing; a full deck survey requires hours or days
Contact method — requires acoustic coupling between transducer and surface
Skilled interpretation required — frequency spectrum analysis requires training
Traffic closure required — cannot be performed with traffic present
The ASCE Journal of Bridge Engineering study comparing air-coupled impact-echo and IRT found that both methods effectively detect delaminations, but impact-echo provides depth information that IRT cannot. The combination of IRT for rapid screening and impact-echo for targeted verification is increasingly recommended.
Ground-Penetrating Radar
Ground-penetrating radar (GPR) uses high-frequency electromagnetic pulses (typically 1–2.5 GHz for bridge deck surveys) that penetrate the concrete and reflect off interfaces between materials with different dielectric properties. Delaminations, voids, moisture, and reinforcement create reflections that are recorded and interpreted.
Advantages of GPR:
Provides depth information — can estimate defect depth and reinforcement cover
Works on overlaid decks — penetrates asphalt up to 300 mm
Skilled interpretation required — complex data analysis requiring specialized training
Slower data processing — requires significant post-processing time
Limited delamination detection — thin delaminations may not produce clear reflections
Overlay sensitivity — asphalt overlays attenuate signal and reduce penetration
Higher equipment cost than IRT
A Transportation Research Record study comparing GPR, impact-echo, and IRT found that impact-echo was the most effective single method for evaluating bridge deck condition, but the combination of all three methods provided the most comprehensive assessment.
Method Comparison Summary
Property
IR Thermography
Chain Drag
Impact-Echo
GPR
Survey speed
Very fast (vehicle, 30 min per deck)
Slow (4–8 hours per deck)
Very slow (8–24 hours per deck)
Fast (vehicle, 30 min per deck)
Traffic closure required
No (vehicle-mounted)
Yes
Yes
No
Defect depth information
No (conventional); yes (TLIRT)
No
Yes
Yes
Works on overlaid decks
Yes (up to 100 mm)
No
Yes
Yes
Quantitative data output
Temperature map
Acoustic (subjective)
Frequency spectra
Radargram (dielectric)
Operator skill required
Moderate
Low
High
High
Equipment cost
Moderate ($20K–$80K)
Low (<$500)
Moderate ($30K–$60K)
High ($50K–$150K)
Permanent record
Yes (thermal images)
No (paint marks)
Yes (data files)
Yes (radargrams)
Environmental sensitivity
High (weather, time of day)
Low
Low
Low
Standard method
ASTM D4788
None (common practice)
ASTM C1383
ASTM D4748
The consensus among researchers and practitioners is that no single NDT method is optimal for all bridge deck inspection scenarios. The FHWA and state DOTs increasingly recommend a multi-method approach combining IRT for rapid wide-area screening with one or more complementary methods (impact-echo, GPR, or ultrasonic tomography) for targeted depth characterization and verification.
Standards and Regulatory Framework
ASTM D4788-03(2022)
The primary international standard for IRT bridge deck inspection is ASTM D4788-03(2022) — Standard Test Method for Detecting Delaminations in Bridge Decks Using Infrared Thermography. This standard was developed by ASTM Subcommittee D04.32 on Bridge Deck Inspection, which operates under the broader jurisdiction of ASTM Committee D04 on Road and Paving Materials.
Key provisions of ASTM D4788:
Scope (Section 1): The test method covers determination of delaminations in portland-cement concrete bridge decks, intended for use on exposed and overlaid concrete bridge decks. The standard notes that it can be used on asphalt or concrete overlays as thick as 4 inches (100 mm).
Significance and Use (Section 4): The method may be used in conjunction with other test methods to determine the general condition of a bridge deck. Areas indicated as delaminated on overlaid decks may indicate lack of bond between the overlay and the underlying deck. The method can be used to determine specific areas of delamination requiring repair.
Apparatus: The standard specifies use of an imaging infrared scanner and video recorder, mounted on a vehicle.
Precision and Bias: No precision and bias statement has been developed. The standard notes that it should not be used for acceptance or rejection of material for purchasing purposes.
The ASTM standard has been reaffirmed through multiple cycles (2003, 2007, 2013, 2022) with the current active version being D4788-03R22. The standard is published in ASTM Book of Standards Volume 04.03.
FHWA Guidelines
The Federal Highway Administration (FHWA) provides extensive guidance on IRT through its InfoTechnology (IT) portal for Infrared Thermography. The FHWA categorizes IRT as an NDE (Non-Destructive Evaluation) method applicable to:
Detection of delamination, overlay debonding, and voids in concrete decks and tunnels
Detection of debonding, voids, and stripping in asphalt pavements
The FHWA guidelines emphasize that IRT should be part of a comprehensive bridge management program, with results correlated with visual inspection, chain drag, impact-echo, and core sampling for definitive defect identification.
Additional Standards
AASHTO (American Association of State Highway and Transportation Officials) provides standards and provisional test methods relevant to IRT and complementary NDT methods:
AASHTO TP 36: Standard Test Method for Evaluating Asphalt-Covered Concrete Bridge Decks Using Pulsed Radar (complementary to IRT)
AASHTO T 260: Sampling and Testing for Chloride Ion in Concrete (for corrosion-related delamination assessment)
ICAO Annex 14 (Aerodromes, Volume I) specifies pavement surface condition requirements but does not mandate specific NDT methods. IRT is increasingly used for airport pavement evaluation as a non-traffic-disruptive screening tool for subsurface defects beneath runway and taxiway surfaces.
ISO 18434-1:2008 provides general guidelines for infrared thermography in condition monitoring of machinery, including principles that apply to infrastructure inspection.
Drone-Based IRT Inspection
UAV Platforms for Thermal Imaging
The integration of infrared thermography with unmanned aerial vehicles (UAVs) , commonly called drones, represents a significant advancement in bridge and pavement inspection capability. Drone-based IRT extends the reach of thermal inspection to bridge elements that are inaccessible to vehicle-mounted systems and difficult or dangerous for human inspectors to access.
Typical drone configurations for IRT inspection include:
Multi-rotor UAVs (quadcopters, hexacopters, octocopters) for maneuverability and hover capability
LWIR thermal camera payload with 640 × 512 resolution and 30 mK NETD
High-resolution RGB camera for visual context
GPS/RTK positioning for accurate georeferencing of thermal data
Real-time video transmission to the operator’s ground station
Obstacle detection and collision avoidance for safe operation near structures
Applications in Bridge Inspection
Drone-based IRT has been successfully demonstrated for:
Bridge deck soffit inspection: Thermal cameras on drones can inspect the underside (soffit) of bridge decks to detect delaminations and spalling that may not be visible from the top surface. This is particularly valuable for bridges where access from below is difficult (over water, highways, or deep valleys).
Vertical bridge elements: Drones can inspect bridge piers, abutments, retaining walls, and wing walls for thermal anomalies indicating subsurface defects. Research by the University of Nebraska demonstrated that drone-based thermography can detect delaminations on vertical and slanted concrete surfaces with reliability comparable to horizontal surface inspections.
Hard-to-reach areas: Drones provide access to bridge bearings, expansion joints, and girder ends that are typically inspected through visual inspection from aerial work platforms or under-bridge inspection vehicles.
Culvert and tunnel inspection: Drones with thermal cameras can inspect tunnel linings, culvert interiors, and confined spaces where human entry may be hazardous.
Regulatory Considerations
Drone-based IRT operations must comply with applicable aviation regulations:
United States (FAA Part 107): Commercial drone operations require Remote Pilot certification, aircraft registration, and adherence to operating rules including visual line of sight (VLOS), maximum altitude of 400 feet (120 m) above ground level, and no flight over people. Waivers are available for beyond visual line of sight (BVLOS) operations, nighttime flight, and flight over people for specific use cases.
Europe (EASA Regulation 2019/947): Operations are classified into three categories (Open, Specific, Certified) based on risk. Infrastructure inspection typically falls under the Specific category, requiring an operational authorization from the national aviation authority and a risk assessment per the Specific Operations Risk Assessment (SORA) methodology.
ICAO Annex 6, Part IV: Provides international standards for remotely piloted aircraft systems (RPAS) operations, including requirements for operator certification, airworthiness, and operational approvals for international operations.
Limitations of Drone-Based IRT
Flight endurance: Typical electric multi-rotor UAVs have 20–30 minute flight times, limiting area coverage per flight to 5–10 bridge decks or specific bridge elements.
Payload constraints: Thermal camera quality is limited by weight restrictions. High-performance cooled thermal cameras are typically too heavy for small UAVs.
Weather sensitivity: Drones cannot operate in rain, high winds (>20 km/h), or low visibility. Thermal performance is also degraded by the same environmental factors that affect ground-based IRT.
Regulatory limitations: VLOS requirement means an operator must maintain visual contact with the drone, limiting the inspection range.
Data processing: Drone-based IRT generates large volumes of thermal data that require significant post-processing for mosaicking, georeferencing, and analysis.
References
ASTM D4788-03(2022). Standard Test Method for Detecting Delaminations in Bridge Decks Using Infrared Thermography. ASTM International.
Federal Highway Administration. Infrared Thermography (IT) Bridge and Pavement InfoTechnology Portal. FHWA InfoTechnology.
Chase, S.B. & Anderson, C.M. (2020). Time-Lapse Infrared Thermography Applied to Concrete Bridge Deck Inspection Surveys. VTRC Report 20-R22. Virginia Transportation Research Council.
Usamentiaga, R., et al. (2014). Infrared Thermography for Temperature Measurement and Non-Destructive Testing. Sensors, 14(7), 12305-12348.
Alqurashi, I., et al. (2025). AI-Integrated Bridge Deck Inspection Using Infrared Imaging and Ultrasonic Tomography. NDT-CE 2025, Izmir, Türkiye.
Pozzer, S., et al. (2024). Passive infrared thermography for subsurface delamination detection in concrete structures. Construction and Building Materials, 417, 135393.
Tomita, K., et al. (2022). A Review of Infrared Thermography for Delamination Detection on Concrete Bridge Decks. Sensors, 22(2), 423.
Nebraska Department of Transportation. (2021). Early Detection of Near-Surface Void Defects in Concrete Pavement Using UAV-Mounted IRT and GPR. Report M082.
Nebraska Department of Transportation. (2020). Detecting Subsurface Voids in Roadways Using UAS with Infrared Thermography. ROSAP DOT 61030.
Raythink Technology. (2026). Passive vs. Active Thermography: How Thermal Cameras Enable Different Inspection Techniques.
Coleman, Z.W., et al. (2025). Investigation of Ground-Penetrating Radar, Impact Echo, and IR Thermography for Bridge Deck Evaluation. Transportation Research Record.
ASCE Journal of Bridge Engineering. (2012). Nondestructive Bridge Deck Testing with Air-Coupled Impact-Echo and Infrared Thermography. 17(6), 928-939.
International Civil Aviation Organization. Annex 14 — Aerodromes, Volume I: Aerodrome Design and Operations. 8th Edition, 2018.
ISO/TS 19159-1:2014. Geographic Information — Calibration and Validation of Remote Sensing Imagery Sensors and Data — Part 1: Optical Sensors.
Frequently Asked Questions
Infrared thermography (IRT) is a non-contact NDT method that uses thermal cameras to measure surface temperature variations on concrete structures. Delaminations and other subsurface defects act as thermal insulators that disrupt normal heat flow through the material. During solar heating (passive thermography), the air-filled gap of a delamination impedes heat conduction, causing the concrete above the defect to heat up faster than surrounding sound concrete. This creates a temperature differential of 0.5–3°C at the surface, which is captured by an infrared camera as a thermal anomaly — a hot spot during heating or a cold spot during cooling. ASTM D4788 standardizes this method for bridge deck inspection.
Passive thermography relies on naturally occurring temperature differences — typically from solar radiation (solar loading) or diurnal temperature cycles — to create thermal contrast between defective and sound areas. It is the most common approach for bridge deck and pavement inspection because it requires no external heat source and can cover large areas rapidly. Active thermography applies controlled external excitation — flash lamps, halogen lamps, hot air guns, or ultrasonic vibration — to induce thermal contrast. Active methods (pulsed thermography, lock-in thermography) are used when natural thermal gradients are insufficient, such as inspecting vertical surfaces, shaded areas, or structures with thick overlays.
IRT inspection systems typically consist of a long-wave infrared (LWIR) camera operating in the 7.5–14 µm spectral band with an uncooled microbolometer detector, thermal sensitivity (NETD) of 20–50 mK, and spatial resolution of 320×240 to 640×512 pixels. For bridge deck surveys, cameras are mounted on vehicles (deck-top scanning systems) or drones. Vehicle-mounted systems capture 15-foot swaths at speeds up to 70 mph. Drone-mounted IR cameras enable access to vertical bridge elements, soffits, and hard-to-reach areas. Some systems integrate visible-light cameras for data fusion and GPS/IMU units for georeferencing thermal anomalies.
The optimal time for passive IRT surveys is 5–9 hours after sunrise (peak heating period) or 3–5 hours after sunset (peak cooling period), per FHWA guidance. During peak solar heating, delaminated areas become hotter than sound concrete (positive thermal contrast). During nighttime cooling, delaminations retain heat longer and appear warmer than surrounding areas (inverse thermal contrast). Solar radiation levels should exceed 250 W-h/m² for reliable detection. Surveys are ineffective during overcast conditions, rain, high winds, or during winter months in northern climates where solar radiation is insufficient. The optimal survey window in temperate climates is typically 9:00 AM to 3:00 PM on clear, sunny days from late spring through early fall.
IRT offers the fastest survey speed — covering an entire bridge deck in 30 minutes compared to hours for chain drag or impact echo — and requires no traffic closure when vehicle-mounted. Chain drag is subjective, labor-intensive, and ineffective on overlaid decks. Impact echo provides depth information and works on overlays but requires point-by-point contact testing (slow). GPR provides depth data but requires skilled interpretation. IRT cannot determine defect depth or thickness and is sensitive to environmental conditions. The methods are complementary: IRT for rapid wide-area screening, and impact echo or ultrasonic tomography for targeted depth verification of flagged anomalies, as demonstrated in AI-integrated inspection frameworks.
The primary standard is ASTM D4788-03(2022) — Standard Test Method for Detecting Delaminations in Bridge Decks Using Infrared Thermography. This test method covers determination of delaminations in portland-cement concrete bridge decks and is applicable to exposed and overlaid decks (up to 4 inches/100 mm asphalt or concrete overlays). It specifies using an imaging infrared scanner and video recorder mounted on a vehicle. AASHTO provides complementary guidance for thermographic testing of pavements. The FHWA Infrared Thermography (IT) InfoTechnology portal provides best practice guidelines including optimal survey timing and data interpretation procedures. No precision and bias statement has been developed for D4788, so it is not recommended for acceptance/rejection of materials for purchasing.
Yes, drone-mounted IR cameras are increasingly used for bridge and pavement inspection. UAVs enable access to vertical surfaces (bridge piers, abutments, girders), deck soffits, and areas inaccessible to vehicle-mounted systems. Research by the University of Nebraska and others has demonstrated that drone-based thermography can detect delaminations on vertical and slanted concrete surfaces. Drones also enable inspection of culverts, tunnel linings, and pavement sections without traffic closure. Limitations include shorter flight times (20–30 minutes typical), payload constraints on camera quality, regulatory restrictions (beyond visual line of sight, altitude limits), and sensitivity to ambient conditions during flight.
AI-based thermal anomaly detection uses deep learning models — particularly Transformer-based architectures like Grounding DINO and convolutional neural networks (CNNs) — to automatically identify defects in IR images. The University of Central Florida developed a system combining vehicle-mounted IR imaging with a Transformer-based detection model achieving 70% mAP and 0.89 average IoU compared to processed IR ground truth. AI models detect subtle thermal variations that might be missed by human operators and can classify defect types. Machine learning is also used for thermal image segmentation, false positive reduction, and temporal analysis of time-lapse IR data. These methods significantly reduce the need for manual image preprocessing and accelerate the inspection workflow.
IRT detects subsurface defects that create a thermal barrier or alter heat flow. In concrete bridge decks: delaminations (horizontal separations within concrete), overlay debonding (loss of bond between overlay and structural deck), and voids. In pavements: debonding between asphalt layers, subsurface voids (from consolidation issues or culvert failures), and moisture accumulation. IRT reveals these as thermal anomalies — hot spots during heating, cold spots during cooling — but cannot directly determine defect type, depth, or severity without correlative testing. Time-lapse IRT with physics-based analysis can distinguish delamination from debonding and estimate depth through thermal diffusion modeling.
IRT has several limitations: (1) Environmental dependence — requires clear skies, adequate solar radiation (≥250 W-h/m²), and low wind speeds; ineffective in rain, fog, or overcast conditions. (2) Depth limitation — typically detects defects within 4–6 inches (100–150 mm) of the surface; deeper defects produce weaker thermal signals. (3) Overlay attenuation — asphalt or concrete overlays up to 4 inches reduce thermal contrast by 50% or more. (4) No depth information — conventional IRT cannot determine defect depth; time-lapse IRT can provide depth estimates. (5) Surface emissivity variations — oil stains, rubber deposits, moisture, and surface texture create false thermal anomalies. (6) Limited to surface temperature — IRT measures only surface temperature, not internal conditions directly.
Automate Your IRT Bridge Inspections
Combine infrared thermography with AI-driven analysis for rapid, accurate delamination detection on bridge decks and pavements. Deploy from vehicles or drones and get automated thermal anomaly reports with GIS integration.
Drone-based infrared thermography mounts thermal cameras on UAVs to rapidly survey bridge decks and pavements for delamination, debonding, and moisture from the...
Non-Destructive Testing (NDT) encompasses methods to evaluate material properties, detect defects, and assess structural condition without causing damage. For i...
27 min read
Infrastructure Inspection
NDT
+4
Cookie Consent We use cookies to enhance your browsing experience and analyze our traffic. See our privacy policy.