Inertial Profiler
A vehicle-mounted inertial profiler uses laser height sensors and accelerometers to measure longitudinal pavement profile at highway speeds, computing IRI and r...
27 min read
Pavement Testing
Pavement Smoothness
+2
Intelligent Compaction (IC) uses instrumented vibratory rollers with accelerometers, RTK GPS, infrared temperature sensors, and onboard displays to provide real-time continuous compaction quality data. IC maps roller passes, material stiffness via Compaction Meter Value (CMV) and vibratory modulus (Evib), and surface temperature for asphalt pavements. IC ensures uniform compaction density across 100% coverage area and identifies weak zones. Covers IC technologies, measurement values, FAA and FHWA specifications, and IC data for construction QA/QC.

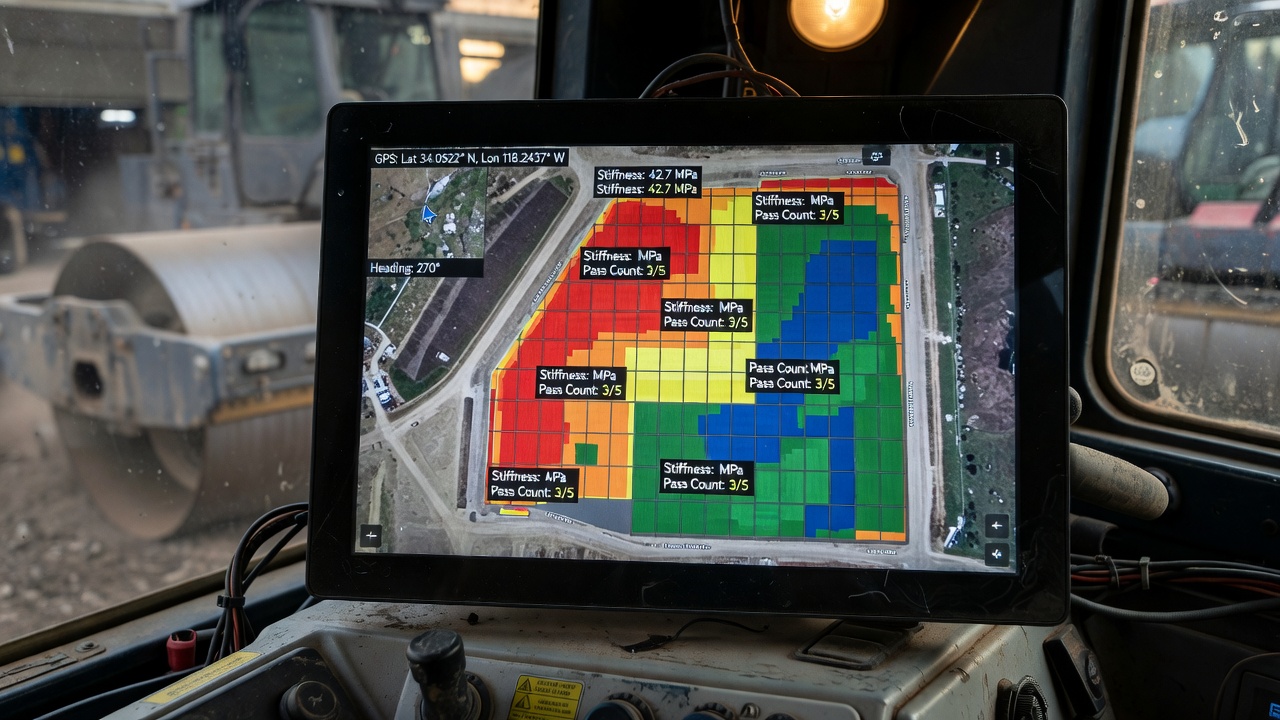
Intelligent Compaction (IC) is a vibratory roller-based technology that integrates instrumentation and real-time feedback systems to continuously measure, record, and display compaction quality during the rolling process. An IC roller is equipped with a triaxial accelerometer mounted on the vibrating drum axle, a Real-Time Kinematic (RTK) Global Navigation Satellite System (GNSS) receiver providing positioning accuracy of ±1 to ±3 cm (0.4 to 1.2 inches), infrared temperature sensors for asphalt compaction monitoring (range −20°C to 300°C with ±1°C accuracy at typical rolling temperatures), and an onboard computer display that shows real-time color-coded compaction maps to the operator.
The fundamental principle of intelligent compaction rests on the dynamic drum-ground interaction. As the vibratory roller operates, the accelerometer continuously records the vertical acceleration of the drum at a sampling rate of 200 to 500 Hz. When the ground is loose and soft, the drum behaves predominantly at the fundamental vibration frequency (the operating frequency set by the roller, typically 20 to 40 Hz or 1,200 to 2,400 vpm — vibrations per minute). As the ground stiffens through continued compaction, the drum response shifts energy into higher-order harmonics — the first harmonic at twice the operating frequency (2Ω), the second harmonic at three times the operating frequency (3Ω), and beyond. The ratio between these harmonic amplitudes and the fundamental amplitude forms the basis of most IC measurement values.
IC technology originated in Sweden in the 1970s when Geodynamik developed the first Continuous Compaction Control (CCC) system based on the harmonic ratio method. This concept was subsequently adopted in the United States through the FHWA IC Roadmap in 2004, developed by Horan and Ferregut. The Transportation Pooled Fund (TPF) study TPF-5(128), initiated in 2007 with 12 participating state DOTs (Georgia, Indiana, Kansas, Maryland, Minnesota, Mississippi, New York, North Dakota, Pennsylvania, Texas, Virginia, Wisconsin), significantly accelerated IC adoption in the US. In Europe, multiple countries including Austria, Germany, Finland, and Sweden developed their own IC standards in the 1990s, leading to the CEN European IC standard published in 2016.
IC systems are available as factory-installed original equipment manufacturer (OEM) systems from major roller manufacturers — including BOMAG (BCM-05 with Evib and Omega), Caterpillar (AcuGrade with MDP and CMV), HAMM (HCQ with Oscillometer Value OMV), Sakai (Aithon-MT with CCV), Dynapac (DCA with CMV), and Ammann/Case (ACE-Plus with ks and ACE measurements) — or as after-market retrofit systems from providers like MOBA (MCA-3000 with MCI and SineCore ER), Trimble (CB430 with CMV), and Topcon (RMS with IC measurement capability).
The FHWA classifies ICMVs into five levels based on their sophistication and capabilities. Level 1 ICMVs (such as CMV) are qualitative indicators based on harmonic ratios that provide relative stiffness information but cannot be directly converted to engineering units. Level 2 adds machine-specific calibration parameters. Level 3 ICMVs (such as Evib and ER) provide quantitative modulus values in physical units (MPa or MN/m²) by incorporating roller geometry, mass, eccentric moment, and vibration parameters into the calculation model. Levels 4 and 5 are research-level systems incorporating dual accelerometers, advanced dynamic models, and predictive algorithms.
The Compaction Meter Value (CMV) is the most widely implemented IC measurement value, originally developed by Geodynamik in the 1970s and used today by manufacturers including Dynapac, Caterpillar, and Trimble. CMV is a dimensionless index calculated from the acceleration amplitude spectrum of the vibrating drum:
CMV = C × (A₂Ω / A₁Ω)
Where:
CMV values typically range from 0 to 150, with higher values indicating stiffer, better-compacted material. A CMV of 0 indicates no measurable harmonic response (very loose material), while values above 100 indicate very stiff conditions approaching refusal. The measurement’s influence depth ranges from 0.5 to 1.6 m (1.6 to 5.0 ft) depending on roller operating weight (typically 10 to 18 tonnes), vibration frequency, vibration amplitude (low: 0.5 mm, high: 2.0 mm), and the stiffness of the compacted material. For a standard 12-tonne single-drum vibratory roller operating at 30 Hz (1,800 vpm) with high amplitude, the influence depth is approximately 1.0 m (3.3 ft) in granular material.
The CMV measurement is sensitive to several factors: roller speed should be maintained between 2 to 6 km/h (1.2 to 3.7 mph) for consistent readings; vibration amplitude affects the depth of measurement and the magnitude of harmonic response; material type influences the relationship between CMV and actual density (cohesive soils produce different CMV responses than granular materials); and moisture content affects compaction response and CMV readings.
Evib (vibratory modulus) is a Level 3 ICMV developed by BOMAG that provides a quantitative stiffness measurement in physical units of MN/m² (MPa) . Unlike CMV which reports a dimensionless index, Evib reports actual modulus values that can be directly compared with in-situ plate load test results (PLT modulus Ev₁ and Ev₂) and lightweight deflectometer (LWD) moduli.
Evib is derived from a one-degree-of-freedom (1-DOF) lumped parameter model that treats the drum-ground system as a spring-mass-dashpot system. The calculation incorporates:
The resulting Evib value represents the stiffness of the drum-ground system and is calibrated to provide values comparable to static plate load test moduli (Ev₁ and Ev₂) . Typical Evib values range from 10 to 80 MN/m² for soils, 30 to 120 MN/m² for base course aggregates, and 50 to 200 MN/m² for asphalt-treated or cement-treated materials. The EU IC specification (CEN, 2016) recommends that 80% of the compacted area must meet the target Evib value established during the calibration test strip.
Omega is BOMAG’s energy-based IC measurement value that preceded Evib. Unlike CMV which uses harmonic frequency ratios, Omega measures the mechanical energy transmitted from the drum into the ground during each vibration cycle. The underlying principle is that as the ground stiffens, a greater proportion of the drum’s impact energy is transmitted to the ground rather than being dissipated through drum bounce or rebound.
Omega values are calculated from the area under the force-displacement hysteresis loop measured at the drum-ground interface each vibration cycle. A loose, soft material absorbs energy through plastic deformation, resulting in a wide hysteresis loop and lower Omega values. A stiff, well-compacted material transmits energy more efficiently with less plastic deformation, resulting in a narrower loop and higher Omega values. This energy-based approach provides a direct physical measurement of compaction response that is less sensitive to harmonic artifacts than CMV in some soil conditions.
Machine Drive Power (MDP) is a fundamentally different IC measurement approach developed by Caterpillar for its roller models. Rather than analyzing drum acceleration harmonics, MDP measures the rolling resistance of the drum as it compacts the material.
MDP = P_actual − P_calibration
Where:
The difference represents the energy dissipated through compacting the ground material. A loose, soft material offers high rolling resistance because the drum sinks into and deforms the material, requiring more power to propel the roller forward. As the material stiffens through compaction, rolling resistance decreases, and less power is required. MDP values typically range from 1 to 150 (unitless index system), with lower values indicating stiffer, better-compacted materials — the inverse relationship compared to CMV and Evib.
MDP’s influence depth is approximately 30 to 60 cm (1 to 2 ft), shallower than CMV’s 0.5 to 1.6 m range. This makes MDP particularly well-suited for thinner lifts and asphalt layer compaction where the measurement should reflect the properties of the newly placed lift rather than the underlying layers. MDP works consistently across all material types — granular, cohesive, and asphalt — because it measures mechanical resistance rather than dynamic harmonic response.
| ICMV Type | Manufacturer | Measurement Principle | Units | Influence Depth | FHWA Level |
|---|---|---|---|---|---|
| CMV | Geodynamik/Dynapac/CAT/Trimble | Harmonic ratio (A₂Ω/A₁Ω) | Dimensionless (0–150) | 0.5–1.6 m | Level 1 |
| Evib | BOMAG | 1-DOF lumped parameter model | MN/m² (MPa) | 0.5–1.5 m | Level 3 |
| Omega | BOMAG | Energy dissipation hysteresis | Dimensionless | 0.5–1.5 m | Level 2 |
| MDP | Caterpillar | Rolling resistance power | Index (1–150) | 0.3–0.6 m | Level 2 |
| ks (stiffness) | Ammann/Case | 2-DOF spring-dashpot model | MN/m | 0.3–0.8 m | Level 2 |
| CCV | Sakai | Fundamental + sub-harmonic ratio | Dimensionless | 0.3–1.0 m | Level 1 |
| MCI | MOBA | Acceleration-based proprietary | Dimensionless | 0.5–1.5 m | Level 2 |
| ER | MOBA/SineCore | Resistance modulus (force/deformation) | MPa/m² | 0.5–1.6 m | Level 3 |
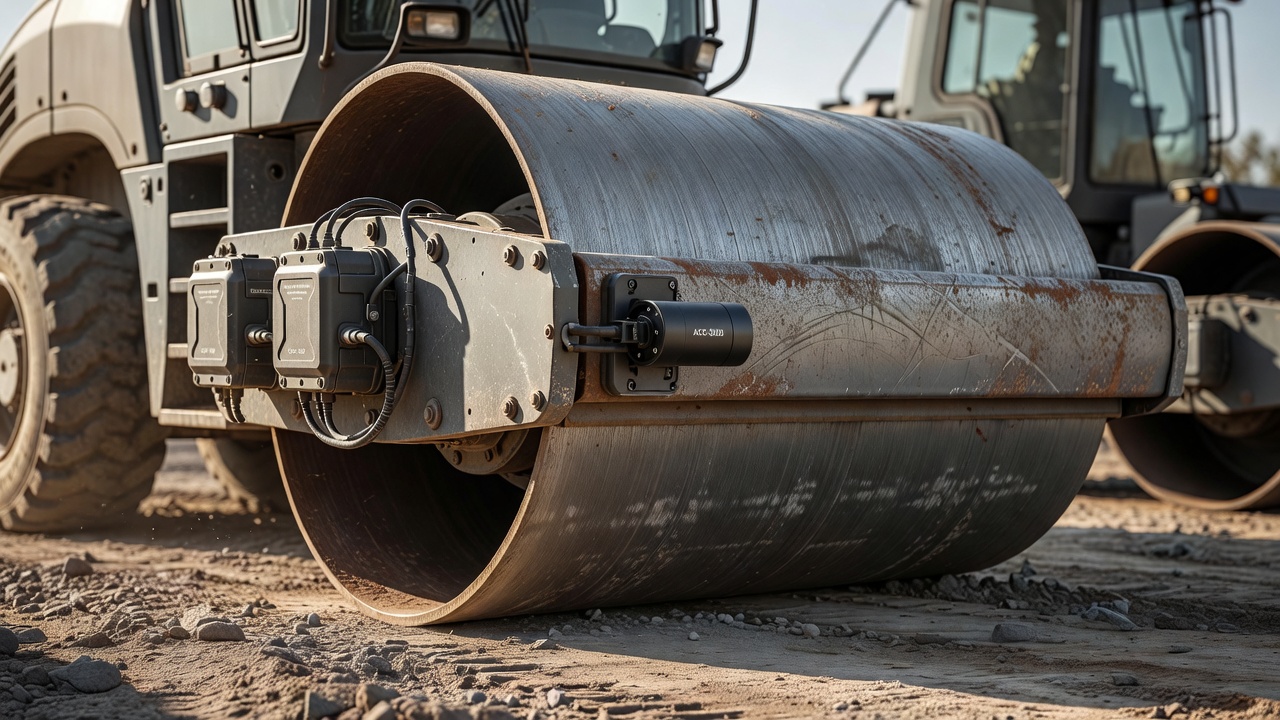
The accelerometer is the primary sensor in every IC system, mounted directly on the bearing housing of the vibrating drum axle to capture the most accurate representation of drum-ground interaction dynamics. IC systems use piezoelectric triaxial accelerometers that measure acceleration along three orthogonal axes: vertical (primary measurement axis), horizontal (forward), and transverse (lateral). The vertical axis signal — which records the drum’s rebound acceleration in response to ground stiffness — is the primary data source for ICMV calculation.
The accelerometer operates with a measurement range of ±50 g (where g = 9.81 m/s²) and a frequency response from 0 to 500 Hz. The acceleration signal is sampled at 200 to 500 Hz and processed through a Fast Fourier Transform (FFT) algorithm in the onboard computer to decompose the complex acceleration waveform into its constituent frequency components. The FFT output provides the amplitude spectrum showing the fundamental frequency (A₁Ω), the first harmonic (A₂Ω — twice the operating frequency), the second harmonic (A₃Ω — three times the operating frequency), and sub-harmonic components (Ω/2, Ω/3, etc.).
The accelerometer must be temperature-compensated to maintain accuracy across the construction temperature range (−10°C to +60°C for soils/base, and up to +180°C for asphalt compaction where radiant heat from the mat can heat the drum components). Accelerometer mounting brackets must be rigidly bolted to the drum bearing housing using high-strength fasteners to prevent resonant vibration of the mounting itself from contaminating the measurement signal — a common source of data quality issues on improperly installed retrofit systems.
Real-Time Kinematic (RTK) Global Navigation Satellite System (GNSS) positioning provides the spatial reference for IC data, enabling every measurement point to be mapped to a precise geographic coordinate. RTK GPS achieves horizontal accuracy of ±1 to ±3 cm (0.4 to 1.2 inches) and vertical accuracy of ±2 to ±5 cm (0.8 to 2.0 inches) using differential correction signals from a base station or CORS (Continuously Operating Reference Station) network.
The RTK GPS receiver is mounted on the roller cab roof at the highest point to maximize satellite visibility, with the antenna positioned directly above the drum’s centerline. The system tracks multiple satellite constellations — GPS (US), GLONASS (Russia), Galileo (Europe), and BeiDou (China) — to maintain positioning accuracy in challenging environments such as urban cuts, tree-lined corridors, and airport aprons with adjacent structures.
The RTK system operates through a base station (a fixed GPS receiver at a known surveyed coordinate) that transmits correction data to the rover receiver on the roller via radio link (typically 450 MHz UHF or 900 MHz spread spectrum) or cellular NTRIP (Networked Transport of RTCM via Internet Protocol). The base station must be established on a known geodetic survey monument or a point coordinated using static GPS survey methods. FAA specifications and AASHTO standards require daily GPS accuracy validation of the IC roller positioning system, with tolerance of ±6 to ±12 inches (AASHTO) or ±12 inches (FHWA) relative to known survey control points.
The GPS data stream is recorded at 1 to 10 Hz update rate and synchronized with the accelerometer data so that each ICMV reading is assigned a specific latitude, longitude, and elevation coordinate. The coordinate system is typically WGS 84 (World Geodetic System 1984) converted to the local UTM (Universal Transverse Mercator) zone for area calculations and mapping.
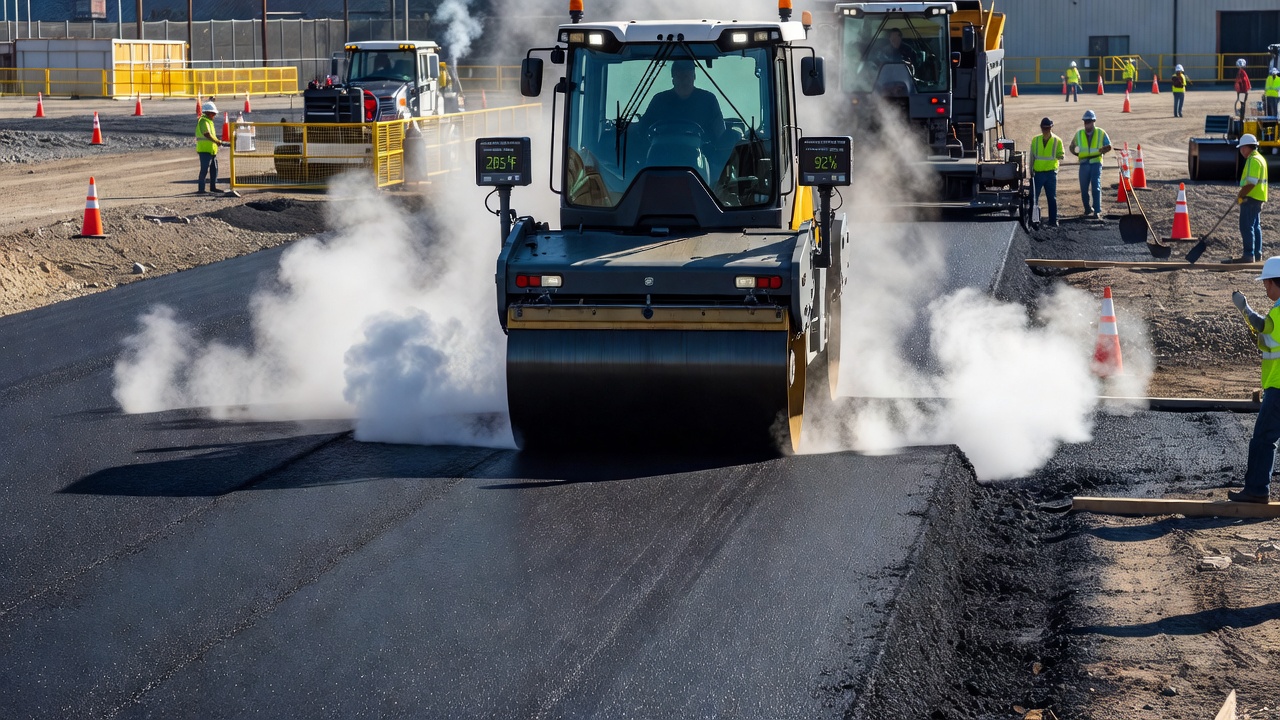
For asphalt compaction applications, IC rollers must be equipped with infrared (IR) temperature sensors that measure the surface temperature of the hot mix asphalt (HMA) mat during rolling. These sensors are mounted on the front and/or rear of the roller frame, positioned 30 to 50 cm (12 to 20 inches) above the mat surface, with the sensing beam aimed at the mat just behind the drum to measure the temperature of the compacted material rather than the material about to be compacted.
The IR sensors operate in the 8 to 14 μm wavelength band with a measurement range of −20°C to +300°C (−4°F to +572°F) and accuracy of ±1°C or ±1% of reading at typical compaction temperatures (80°C to 160°C / 176°F to 320°F). The sensor measures the surface temperature of the mat every 0.5 to 1.0 seconds, creating a continuous temperature profile across the compacted area. The IC display maps temperature using a color scale — typically red for temperatures at or above the target compaction window (above 120°C / 250°F for standard HMA), yellow for marginal temperatures, and blue for temperatures below the minimum rolling temperature (below 80°C / 176°F for standard HMA).
Temperature monitoring is critical for asphalt compaction because asphalt binder viscosity is temperature-dependent. Rolling must be completed while the mix is within its temperature compaction window — the range between the maximum rolling temperature (above which the mix is too tender and will shove under the roller) and the minimum rolling temperature (below which the binder is too viscous for further density gain). For conventional hot mix asphalt, the compaction window typically ranges from 80°C to 150°C (176°F to 302°F), depending on binder grade, lift thickness, ambient temperature, and wind conditions. FHWA IC specifications require the temperature sensor to be verified within ±5°F (2.8°C) accuracy before each project.
The onboard computer display is the operator interface for the IC system, typically a 7 to 10-inch (18 to 25 cm) touchscreen display mounted in the roller cab for easy visibility. The display provides:
The display runs proprietary onboard software — such as BOMAG BCM-05 Evolution, Caterpillar AcuGrade, Trimble CB430, Sakai Aithon-MT, MOBA MCA-3000, or Dynapac DCA — that processes sensor data, generates maps, and stores the IC data file for later analysis. The onboard computer typically has 32 to 64 GB of solid-state storage, sufficient for multiple projects of IC data before offloading.
Real-time compaction mapping is the defining feature of intelligent compaction that distinguishes it from conventional compaction. As the IC roller operates, the onboard system creates a continuous, color-coded map of the compacted area that updates every 0.5 to 1.0 seconds. The map is built from meter-wide measurement strips — each strip represents the width of the roller drum (typically 2.1 m / 7.0 ft for single-drum rollers and 1.5 to 2.0 m / 5 to 6.5 ft for double-drum asphalt rollers) recorded at the GPS update interval (1 to 10 Hz, producing a data point approximately every 10 to 30 cm (4 to 12 inches) along the roller path at typical operating speeds.
The mapping process begins with pre-mapping — the first roller pass that establishes baseline compaction conditions across the area. For subgrade evaluation, the pre-mapping pass is conducted before any compaction work to identify existing soft spots, buried utilities, or variable subgrade conditions. The baseline map shows the natural variability of the site and helps plan compaction strategy.
During production compaction, the map updates as the roller makes successive passes. The pass count map tracks the number of passes applied to each grid cell (typically 0.3 m × 0.3 m / 1 ft × 1 ft grid resolution). The operator uses this map to ensure complete coverage and uniform pass application — eliminating the skipped areas that commonly occur with conventional rolling where operators rely on visual reference marks and experience. The ICMV map updates with each pass to show the increasing stiffness values as compaction progresses.
The proof map — recorded during the final pass after achieving target compaction — provides the permanent quality record. The proof map displays the final ICMV values across the entire compacted area and is used for:
IC mapping data is stored in IC data files conforming to the AASHTO MP 39 standard file format — a comma-separated values (CSV) format with standardized column headers including: timestamp, latitude, longitude, elevation, speed, direction, pass count, CMV, Evib, temperature, vibration frequency, vibration amplitude, and roller ID. The data is typically recorded at 10 to 20 data points per square meter.
Compaction uniformity — achieving consistent density and stiffness across the entire compacted area — is arguably more critical to pavement performance than achieving high compaction in isolated locations. Non-uniform compaction produces differential support conditions under the pavement surface that lead to stress concentrations, differential settlement, fatigue cracking in high-stiffness transition zones, and premature pavement failure. A pavement section with uniform moderate compaction consistently outperforms a section with high average compaction but high variability (some areas very stiff, others soft) under equal traffic loading.
IC provides quantitative uniformity assessment through statistical analysis of the mapped ICMV data. The coefficient of variation (CoV) — calculated as the standard deviation divided by the mean ICMV — is the primary uniformity metric. The EU IC specification (CEN, 2016) recommends a maximum CoV of 20%, while Nazarian et al. (2020) proposed a threshold of 25% for acceptable foundation uniformity. Areas exceeding the CoV threshold are flagged for investigation and possible corrective action.
Semi-variogram analysis — a geostatistical method available in Veta software — provides advanced uniformity assessment by quantifying the spatial structure of ICMV variability. The semi-variogram plots the variance between data points as a function of the distance separating them, producing three key parameters: nugget (random variability at zero distance — measurement noise and microscale variability), sill (total variance of the dataset — the plateau value where spatial correlation ceases), and range (the distance over which data points remain correlated — a short range indicates high-frequency variability, while a long range indicates smoothly varying conditions). A well-compacted, uniform foundation produces a semi-variogram with a low nugget-to-sill ratio, indicating that most variability is spatially structured rather than random.
The pass count map is the primary tool for ensuring uniform compaction effort. By visualizing the number of passes applied to each grid cell, the operator can identify areas that have received fewer passes (typically at lane edges where the roller transitions, at the start and end of each rolling pass, and in areas where the rolling pattern was interrupted) and apply corrective passes before the proof map is recorded. The FHWA specification recommends that at least 90% of the compacted area must receive the target number of roller passes established during the calibration test strip.
Weak area identification is accomplished through percentile analysis of the ICMV distribution. The EU IC specification defines the threshold for weak areas as the 10th percentile ICMV value (mean ICMV minus 1.28 × standard deviation). Areas falling below this threshold are flagged for further investigation with conventional spot tests (lightweight deflectometer, nuclear density gauge, or dynamic cone penetrometer). For airport pavements, weak areas may require excavation and replacement or additional compaction with modified roller settings (higher amplitude, lower frequency, or additional passes).
IC can also detect over-compaction — the point at which additional roller passes no longer produce density gain and may actually degrade the material. The compaction curve (ICMV vs. pass number) shows a characteristic shape: rapid ICMV increase during initial passes, a plateau region of diminishing returns, and in some cases, a decrease in ICMV with additional passes due to material disturbance, soil structure breakdown, or aggregate degradation. IC operators observe the compaction curve on the onboard display and stop rolling when the curve plateaus — typically after 4 to 8 passes for granular base materials and 3 to 6 passes for asphalt.
Subgrade compaction with IC focuses on evaluating the natural foundation before pavement construction begins. The IC roller performs pre-mapping of the subgrade surface to identify variability in natural subgrade stiffness that would affect pavement performance. This pre-mapping pass is typically conducted at the roller’s lowest vibration amplitude to avoid over-compacting the subgrade and to maximize sensitivity to stiffness variations.
IC on subgrade identifies: soft spots (areas with ICMV values below the 10th percentile) that may indicate undocumented utility trenches, organic deposits, or wet clay pockets requiring excavation and replacement; variable moisture conditions (low ICMV areas associated with high moisture content); and buried features such as old pavement remnants, pipes, or boulders. The pre-map provides a foundation quality baseline that guides the design of subsequent base and pavement layers — if the subgrade is weaker or more variable than assumed in the pavement design, additional base thickness or subgrade improvement (lime treatment, cement stabilization, geogrid reinforcement) may be required.
The correlation between ICMV and subgrade CBR (California Bearing Ratio) can be established during the calibration test strip by conducting CBR tests or dynamic cone penetrometer tests in areas of low, medium, and high ICMV. The FHWA recommends achieving a correlation coefficient R ≥ 0.7 (R² ≥ 0.5) for the relationship between ICMV and the selected spot test. For subgrade applications, LWD modulus (ELWD) is the preferred spot test for correlation because it measures dynamic stiffness at similar loading rates and influence depths as the IC roller.
Base course compaction is the most common IC application because base course materials (crushed aggregate, cement-treated base, asphalt-treated base) are well-suited to vibratory roller compaction and the quality of base compaction directly governs pavement structural performance. The base course IC process follows the calibration strip methodology: a test section of the base material at the project’s specified lift thickness and moisture content is compacted with increasing roller passes, and spot tests (nuclear density gauge, LWD, sand cone) are conducted after each pass to establish the relationship between ICMV and material density or modulus.
The target ICMV for base course production is established from the calibration strip at the pass count that achieves 100% of maximum dry density (Standard Proctor, ASTM D698). During production, the IC operator uses the real-time display to ensure each lane receives the target number of passes and that the proof map shows ICMV values at or above the target with acceptable uniformity.
For cement-treated base (CTB) , IC provides the additional benefit of time management — the onboard display shows the elapsed time since mixing, and the operator can ensure that compaction is completed within the cement’s working time window (typically 2 to 3 hours from mixing to final compaction). Areas that exceed the working time cannot be adequately compacted and must be removed and replaced.
Base course lift thickness for IC operations must not exceed 150 mm (6 inches) in compacted thickness for granular materials and 200 mm (8 inches) for cement-treated base — consistent with conventional compaction requirements. Thicker lifts reduce the effectiveness of IC measurement because the drum’s influence may not penetrate to the bottom of the lift, and deeper material may remain uncompacted even when the surface shows adequate ICMV values.
Asphalt intelligent compaction requires additional system components and operational procedures beyond those for soil and base compaction. The IC roller must be equipped with infrared temperature sensors and must operate within the asphalt compaction temperature window — typically 80°C to 150°C (176°F to 302°F) for conventional hot mix asphalt. The operator uses the temperature map to identify areas where the mix has cooled below the minimum rolling temperature and cannot be further densified.
Asphalt IC addresses the critical problem of segregation and temperature differentials in the paver mat. When the hot mix asphalt is delivered to the site, the material temperature at the truck bed edges is typically 10°C to 30°C (18°F to 54°F) cooler than the center of the load. These cooler zones — if placed on the pavement by the paver — create areas that cool faster and cannot be compacted to target density. The IC temperature map clearly shows these cool zones as blue areas, enabling the roller operator to focus passes on these areas before they cool below the minimum rolling temperature.
Asphalt compaction patterns differ from soil/base patterns. Asphalt IC typically uses static passes (vibration off) for the initial breakdown pass to avoid aggregate degradation, followed by vibratory passes for densification, and finally static finish passes to smooth the surface. The MDP measurement is particularly useful for asphalt because its shallower influence depth (30 to 60 cm) primarily reflects the density of the newly placed lift rather than the underlying layers. The compaction curve for asphalt shows the characteristic plateau after 3 to 6 vibratory passes — additional passes beyond the plateau can reduce density by over-compacting the mix and pushing asphalt binder to the surface (fat bleeding).
Roller speed for asphalt IC must be maintained at 3 to 6 km/h (1.9 to 3.7 mph) — slower than typical soil compaction speeds — to provide sufficient vibration impacts per unit area and to prevent shoving the mat. The number of impacts per meter is calculated as: impacts per meter = vibration frequency (Hz) × 3.6 / roller speed (km/h). At 40 Hz vibration frequency and 5 km/h speed, the roller delivers approximately 29 impacts per meter — sufficient for uniform compaction without overworking the mix.
The US Federal Highway Administration (FHWA) developed comprehensive intelligent compaction specifications between 2012 and 2015 through the Transportation Pooled Fund study TPF-5(128). These specifications were designed to guide State Departments of Transportation (DOTs) in creating their own contract specifications for IC implementation. The FHWA specifications are published as:
In 2022, AASHTO published the following IC standards to formalize the technology nationwide:
The FHWA IC specification framework includes ten elements:
The Federal Aviation Administration (FAA) has not yet published a dedicated intelligent compaction specification in Advisory Circular AC 150/5370-10H (Standard Specifications for Construction of Airports). As of 2025, the FAA specification items for compaction — P-152 (Compaction Control) — still reference conventional compaction control methods including nuclear density gauge testing at one test per 750 m² (900 yd²), sand cone density testing, moisture content testing, test strip construction, and 100% of Standard Proctor maximum dry density for base layers.
However, the FAA recognizes intelligent compaction as an emerging technology for airport pavement construction. State highway IC specifications approved for use on airport projects have been accepted for non-primary airports (those with fewer than 10,000 annual enplanements not serving commercial carriers). For primary commercial service airports, IC can be used as a supplemental quality control tool but does not replace the required spot testing frequency specified in AC 150/5370-10H. The FAA Airport Technology Research and Development Branch has ongoing research evaluating IC for airport applications including correlation between ICMV and HWD (Heavy Weight Deflectometer) modulus on airfield pavements.
ICAO Doc 9157 (Aerodrome Design Manual, Part 3 — Pavements) does not specifically reference intelligent compaction technology but provides the general framework for compaction quality control in airport construction requiring uniform density across the full pavement width and density meeting the specified minimum.
European Union: The EU IC standard was developed through the Technical Committee TC3 of the International Society for Soil Mechanics and Geotechnical Engineering (ISSMGE) and published as the CEN European Standard in 2016. The EU specification requires: calibration of ICMV with in-situ tests, 80% of compacted area meeting target ICMV, 10th percentile threshold for weak area identification, and maximum CoV of 20% for acceptable uniformity.
China: The Chinese Railway and Road Administration published IC specifications from 2011 to 2016 requiring wireless data transfer and cloud-based data management — addressing data security and anti-tampering concerns.
Australia: The first Australian IC specification was published in 2020 by the Department of Transport and Main Roads (TMR) in Queensland, closely following US FHWA and AASHTO R 111 specifications.
IC data provides a permanent digital record of compaction quality that serves both construction quality assurance (QA) and pavement lifecycle management purposes. The IC data file — recorded in AASHTO MP 39 CSV format — contains the complete history of compaction operations for the project.
The essential IC data elements specified in AASHTO MP 39 include: timestamp (YYYY-MM-DD HH:MM:SS.SSS), latitude and longitude (WGS 84 decimal degrees), elevation (meters), speed (km/h), direction (compass heading), pass count (integer), CMV (dimensionless), Evib (MN/m²), temperature (°C or °F for asphalt), vibration frequency (Hz), vibration amplitude (mm), and roller ID (text string).
Veta (Visual Evaluation Tool for Compaction Analysis) is the standard IC data analysis software required by FHWA and AASHTO specifications. Developed by The Transtec Group for FHWA, Veta provides: color-coded ICMV map visualization with customizable color scales; statistical analysis including mean, median, standard deviation, coefficient of variation (CoV), percentile values, and histogram distribution; semi-variogram modeling with nugget, sill, and range parameters; compaction curve analysis showing ICMV vs. pass number; correlation analysis between ICMV and spot test results (LWD modulus, NDG density, DCP penetration rate); automated report generation; and data filtering to remove turn-around zones and acceleration/deceleration areas. Veta accepts IC data from all major IC system manufacturers.
IC data recorded during construction provides a baseline record for the pavement’s entire lifecycle. When the pavement is later evaluated for condition assessment, rehabilitation design, or forensic investigation, the IC data provides construction quality history showing as-constructed stiffness and uniformity of each layer — information permanently lost with conventional compaction methods. Weak areas identified in IC data (low ICMV zones) guide future maintenance priorities. Areas with high CoV at construction are at higher risk for differential performance. The IC data file, when archived with the project’s as-built documentation, provides the most comprehensive construction quality record available.
The most significant advantage of intelligent compaction over conventional spot testing is complete spatial coverage. Conventional compaction QC tests at one point per 750 m² — meaning less than 0.01% of the compacted area is actually tested. An IC roller with 2.1 m drum width operating at 4 km/h and recording data at 10 Hz provides approximately 10 to 20 data points per square meter, achieving near-100% coverage. This complete coverage is particularly valuable for detecting isolated weak areas that would be missed by spot testing — a soft spot 2 × 3 m in size has less than 0.5% probability of detection by a single conventional spot test but is clearly visible on an IC proof map.
IC provides immediate feedback to both the roller operator and the quality control inspector. The operator sees compaction results as they occur and can immediately adjust speed, vibration amplitude, frequency, pass count, and rolling pattern. The QC inspector can observe the IC display during rolling and flag problem areas for correction — rather than waiting 24 hours for laboratory density test results. This real-time capability eliminates construction delays associated with conventional QC and prevents the need to excavate failing areas that have already been covered by subsequent layers.
The IC data file provides a detailed, georeferenced, time-stamped record that is: objective (recorded by calibrated sensors, not subject to operator or inspector interpretation); comprehensive (covering the full compacted area); permanent (archivable indefinitely); verifiable (GPS coordinates and timestamps provide audit trail); and quantitative (numerical ICMV values for statistical analysis). For airport pavements with design lives of 20 to 40 years and rehabilitation costs of $5 to $20 million per runway, IC data provides an invaluable reference for future pavement evaluation.
IC reduces compaction QC costs through reduced spot testing (from one test per 500 m² to one per 2,000 m² for correlation and verification), reduced inspection labor (IC proof map provides documented evidence), elimination of rework (real-time feedback prevents over-rolling and under-rolling), and accelerated construction (eliminates 24-hour wait for density results). The IC retrofit cost ranges from $50,000 to $75,000 for after-market systems compared to $100,000 to $150,000 for factory-installed OEM systems. The break-even point is typically reached within 1 to 3 large construction projects.
Intelligent compaction data directly informs and improves future pavement inspection and evaluation programs. The IC proof map provides a spatially detailed baseline of as-constructed stiffness conditions that can be compared with future Falling Weight Deflectometer (FWD) or Heavy Weight Deflectometer (HWD) deflection surveys to identify structural deterioration over time. Areas showing low ICMV at construction and high HWD deflections later indicate progressive deterioration. Areas showing high ICMV at construction and low HWD moduli later suggest base degradation from water intrusion.
Drone-based pavement inspection using visible-spectrum and thermal imaging cameras can be combined with IC data for comprehensive evaluation. Thermal imaging detects moisture accumulation in IC-identified low-stiffness zones, subsurface voids (thermal anomalies due to air voids), and delamination between pavement layers. The baseline IC data provides historical context for interpreting these thermal anomalies.
The ICAO Airport Pavement Management System (APMS) framework — described in ICAO Doc 9157 — requires visual condition surveys (PCI per ASTM D5340), structural evaluation (FWD/HWD per ASTM D4694/4695), and destructive investigation (coring, DCP, materials testing). IC data provides the construction-quality baseline for structural evaluation, enabling pavement engineers to distinguish areas that were originally weak from areas that have deteriorated since construction.
For pavement forensic investigation — required when a pavement fails before its design life — IC data provides the most detailed evidence of construction quality. Forensic investigations seek IC data to determine whether failure was caused by construction deficiencies (low ICMV zones indicating inadequate compaction), design inadequacies (uniform failure across the entire section), or external factors (localized anomalies from utility cuts or drainage failures).
As ICAO continues developing standards for airport pavement management, digital construction records — including IC data — are increasingly incorporated in aerodrome certification documentation under ICAO Annex 14 (Aerodromes). IC technology continues to evolve with future developments including: Level 4 and Level 5 ICMV systems for layer-specific stiffness measurements; machine learning algorithms predicting target ICMV from material properties; automated roller guidance adjusting speed, vibration, and passes without operator input; real-time cloud synchronization for remote monitoring; and integration with 3D machine control for simultaneous grade and compaction control.
Intelligent Compaction data provides the most comprehensive quality record for pavement construction. Our drone-based pavement inspection and construction monitoring services help you leverage IC data for better QA/QC outcomes across airport, highway, and heavy civil projects.
A vehicle-mounted inertial profiler uses laser height sensors and accelerometers to measure longitudinal pavement profile at highway speeds, computing IRI and r...
The Superpave Gyratory Compactor (SGC) is a laboratory device that compacts hot mix asphalt specimens by applying 600 kPa vertical pressure combined with a gyra...
Roller-Compacted Concrete (RCC) is a zero-slump concrete placed with asphalt paving equipment and compacted with vibratory rollers, providing a strong, durable ...