What is Interpolation?
Interpolation – Estimation of Values Between Known Data Points
What is Interpolation?
Interpolation is a fundamental mathematical process used to estimate unknown values that fall between known data points. When a function or measurement is only available at discrete locations or times, interpolation provides a way to fill in the gaps, constructing a continuous curve or function that passes through the given points. Unlike guesswork, interpolation leverages the structure and trends present in the data, ensuring estimates are consistent with known values.
The simplest interpolation assumes a straight line between points (linear interpolation), but more sophisticated techniques, like polynomial or spline interpolation, allow for smooth curves or surfaces that better model real-world phenomena. Interpolation is crucial in engineering, scientific computing, geostatistics, computer graphics, and aviation, especially where direct measurement everywhere is impractical or impossible.
In aviation and environmental modeling, for example, the International Civil Aviation Organization (ICAO) requires accurate interpolation for weather data, emissions modeling, and regulatory reporting, ensuring that estimates of environmental variables are reliable and consistent.
Fundamental Concepts and Terminology
Data Points
Data points are the known values of a function, typically represented as pairs ((x_i, y_i)) in one dimension or as tuples in higher dimensions. The quality and spacing of these points greatly affect the reliability of interpolation. Closely spaced, accurate points yield better results, widely spaced or unevenly distributed data can cause large errors, especially with high-degree polynomials.
Interpolation vs. Extrapolation
- Interpolation estimates values within the domain of known data.
- Extrapolation estimates values outside the known data range and is generally less reliable, as it assumes data trends continue beyond available measurements.
This distinction is critical in regulatory contexts such as ICAO environmental modeling, where extrapolation is discouraged due to its unreliability.
Underlying Function
Interpolation presumes the data points are samples from a continuous, often smooth function (f(x)). The chosen interpolation method should align with the assumed smoothness and behavior of this function.
Order of Interpolation
The order or degree refers to the degree of polynomial used in interpolation:
- Linear (order 1)
- Quadratic (order 2)
- Cubic (order 3)
- Higher-degree polynomials
High-order interpolation can cause instability and oscillations (Runge’s phenomenon), especially with uneven data spacing.
Piecewise Interpolation
Rather than using a single global function, piecewise interpolation constructs low-degree polynomials between successive data points (e.g., splines), providing stability and local adaptability, which is especially important for irregular datasets.
Why Use Interpolation?
Interpolation is indispensable whenever continuous information must be reconstructed from discrete samples:
- Filling missing values in time series and sensor data
- Resampling and grid refinement in computational modeling
- Computer graphics and image processing for smooth curves and resizing
- Aviation and meteorology to estimate weather or environmental parameters (per ICAO guidance)
- Numerical integration and differentiation when analytic functions are not available
- Geosciences and mapping to create continuous surfaces from scattered measurements
Example:
An airport monitors air pollutant concentrations at several locations. If a sensor fails, interpolation (e.g., spline or IDW) estimates the missing value using nearby data, essential for maintaining a complete emissions inventory as required by ICAO.
Common Interpolation Methods
Linear Interpolation
Linear interpolation assumes a straight-line relationship between two data points:
[ y = y_0 + (x - x_0) \frac{y_1 - y_0}{x_1 - x_0} ]
Strengths: Simple, fast, no oscillations
Limitations: Not smooth at data points, poor for nonlinear behavior
Polynomial Interpolation
Fits a single polynomial of degree (n) through (n+1) points. Lagrange interpolation is the most common approach:
[ P(x) = \sum_{i=0}^{n} y_i \ell_i(x) ] with [ \ell_i(x) = \prod_{\substack{j=0 \ j \neq i}}^{n} \frac{x - x_j}{x_i - x_j} ]
Strengths: Smooth, exact fit
Limitations: Oscillates with high degree or uneven points (Runge’s phenomenon), sensitive to noise
Piecewise Polynomial Interpolation (Splines)
Piecewise Linear
Connects each pair of points with a straight line, simple but not smooth.
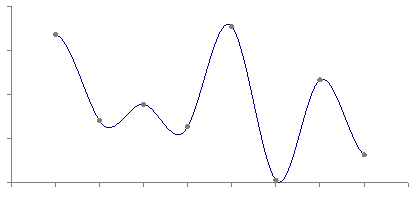
Cubic Spline
Fits cubic polynomials between each pair, ensuring continuity and smoothness of the curve and its first and second derivatives.
Advantages: Smooth, avoids oscillations
Applications: Graphics, aerodynamics, environmental modeling
Nearest-Neighbor and Inverse Distance Weighted (IDW) Interpolation
- Nearest-Neighbor: Assigns the value of the closest data point (stepwise, discontinuous)
- IDW: Weighted average based on inverse distance (good for scattered data, used in geostatistics and ICAO environmental mapping)
Higher-Order and Specialized Methods
- Hermite interpolation: Uses both function values and derivatives for more controlled, smooth curves
- Trigonometric (Fourier) interpolation: Ideal for periodic data
- Multidimensional methods: Bilinear, trilinear interpolation for 2D/3D data grids (e.g., images, weather models)
Worked Examples
Linear Example
Given points (2, 4) and (5, 10), estimate at (x = 3):
[ y = 4 + (3-2) \frac{10-4}{5-2} = 6 ]
Lagrange Polynomial Example
Given ((2, 1), (3, 5), (4, 13), (6, 61), (7, 125)), interpolate at (x = 5). Applying the Lagrange formula yields (y \approx 28.6).
Cubic Spline Example
Given ((0, 0), (1, 2), (2, 0)), fit a cubic spline and interpolate at (x = 1.5) using computational tools (e.g., SciPy).
Theoretical Considerations and Error
- Assumptions: The underlying function is smooth and continuous.
- Error: Linear interpolation error is (O(h^2)), spline interpolation is more accurate and stable, high-degree polynomial interpolation can be unstable.
- Runge’s phenomenon: Oscillations in high-degree polynomial interpolation.
- Interpolation vs. regression: Interpolation passes through all points, regression finds a best-fit curve.
Glossary of Key Terms
| Term | Definition |
|---|---|
| Data Points | Known values used as the basis for interpolation |
| Interpolation | Estimating unknown values within the range of known data |
| Extrapolation | Estimating values outside the range of known data |
| Linear Interpolation | Straight-line estimation between two points |
| Polynomial Interpolation | Uses a polynomial of degree (n) for (n+1) data points |
| Lagrange Interpolation | A formula for polynomial interpolation using Lagrange basis polynomials |
| Spline Interpolation | Piecewise polynomial interpolation for smooth curves |
| Nearest-Neighbor | Assigns the value of the closest known point |
| Inverse Distance Weighted | Weighted average, inversely proportional to distance from data points |
| Runge’s Phenomenon | Oscillations in high-degree polynomial interpolation |
Conclusion
Interpolation is a cornerstone of numerical analysis, data science, engineering, and aviation modeling. By providing mathematically rigorous estimates between known data points, it enables accurate analysis, modeling, and regulatory reporting in countless applications.
If you require robust, accurate interpolation methods for your projects, whether in engineering, environmental modeling, or aviation, contact us or schedule a demo to discover how our solutions can help.
Frequently Asked Questions
- What is the main purpose of interpolation in mathematics and engineering?
- Interpolation estimates unknown values within the range of known data points, enabling the reconstruction of continuous functions from discrete measurements. This is essential in fields like engineering, data science, aviation, and environmental modeling, where only sampled or measured data is available and continuous information is needed for analysis or regulatory compliance.
- How does interpolation differ from extrapolation?
- Interpolation estimates values within the range of existing data points, assuming the underlying trend continues smoothly between them. Extrapolation, in contrast, predicts values outside the known range, which is generally less reliable because it assumes trends extend beyond the data without support.
- What are the most commonly used interpolation methods?
- Common interpolation methods include linear interpolation (assumes constant change between points), polynomial interpolation (fits a single polynomial through all points, e.g., Lagrange method), piecewise polynomial or spline interpolation (fits smooth curves between points), and distance-weighted methods like inverse distance weighting (IDW).
- Why is spline interpolation often preferred over high-degree polynomial interpolation?
- Spline interpolation, particularly cubic splines, connects data points with piecewise cubic polynomials, ensuring smoothness and stability. High-degree polynomial interpolation can cause large oscillations (Runge's phenomenon) and is sensitive to data spacing, while splines avoid these issues and are more robust for complex datasets.
- When should I avoid interpolation?
- Interpolation should be avoided when the underlying function is highly discontinuous, contains sharp changes, or when data points are widely spaced and the behavior between them is unknown. Additionally, using interpolation for extrapolation outside the data range is risky and should be minimized, especially in safety-critical or regulatory contexts.
This is a reference entry. TarmacView provides drone inspection services and doesn't sell the equipment or materials described in this glossary.