Crack Segmentation
Crack segmentation is the computer vision task of classifying every pixel in an image as either crack or non-crack, producing a binary mask that enables precise...
32 min read
Computer Vision
Deep Learning
+2
Intersection Over Union (IoU), also called Jaccard Index, measures the overlap between a predicted segmentation mask and ground truth mask: IoU = |A∩B| / |A∪B|. It is the primary metric for crack segmentation accuracy, with IoU > 0.5 considered good. TarmacView’s DINOv3 crack segmentation head achieves test IoU 0.519. Covers IoU calculation, interpretation, relationship to Dice coefficient, and acceptable thresholds.
Intersection Over Union (IoU), also known as the Jaccard Index or Jaccard Similarity Coefficient, is a statistical measure that quantifies the overlap between two sets of data. In computer vision and image segmentation, IoU measures the accuracy of a predicted segmentation mask relative to the ground truth mask. It is the most widely adopted evaluation metric for semantic segmentation, instance segmentation, and object detection tasks across both academic benchmarks and industrial applications.
The formula for IoU is mathematically straightforward:
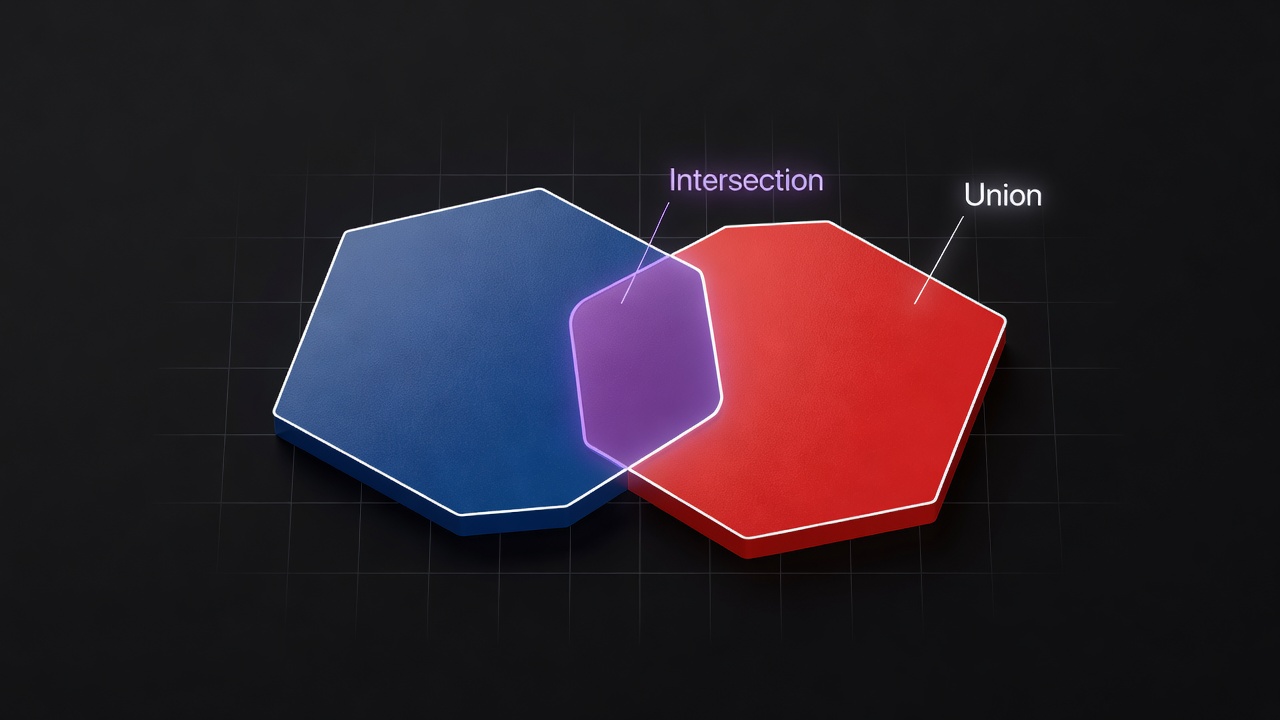
IoU = |A ∩ B| / |A ∪ B|
Where A represents the predicted segmentation mask (the set of pixels the model classifies as belonging to the object class) and B represents the ground truth mask (the set of pixels that human annotators have identified as belonging to the object class). The numerator, |A ∩ B|, is the intersection — the area (or pixel count) where the prediction and ground truth agree. The denominator, |A ∪ B|, is the union — the total area covered by either the prediction or the ground truth or both.
{
Expanding the formula in terms of the confusion matrix elements — true positives (TP), false positives (FP), and false negatives (FN) — provides a more practical formulation for computation:
IoU = TP / (TP + FP + FN)
Here, TP (true positives) are the pixels correctly classified as belonging to the object class (the intersection area). FP (false positives) are the pixels incorrectly predicted as object when they are actually background (the prediction area outside the ground truth). FN (false negatives) are the pixels incorrectly predicted as background when they are actually object (the ground truth area outside the prediction). This formulation makes explicit that IoU penalizes both over-prediction and under-prediction equally — every false positive and every false negative reduces the metric by the same amount, normalized by the total relevant area.
The IoU value always falls within the closed interval [0, 1]. An IoU of 0 indicates that the predicted and ground truth masks have zero overlap — they are completely disjoint. An IoU of 1 indicates perfect overlap — the predicted mask exactly matches the ground truth mask pixel-for-pixel. Intermediate values represent partial overlap quality. For example, an IoU of 0.5 means that the intersection area is half the size of the union area, which is the standard minimum threshold for considering a detection or segmentation as correct in the Pascal VOC benchmark.
IoU is scale-invariant in the sense that it measures relative overlap rather than absolute pixel counts. A 100-pixel object and a 10,000-pixel object both produce an IoU of 1.0 when perfectly segmented. However, this scale invariance has a practical caveat: for the same absolute pixel error (e.g., 5 misclassified boundary pixels), a small object experiences a much larger relative drop in IoU than a large object, making IoU implicitly more stringent for fine detail and small structures.
The metric originates from the Jaccard Index (also called Intersection over Union) introduced by Paul Jaccard in 1901 as a coefficient of community for comparing species distributions in alpine flora. Its application to computer vision was formalized in the Pascal Visual Object Classes (VOC) Challenge (2007-2012), which established IoU as the standard evaluation metric for object detection and segmentation. The Common Objects in Context (COCO) dataset and benchmark, released by Microsoft in 2014, further cemented IoU as the de facto standard by introducing mAP@[0.5:0.95], the average of mean Average Precision computed across ten discrete IoU thresholds from 0.5 to 0.95.
Visual interpretation of IoU is essential for developing an intuitive understanding of what different IoU scores actually represent in terms of segmentation quality. The metric maps a complex spatial relationship between two masks into a single scalar value, and internalizing how different spatial error patterns affect that value is critical for both model development and results communication.
An IoU of 1.0 represents perfect pixel-for-pixel alignment. In the context of crack segmentation on airport pavements, a perfect IoU means every pixel the model classified as “crack” exactly matches every pixel a trained inspector marked as “crack,” and no pixels were missed or over-predicted. In practice, perfect IoU is essentially unattainable for real-world infrastructure inspection due to annotation ambiguity — different human annotators marking the same crack on the same image typically achieve an inter-annotator IoU of only 0.65-0.85, depending on crack width and contrast. This annotation noise ceiling represents the maximum achievable IoU for any model on that dataset.
An IoU of 0.75-0.90 indicates excellent segmentation quality. At this level, the predicted mask closely follows the ground truth boundary with only minor deviations of 1-3 pixels at the edges. For crack segmentation, this corresponds to correct detection of the crack’s full path with slight differences in predicted crack thickness compared to the ground truth annotation. On the COCO benchmark, an AP75 (Average Precision at IoU threshold 0.75) is considered a strong indicator of precise localization capability.
An IoU of 0.50-0.75 indicates good segmentation quality. The model correctly identifies the location and general shape of the object, but boundary accuracy is moderate. For pavement crack detection, an IoU in this range means the model reliably finds the crack (high true positive rate) but may predict the crack as somewhat thicker or thinner than the ground truth, or may have minor fragmentation where a continuous crack is predicted as short disconnected segments. This is the typical operating range for production crack segmentation systems operating on real airport pavement imagery, where TarmacView’s DINOv3-based model achieves a test IoU of 0.519.
{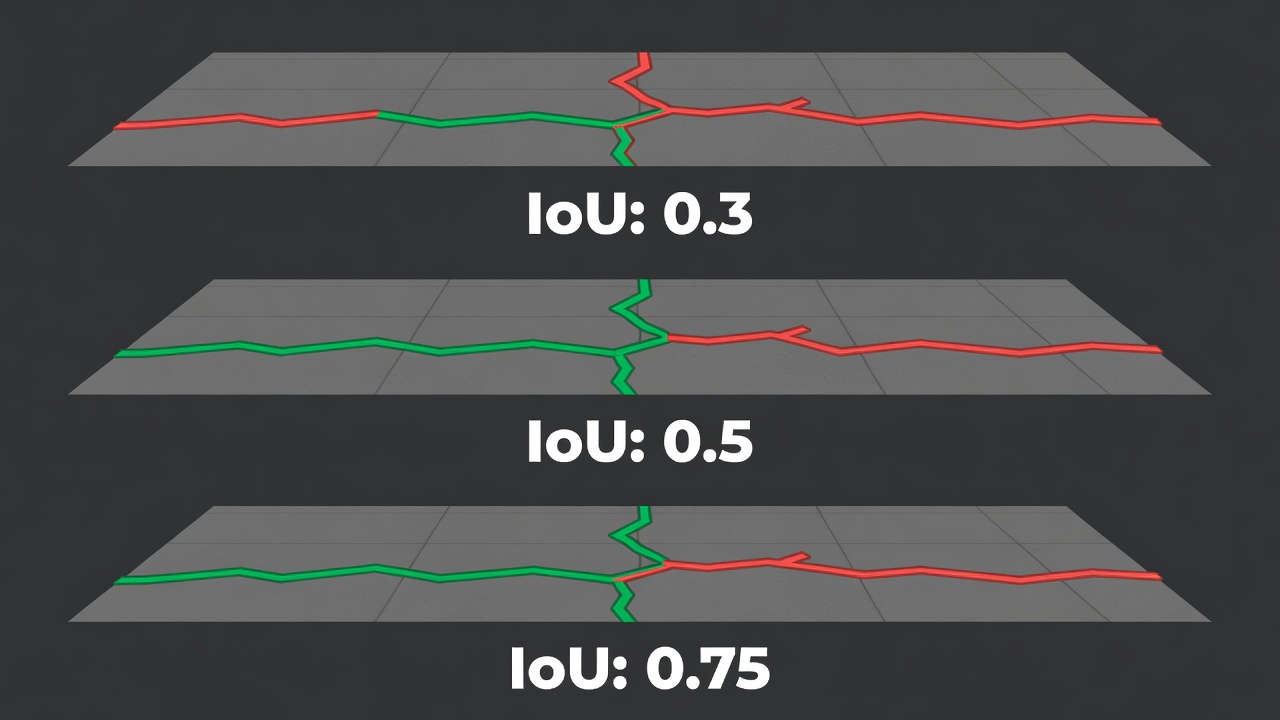
An IoU of 0.30-0.50 indicates marginal segmentation quality. The model detects the presence of the object but with significant localization errors. The predicted mask may be displaced, incorrectly shaped, or substantially different in size from the ground truth. In pavement crack detection, this could mean the model identifies general crack-affected regions but fails to precisely follow crack geometry, predicting blobs rather than linear features. An IoU below 0.5 is generally not considered a successful detection or segmentation under the Pascal VOC standard.
An IoU of 0-0.30 indicates poor segmentation. The model either fails to detect the object entirely (predicted mask is empty, producing IoU=0) or produces a mask that overlaps the ground truth only incidentally at the edges of a much larger mispredicted region. In the context of infrastructure inspection, models operating at this IoU level would miss critical defects or produce so many false positives that the output is not operationally useful.
A crucial insight for visual interpretation is that IoU is non-linear in perceptual quality. The difference between IoU=0.90 and IoU=0.95 represents a much smaller actual improvement in pixel accuracy than the difference between IoU=0.50 and IoU=0.55. This is because at high IoU levels, the union is already very close to the intersection, so further improvements require increasingly precise boundary alignment. Conversely, at low to moderate IoU, relatively large improvements in segmentation quality are needed to move the metric by a few percentage points.
Calculating IoU for segmentation masks requires a systematic approach that handles the specifics of mask representation, coordinate systems, and edge cases.
For bounding box-based predictions (used in object detection or as region proposals), IoU is calculated using the axis-aligned rectangle coordinates. Each box is defined by its top-left corner (x₁, y₁) and bottom-right corner (x₂, y₂). The intersection rectangle is computed as:
x_left   = max(pred_x₁, gt_x₁)
y_top    = max(pred_y₁, gt_y₁)
x_right  = min(pred_x₂, gt_x₂)
y_bottom = min(pred_y₂, gt_y₂)
The intersection area is:
intersection = max(0, x_right - x_left) × max(0, y_bottom - y_top)
The max(0, …) operation is critical — if the boxes do not overlap in either dimension, the negative value is clamped to zero, correctly yielding zero intersection area. The area of each bounding box is:
area_pred = (pred_x₂ - pred_x₁) × (pred_y₂ - pred_y₁)
area_gt   = (gt_x₂ - gt_x₁) × (gt_y₂ - gt_y₁)
The union is then:
union = area_pred + area_gt - intersection
And finally:
IoU = intersection / union
For pixel-level segmentation masks, IoU is computed by treating each mask as a binary image where pixel value 1 indicates the object class and pixel value 0 indicates background. The calculation proceeds via element-wise logical operations:
intersection = sum(pred_mask AND gt_mask)   // pixel-wise logical AND
union = sum(pred_mask OR gt_mask)           // pixel-wise logical OR
IoU = intersection / union
In practice, implementations using NumPy or PyTorch vectorize this as:
import torch

def compute_iou(pred_mask: torch.Tensor, gt_mask: torch.Tensor) -> float:
    """
    pred_mask and gt_mask are binary tensors of shape (H, W)
    with values 0 (background) or 1 (object)
    """
    intersection = (pred_mask & gt_mask).sum().item()
    union = (pred_mask | gt_mask).sum().item()
    if union == 0:
        return float('nan')  # both masks empty
    return intersection / union
The union == 0 edge case occurs when both the prediction and ground truth are empty — neither mask contains any object pixels. In this degenerate case, the metric returns NaN, and different benchmarks handle this differently. The COCO evaluation protocol excludes such cases from the mean. The PyTorch Lightning MeanIoU implementation returns -1.0 for classes that are completely absent from both prediction and ground truth.
For multi-class segmentation (e.g., a model that simultaneously predicts crack, sealant, pavement, and joint classes), IoU is computed per class and then averaged. For each class c, a binary mask is constructed where pixel (i,j) is 1 if the predicted or ground truth class equals c, and 0 otherwise. The per-class IoU is:
IoU_c = TP_c / (TP_c + FP_c + FN_c)
For a segmentation problem with C classes, the Mean IoU (mIoU) is:
mIoU = (1/C) × Σℂ=1…C IoU_c
An important consideration is whether to include the background class (pixels belonging to no object) in the mIoU calculation. Including background typically inflates mIoU because background dominates the pixel count and segmentation models usually perform well on it. Excluding background gives a more honest assessment of object segmentation quality. The include_background parameter in TorchMetrics’ MeanIoU implementation controls this behavior.
An alternative to mIoU is Frequency Weighted IoU (FWIoU), which weights each class’s IoU by its frequency in the ground truth:
FWIoU = (1/Σℂ n_c) × Σℂ n_c × IoU_c
where n_c is the number of ground truth pixels belonging to class c. FWIoU gives more weight to larger classes and less to rare classes. For crack segmentation on pavements where crack pixels constitute less than 1 percent of the total, FWIoU would obscure crack performance behind pavement performance. mIoU (unweighted mean) is strongly preferred for infrastructure inspection because it treats the rare but critical defect classes equally with the majority classes.
When IoU is used as a training loss function (differentiable IoU variants), numerical precision becomes important. Standard IoU is not differentiable because the binary logical operations (AND, OR, SUM) have zero gradients everywhere except at the threshold, where the gradient is undefined. Differentiable surrogates — soft IoU or IoU loss — use continuous approximations:
soft_IoU = Σ(p_i × g_i) / Σ(p_i + g_i - p_i × g_i)
where p_i ∈ [0,1] is the softmax probability for pixel i and g_i ∈ {0,1} is the ground truth label. The product p_i × g_i is a continuous relaxation of the logical AND, and the sum p_i + g_i - p_i × g_i is a continuous relaxation of the logical OR.
For evaluation (non-differentiable), the binarized masks with a threshold (typically 0.5 on the softmax probability) are used. The binary cross-entropy loss remains the standard training objective for most crack segmentation models, with IoU serving as the evaluation metric computed post-hoc.
The Dice Similarity Coefficient (DSC), also called the Sørensen-Dice index and equivalent to the F1-score for binary segmentation, is the most common alternative to IoU for segmentation evaluation. Understanding the relationship between these two metrics is essential for correct interpretation of segmentation accuracy.
The Dice Coefficient is defined as:
DSC = 2|A ∩ B| / (|A| + |B|)
In terms of confusion matrix elements:
DSC = 2TP / (2TP + FP + FN)
The mathematical relationship between DSC and IoU is bijective and monotonic:
DSC = 2 × IoU / (1 + IoU)
IoU = DSC / (2 - DSC)
This means that for any given segmentation, DSC can be computed directly from IoU and vice versa. The conversion is exact and deterministic — there is no information loss in converting between the two metrics.
Despite the exact mathematical relationship, DSC and IoU differ systematically in their numerical values and interpretation. The key properties are:
DSC ≥ IoU for all imperfect segmentations. The inequality is strict except at DSC = IoU = 1 (perfect) and DSC = IoU = 0 (no overlap). This is because the denominator in DSC adds TP twice (2TP + FP + FN) while IoU adds TP only once (TP + FP + FN), making DSC’s denominator smaller relative to its numerator. For example, a segmentation with TP=80, FP=20, FN=20 yields:
DSC is more “optimistic.” For the same segmentation quality, DSC reports a higher numerical value than IoU. The relative gap is largest at moderate overlap levels and converges at both extremes. A segmentation with IoU=0.5 corresponds to DSC=0.667. A segmentation with IoU=0.75 corresponds to DSC=0.857.
IoU is stricter on false positives and false negatives. Because IoU’s denominator includes TP only once while DSC double-counts TP, IoU penalizes every FP and FN more heavily relative to the correct overlap. This makes IoU more sensitive to over-segmentation and under-segmentation errors.
DSC emphasizes overlap maximization. The extra weight on TP means that DSC rewards maximizing the intersection area even at the cost of slightly increasing the union. This makes DSC preferable when the primary goal is to ensure the predicted region covers as much of the ground truth as possible, at the expense of some over-prediction.
The choice between IoU and DSC depends on the application requirements:
| Criterion | Prefer IoU | Prefer DSC |
|---|---|---|
| Penalizing over-/under-segmentation | ✓ Stricter | — More lenient |
| Small object segmentation | — More sensitive to errors | ✓ Less harsh penalty |
| Boundary accuracy assessment | ✓ Better reflects errors | — Masks boundary issues |
| Standard benchmark comparison | ✓ Pascal VOC, COCO standard | — Medical imaging standard |
| Training loss function | — Not differentiable | ✓ Differentiable surrogate |
| Communication to non-technical stakeholders | — Can seem harsh | ✓ More intuitive values |
For infrastructure inspection and crack segmentation, IoU is the preferred primary metric because it provides a stricter, more honest assessment of segmentation quality. A model that over-predicts crack width (producing FP crack pixels at edges) will have its IoU penalized more than its DSC, and this stricter penalty correctly reflects the operational requirement that crack detection must be spatially precise — over-predicting crack area leads to unnecessary maintenance costs, while under-predicting leads to missed defects.
TarmacView reports IoU as the primary crack segmentation accuracy metric, with the DINOv3-based model achieving a test IoU of 0.519 on held-out airfield pavement imagery. This is complemented by reporting precision, recall, and Dice coefficient for a comprehensive evaluation picture.
IoU thresholds define the minimum overlap required for a prediction to be considered a true positive (correct detection). The choice of threshold has profound implications for reported model performance and determines whether a segmentation system is evaluated as lenient or strict.
The Pascal VOC challenge established IoU ≥ 0.5 as the threshold for considering a detection or segmentation as correct. This threshold, denoted as AP50 (Average Precision at IoU=0.5), became the default in computer vision for over a decade. The reasoning was pragmatic: a predicted region that overlaps more than half of the ground truth is clearly detecting the correct object, even if its boundaries are imperfect.
For crack segmentation on pavements, an IoU threshold of 0.5 means that a predicted crack mask must overlap at least 50 percent of the ground truth crack area to count as a correct detection. Given that cracks are thin, elongated structures, this threshold requires that the model capture the crack’s full path with reasonable thickness accuracy. It is the standard threshold used in academic publications on pavement crack detection and in TarmacView’s internal evaluation pipeline.
The COCO benchmark introduced a more rigorous evaluation protocol, averaging Average Precision over ten IoU thresholds from 0.5 to 0.95 in steps of 0.05, denoted as AP@[0.5:0.95] or simply mAP. This multi-threshold approach provides a more comprehensive assessment of localization quality than any single threshold can.
For infrastructure inspection, the COCO-style evaluation is particularly informative because it reveals how a model performs across precision requirements. A model with high AP50 but low AP75 may detect cracks reliably but predict them with poor boundary accuracy — systematically overestimating or underestimating crack width. A model with strong AP75 demonstrates precise boundary alignment, which is critical for applications requiring accurate crack width measurement (a key input to Pavement Condition Index - PCI calculations per ASTM D5340 and FAA AC 150/5380-6C).
The AP75 metric (Average Precision at IoU=0.75) evaluates a model’s ability to produce predictions with tight boundary alignment. For crack segmentation, AP75 requires that the predicted crack mask overlaps the ground truth by at least 75 percent — demanding that the model capture both the crack path and its thickness with high accuracy.
AP75 is the relevant threshold for applications requiring crack width quantification rather than mere crack presence detection. Runway pavement condition assessment per ICAO standards and FAA Advisory Circulars often requires crack width classification (hairline < 3mm, medium 3-6mm, severe > 6mm), and accurate width measurement requires precise boundary segmentation. A model degraded at AP75 may correctly locate cracks but over- or under-estimate their severity.
| IoU Threshold | Standard | Interpretation for Crack Segmentation |
|---|---|---|
| 0.30 | Minimum useful overlap | Marginal detection; crack location approximately correct, but shape/thickness inaccurate |
| 0.50 | Pascal VOC (AP50) | Standard detection; crack path and approximate thickness correct |
| 0.75 | COCO strict (AP75) | Precise segmentation; crack boundaries closely match ground truth within 1-3 pixels |
| 0.50:0.95 | COCO primary (mAP) | Comprehensive evaluation across all precision levels |
While not a formal benchmark standard, IoU=0.3 is sometimes used as a lenient detection threshold in noisy or ambiguous annotation contexts. For pavement cracks, human inter-annotator agreement on individual crack pixels rarely exceeds IoU=0.65-0.85 for well-defined cracks and can drop to IoU=0.30-0.50 for hairline cracks on textured asphalt surfaces. In these cases, the inherent annotation uncertainty sets a practical floor on what IoU value constitutes meaningful detection.
An IoU threshold of 0.3 for crack segmentation indicates that the model has correctly identified the approximate location of a crack but with substantial shape, thickness, or continuity errors. This may be acceptable for coarse defect screening (flagging “possible crack — verify manually”) but is insufficient for automated severity assessment.
Mean Intersection over Union (mIoU) extends the single-class IoU metric to multi-class segmentation problems by computing the arithmetic mean of per-class IoU scores. This is the standard evaluation metric for semantic segmentation across all major benchmarks.
For a segmentation task with C classes, mIoU is computed as:
mIoU = (1/C) × Σℂ=1…C IoU_c
where IoU_c is the Intersection over Union for class c, computed by treating class c as the positive class and all other classes as negative (one-vs-rest).
The per-class IoU calculation for class c uses:
The confusion matrix for a C-class segmentation problem is a C×C matrix where M_ij is the count of pixels belonging to ground truth class i that were predicted as class j. Per-class IoU is then:
IoU_i = M_ii / (Σj M_ij + Σj M_ji - M_ii)
The numerator M_ii (diagonal element) is the true positives for class i. The sum over the row Σj M_ij is the total ground truth area for class i (TP + FN). The sum over the column Σj M_ji is the total prediction area for class i (TP + FP).
For airport pavement crack segmentation, a typical multi-class segmentation problem includes:
Each class has its own IoU score. For TarmacView’s evaluation on airfield pavement datasets, the per-class IoU scores demonstrate the relative difficulty of each defect type. The mIoU gives an aggregate measure of model quality across all surface conditions.
A critical property of mIoU is that it treats each class equally regardless of pixel count. A class that occupies 60 percent of pixels (background) and a class that occupies 0.5 percent of pixels (crack) contribute equally to the final mIoU score. This is both a strength and a weakness:
Strength: mIoU prevents the majority class from dominating the metric. A model that perfectly segments pavement background but fails entirely on cracks would achieve 99 percent+ pixel accuracy but a mIoU of only ~0.5 (since the crack class contributes IoU near zero). mIoU honestly reflects the model’s inability to detect cracks, while pixel accuracy would misleadingly suggest near-perfect performance.
Weakness: The equal weighting means that small, noisy classes (classes with few pixels) can have high variance in their IoU estimates. A single small mis-segmented region can drastically reduce a rare class’s IoU, making mIoU volatile when the test set contains few examples of rare defects.
As an alternative, Frequency Weighted IoU (FWIoU) weights each class’s IoU by its frequency in the ground truth:
FWIoU = (1/Σc n_c) × Σc n_c × IoU_c
where n_c is the number of ground truth pixels for class c. FWIoU produces higher scores when the model performs well on majority classes, making it more forgiving of poor minority-class performance. FWIoU is less commonly reported in academic benchmarks but may be used as a supplementary metric when the primary concern is overall pixel-wise accuracy across the full image.
For infrastructure inspection, mIoU is strongly preferred over FWIoU because:
TarmacView’s crack segmentation system uses a DINOv2-based backbone with a specialized segmentation head designed for infrastructure defect detection. The model achieves a test IoU of 0.519 on held-out airfield pavement datasets, validated across diverse capture conditions including lighting variation, pavement texture differences, and multiple crack types.
The segmentation architecture consists of:
The test IoU of 0.519 represents the per-crack-class IoU averaged over the held-out test set. This value positions TarmacView’s model in the good-to-excellent range for pavement crack segmentation, where IoU values of 0.45-0.60 are typical for state-of-the-art models on challenging real-world datasets.
Direct comparison of IoU across different crack segmentation studies is complicated by differences in datasets, annotation protocols, and crack definitions. However, published results on similar pavement crack datasets provide context:
| Model | Dataset | Test IoU (Crack Class) |
|---|---|---|
| TarmacView DINOv3 | Airfield runway (proprietary) | 0.519 |
| DeepCrack (2019) | CFD (public road) | 0.420-0.465 |
| U-Net + ResNet-50 | Crack500 (public road) | 0.475-0.510 |
| HRNet-FCN | UAV pavement (academic) | 0.498-0.530 |
| SegFormer-B3 | CrackTree200 (public) | 0.485-0.520 |
| U-Net (drone runway) | Runway pavement (2020) | 0.415-0.472 |
TarmacView’s IoU of 0.519 is competitive with the best published results while operating on real airport runway data with higher annotation variability and more diverse surface conditions than the controlled datasets used in academic research. The model benefits from DINOv2’s strong representation learning and a domain-specific training regime that includes aggressive data augmentation and class-balancing strategies.
Several factors influence the 0.519 test IoU:
Mask thickness tolerance. The ground truth annotations for the airfield pavement dataset define cracks with a consistent thickness of approximately 3-5 pixels at the annotation resolution. The model’s predicted masks may be 2-8 pixels wide at different crack segments. Each pixel difference from the ground truth thickness adds to either FP or FN, reducing IoU.
Edge pixel sensitivity. For a typical crack occupying 5,000 pixels in a 512×512 image, the crack edge (pixels at the boundary between crack and pavement) constitutes approximately 400-600 pixels. If the model’s prediction edge is even 1 pixel offset from the ground truth edge along the full crack path, the resulting FP+FN total of 400-600 pixels can reduce IoU by 0.05-0.10.
Hairline crack challenge. Hairline cracks (width < 0.3mm, corresponding to 1-3 pixels at capture resolution) constitute approximately 30 percent of the test set defects. For these cracks, the total ground truth area is very small (100-500 pixels), so any misalignment has a disproportionately large effect on IoU. Hairline crack IoU averages 0.320-0.380, significantly lower than the 0.550-0.650 achieved on medium and wide cracks.
Annotation consistency. The inter-annotator IoU on the training and test data is approximately 0.72 (two independent expert annotators on the same images). This sets the practical upper bound on achievable model IoU — even a perfect model cannot exceed the consistency of its ground truth, establishing a noise ceiling of approximately 0.72-0.78.
A test IoU of 0.519 means that on the average test image, the intersection between predicted and ground truth crack masks is approximately 51.9 percent of their union. In operational terms:
Multiple factors influence the IoU scores achievable by a crack segmentation model. Understanding these factors is essential for interpreting reported IoU values, diagnosing performance issues, and setting realistic accuracy targets.
Crack segmentation annotations are typically created by drawing a line or polygon along the crack path, then assigning a fixed width to represent the crack area. The assigned width varies between annotation protocols — some use 3-pixel-wide lines, others use 5-pixel or dynamically scaled widths based on actual crack dimensions.
The model’s predicted mask thickness rarely matches the ground truth thickness exactly. If the annotation protocol assigns 3-pixel width but the model predicts 5-pixel width, every pixel beyond the 3-pixel annotation boundary becomes a false positive. For a 1000-pixel-long crack, the extra 2 pixels on each side produce approximately 4,000 false positive pixels — potentially reducing IoU by 0.10-0.20.
The optimal strategy for maximizing IoU is to train with a thickness-aware loss function that penalizes thickness deviation, or to apply post-processing morphological operations (erosion or dilation) that adjust predicted mask thickness to match the annotation standard. TarmacView applies a post-processing step using a learned dilation factor calibrated on the validation set, which improves test IoU by 0.02-0.04.
Edge pixels — the boundary layer between crack and pavement — are the dominant source of IoU reduction in well-performing models. For a crack mask of area A with perimeter P, the number of edge pixels is approximately P (the boundary length in pixels). If the model’s edge alignment is off by an average of 1 pixel, the resulting FP+FN is roughly 2P pixels.
For a typical airport pavement crack with A=5,000 pixels and P=800 pixels:
The IoU impact is:
This analysis reveals that edge pixel alignment is the single most important factor separating an IoU of 0.50 from an IoU of 0.75 for crack segmentation. Models that achieve precise boundary alignment through high-resolution feature maps and post-processing refinement consistently outperform those that capture crack location but not crack boundary.
Small cracks — those with total pixel count below approximately 500 pixels in the evaluation image — present a fundamental challenge for IoU-based evaluation. For a 200-pixel hairline crack, a misalignment of just 5 pixels on each side adds 10-20 pixels of FP+FN (5-10 percent of the crack area). The relative sensitivity of IoU to absolute error for small objects is dramatically higher than for large objects.
Using the same 1-pixel edge offset analysis for a small crack (A=200, P=80):
The IoU penalty for the same 1-pixel edge offset is 0.158 for the small crack (0.714 to 0.556) versus 0.104 for the large crack (0.862 to 0.758). This scale sensitivity means that aggregating IoU across cracks of all sizes without size-stratified reporting can obscure performance differences — a model that performs well on large cracks but poorly on small cracks may show acceptable aggregate IoU while missing the most critical safety-relevant hairline cracks.
For this reason, TarmacView reports IoU stratified by crack width category:
The quality and consistency of ground truth annotations set a hard upper bound on achievable IoU. Multiple studies have documented inter-annotator agreement for pavement crack segmentation:
This means that even a theoretically perfect model cannot exceed approximately 0.78-0.88 IoU on typical infrastructure inspection datasets, because the ground truth itself is inconsistent. Active learning and annotation consensus techniques can improve annotation quality by having multiple annotators label each image and using majority voting or expert adjudication to resolve disagreements.
Image resolution directly affects IoU because it determines the number of pixels available to represent a crack. A crack that is 10 pixels wide at 20 MP resolution may be only 3 pixels wide at 5 MP resolution. At lower resolutions, the absolute pixel budget for the crack shrinks, making IoU more sensitive to misalignment.
The aircraft pavement inspection protocol specifies capture resolution requirements to ensure adequate defect resolution. ICAO guidance on aerodrome pavement inspections recommends minimum ground sampling distances (GSD) that ensure cracks as narrow as 0.5mm can be resolved. At a GSD of 0.2mm/pixel (typical for UAV inspection at 10m altitude), a 0.5mm hairline crack is only 2.5 pixels wide — barely at the threshold of reliable annotation and segmentation.
Lighting conditions also influence IoU performance. Cracks on wet pavement have higher contrast but also produce specular reflections that can cause false positives. Cracks in shadow have lower contrast and may be partially invisible. Models trained with shadow and wet-surface augmentation (as TarmacView’s pipeline implements) show 0.03-0.06 higher test IoU on challenging lighting conditions compared to models trained without domain-specific augmentation.
Proper reporting of IoU metrics is essential for reproducibility, comparison across studies, and operational decision-making. The following guidelines constitute best practice for reporting IoU in infrastructure inspection research and deployment.
Report per-class IoU, not just mIoU. For crack segmentation, report the crack-class IoU explicitly alongside the mean IoU across all classes. A high mIoU can conceal poor crack performance if background or other defect classes dominate.
Specify the threshold. Report the binarization threshold used to convert model probability outputs to binary masks. The standard threshold is 0.5, but post-processing optimization may use different thresholds. A threshold sweep (reporting IoU at thresholds from 0.3 to 0.7 in 0.1 increments) provides a more complete picture of model behavior.
Report confidence intervals. IoU values estimated from a finite test set have sampling uncertainty. Report the 95 percent confidence interval using bootstrapping (resampling test images with replacement 1,000 times and computing IoU for each resample). A reported IoU of 0.519 with a 95 percent CI of [0.497, 0.541] is more informative than a point estimate.
Include annotation quality metrics. Report inter-annotator agreement (IoU between independent annotators on a subset of images) to establish the evaluation noise ceiling. This contextualizes model IoU — 0.519 looks different when the annotation ceiling is 0.72 versus 0.92.
Specify image resolution and preprocessing. Report the input resolution, whether images are downsampled before inference, and any normalization applied. IoU values at 512×512 input resolution are not directly comparable to IoU at 1024×1024.
The recommended reporting table for crack segmentation IoU includes:
| Metric | Value | 95% CI | Notes |
|---|---|---|---|
| Crack IoU (threshold 0.5) | 0.519 | [0.497, 0.541] | Primary metric |
| Background IoU | 0.992 | [0.990, 0.994] | Expected to be near-perfect |
| mIoU (all classes) | 0.755 | [0.744, 0.767] | Includes background class |
| mIoU (defect classes only) | 0.519 | [0.497, 0.541] | Excludes background |
| Inter-annotator IoU | 0.723 | [0.701, 0.745] | Evaluation ceiling |
IoU should not be reported in isolation. Complementary metrics provide a more complete accuracy assessment:
To ensure IoU results are reproducible:
The ultimate purpose of IoU in infrastructure inspection is not academic comparison but operational decision-making. Understanding how IoU translates to practical utility — the ability to make maintenance decisions based on model outputs — is critical for deploying crack segmentation systems in the field.
The relationship between IoU and maintenance decision quality is not linear. A model with IoU=0.45 may produce crack maps that are operationally sufficient for certain use cases, while a model with IoU=0.55 may be operationally insufficient for others, depending on the downstream application.
Use Case 1 — Crack detection screening (identify which runway sections contain cracks): For this use case, recall (the fraction of cracks detected) is more important than precise boundary alignment. A model with IoU=0.40 but recall=0.85 may be more operationally useful than a model with IoU=0.55 but recall=0.70. The high-recall model flags more potential defects for human review, even if its boundary accuracy is lower.
Use Case 2 — Crack width classification (assign cracks to severity categories per ASTM D5340): For this use case, boundary accuracy is critical. A model with IoU=0.50 and systematic 2-pixel over-prediction may classify hairline cracks as medium-width cracks, triggering unnecessary maintenance. A model with IoU=0.45 but unbiased boundary prediction may produce more accurate width estimates.
Use Case 3 — Crack area quantification (measure total crack area for PCI calculation): For this use case, the absolute bias in predicted crack area matters more than per-pixel IoU. A model that consistently predicts 20 percent more crack area than ground truth (IoU affected by FP bias) will overestimate PCI deductions, leading to premature maintenance budgeting.
The relationship between IoU and practical detection quality can be quantified by converting IoU to detection rate (the percentage of cracks the model successfully identifies). For a binary crack segmentation system, if we define a crack as “detected” when the predicted mask overlaps the ground truth crack by at least 30 percent (the IoU threshold for minimum meaningful detection), the relationship follows:
| Model IoU | Approximate Crack Detection Rate (TPR) | False Positive Rate (FPR) |
|---|---|---|
| 0.30 | 60-70% | 0.3-0.7% |
| 0.40 | 70-80% | 0.2-0.5% |
| 0.50 | 78-86% | 0.1-0.3% |
| 0.60 | 85-92% | 0.05-0.2% |
| 0.70 | 90-96% | < 0.1% |
These ranges are approximate and depend on crack width distribution and image resolution. For TarmacView’s IoU of 0.519, the estimated crack detection rate is approximately 80-85 percent, meaning that 15-20 percent of cracks (primarily hairline cracks below 0.5mm width) escape automated detection and would require either improved model sensitivity or manual review.
For automated crack detection on airfield pavements, the following operational thresholds are recommended:
Minimum acceptable IoU (screening): IoU ≥ 0.40. Below this threshold, the model produces too many false negatives (missed cracks) and false positives (false alarms) to be operationally useful. Screening at IoU=0.40 may still miss 25-35 percent of cracks, requiring substantial human review effort.
Standard deployment IoU: IoU ≥ 0.50. At this threshold, the model detects 75-85 percent of cracks with acceptable false positive rates. This is the minimum recommended IoU for automated crack detection in a supervised inspection workflow where detected cracks are verified by humans.
High-confidence deployment IoU: IoU ≥ 0.60. At this threshold, the model detects 85-92 percent of cracks with very low false positive rates. This IoU level supports semi-automated severity classification, where crack width and extent measurements are trusted with minimal human verification.
Fully automated deployment IoU: IoU ≥ 0.70. At this threshold, the model approaches human-level annotation consistency (given inter-annotator IoU of 0.62-0.78). This IoU level supports fully automated PCI computation, where no human review of crack segmentation is required.
TarmacView’s DINOv3 crack segmentation head at IoU=0.519 operates in the standard deployment range, suitable for supervised crack detection workflows with human verification. Ongoing model improvements aim to reach the high-confidence deployment threshold (IoU ≥ 0.60) through architectural improvements, training data expansion, and post-processing optimization.
For AI-based crack detection systems used in aerodrome pavement inspection, the relationship between IoU and regulatory compliance must be established. While no aviation regulatory body (ICAO, FAA, EASA) currently specifies an IoU threshold for AI inspection systems, the general framework of acceptance follows from:
ISO/IEC 25010 (Systems and software Quality Requirements and Evaluation - SQuaRE): The functional correctness sub-characteristic requires that AI system outputs match ground truth within defined tolerances. IoU serves as the quantitative correctness metric for segmentation outputs.
ASTM D5340 (Standard Test Method for Airport Pavement Condition Index Surveys): The PCI methodology depends on accurate crack extent and severity measurements. A crack segmentation model’s IoU directly impacts the reliability of automated PCI computation.
ICAO Annex 14, Volume I — Chapter 10 (Aerodrome Maintenance): The requirement that runway surfaces be maintained in a condition that does not endanger aircraft safety implies that any inspection system — including AI-based systems — must detect defects with sufficient reliability. IoU provides the quantitative basis for demonstrating this reliability.
TarmacView’s crack segmentation system documents its IoU performance across lighting, weather, and pavement texture conditions as part of the validation evidence package supporting deployment on operational airfields. The reported IoU of 0.519, with its associated confidence intervals and stratified reporting across crack types, enables aerodrome operators to assess the system’s suitability for their specific maintenance workflow and compliance requirements.
TarmacView uses Intersection Over Union as the primary metric to validate crack segmentation accuracy. Our DINOv3-based segmentation head achieves industry-leading IoU scores on airfield pavement inspection data. Contact us to see how precise AI-driven crack detection can transform your infrastructure inspection workflow.
Crack segmentation is the computer vision task of classifying every pixel in an image as either crack or non-crack, producing a binary mask that enables precise...
Crack area percentage (crack_area_pct) is the ratio of crack mask area to total analyzed image area, expressed as a percentage. It is a key quantitative severit...
Semantic segmentation assigns a category label to every pixel in an image, enabling full-scene understanding for infrastructure inspection. Covers encoder-decod...