Lab-Only Measurements vs Visual Inspection in Pavement Assessment
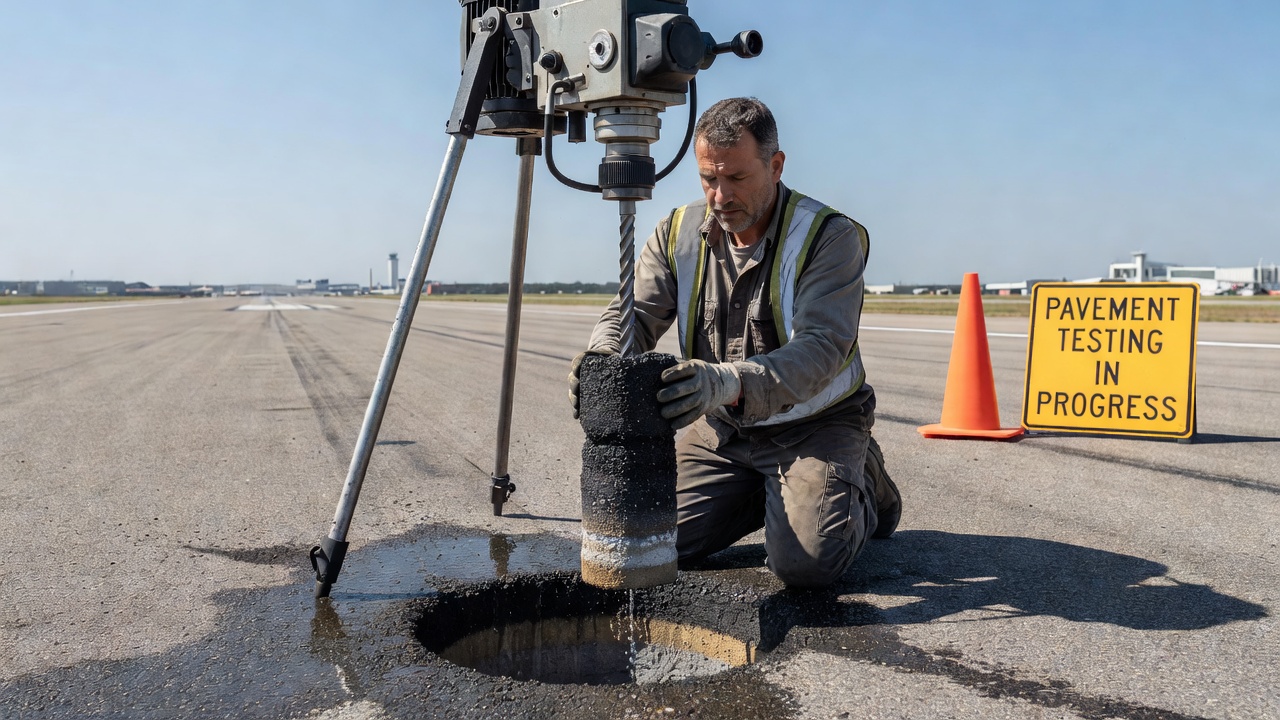
Lab-only refers to pavement properties that cannot be reliably determined from single RGB images — asphalt binder content, density/air voids, and water-damage/stripping progression — requiring core samples, lab testing, GPR, or instrumented measurement. TarmacView explicitly identifies these limits in its condition assessment rationale.
Lab-Only Measurements in Pavement Assessment
1. Definition in TarmacView Context
Lab-only measurements are those physical, chemical, and mechanical properties of asphalt concrete and Portland cement concrete pavements that cannot be determined from visual inspection, surface photographs, or single-frame RGB imagery under any lighting condition or camera resolution. These properties are fundamental to understanding pavement structural capacity, material quality, construction compliance, and remaining service life, yet they are invisible to the camera sensor because they exist below the pavement surface, at the aggregate-binder interface, or within the pore structure of the material. TarmacView operates on the principle that engineering credibility requires explicit delineation of the boundary between what can be observed visually and what requires laboratory testing, instrumented field measurement, or destructive sampling. This boundary is not an admission of weakness in the visual assessment methodology but a necessary declaration of engineering rigor that distinguishes professional pavement evaluation from superficial inspection. The distinction between visual and lab-only measurements is rooted in the fundamental physics of electromagnetic radiation. A standard RGB camera captures reflected light in three wavelength bands corresponding to red, green, and blue visible light, approximately 400 to 700 nanometers. These wavelengths interact only with the surface of the pavement material, penetrating at most a few millimeters into the surface texture, and cannot interrogate the material bulk properties below. Even when surface distresses such as cracking, raveling, or bleeding are clearly visible, these are secondary manifestations of underlying material conditions, not direct measurements of those conditions. TarmacView uses advanced deep learning models to identify, classify, and quantify surface distresses with high accuracy, but the platform is designed from the ground up to clearly distinguish between direct observations of surface condition and the inferred or suspected material properties that would require lab validation. This distinction is maintained at every level of the TarmacView reporting system: the automated condition indices incorporate confidence ratings that reflect whether a given measurement is direct or inferential; the recommendation engine flags conditions where lab validation is necessary before proceeding with rehabilitation design; and the executive summary explicitly states which pavement properties were assessed visually and which were not assessed at all. The regulatory framework governing pavement assessment reinforces this distinction. International Civil Aviation Organization Annex 14, Federal Aviation Administration Advisory Circular 150/5320-6G, and the American Association of State Highway and Transportation Officials (AASHTO) pavement design guides all require documented material properties for pavement strength reporting and structural capacity determination. These material properties — including asphalt binder content, in-place density, air void content, and moisture susceptibility — are classified as laboratory determinations in every relevant standard. No regulatory body accepts visual inspection as a substitute for laboratory testing of these properties, and any pavement assessment platform that claims to measure these properties from images alone is making a scientifically unsupportable claim. TarmacView addresses this reality by building the lab-only classification directly into the assessment framework, enabling clients to understand precisely what their visual inspection has revealed and what additional testing is required to complete the pavement evaluation.
The practical consequence of the lab-only classification for infrastructure owners and pavement engineers is a clear decision tree for pavement assessment scoping. When a TarmacView automated survey identifies surface distresses such as fatigue cracking, rutting, or thermal cracking, the platform assigns confidence levels and recommends appropriate follow-up actions. If the observed distresses are consistent with known material deficiencies — for example, rutting consistent with low air voids or flushing consistent with high binder content — the TarmacView report flags these as suspected conditions requiring laboratory verification before design decisions are made. This approach prevents the two common errors in pavement assessment: the first being the false positive where a surface condition is mistaken for a material problem that does not actually exist (such as interpreting surface oxidation as binder aging when the binder content is actually adequate), and the second being the false negative where a material deficiency is present but produces no surface manifestation until the pavement fails catastrophically (such as stripping within a dense-graded HMA layer that shows no surface distress until raveling appears). By maintaining the lab-only boundary, TarmacView enables clients to optimize their testing budgets, directing laboratory resources to the specific properties and locations where material deficiencies are most likely based on the visual indicators, rather than conducting blanket coring programs across entire pavement networks.
2. Binder Content
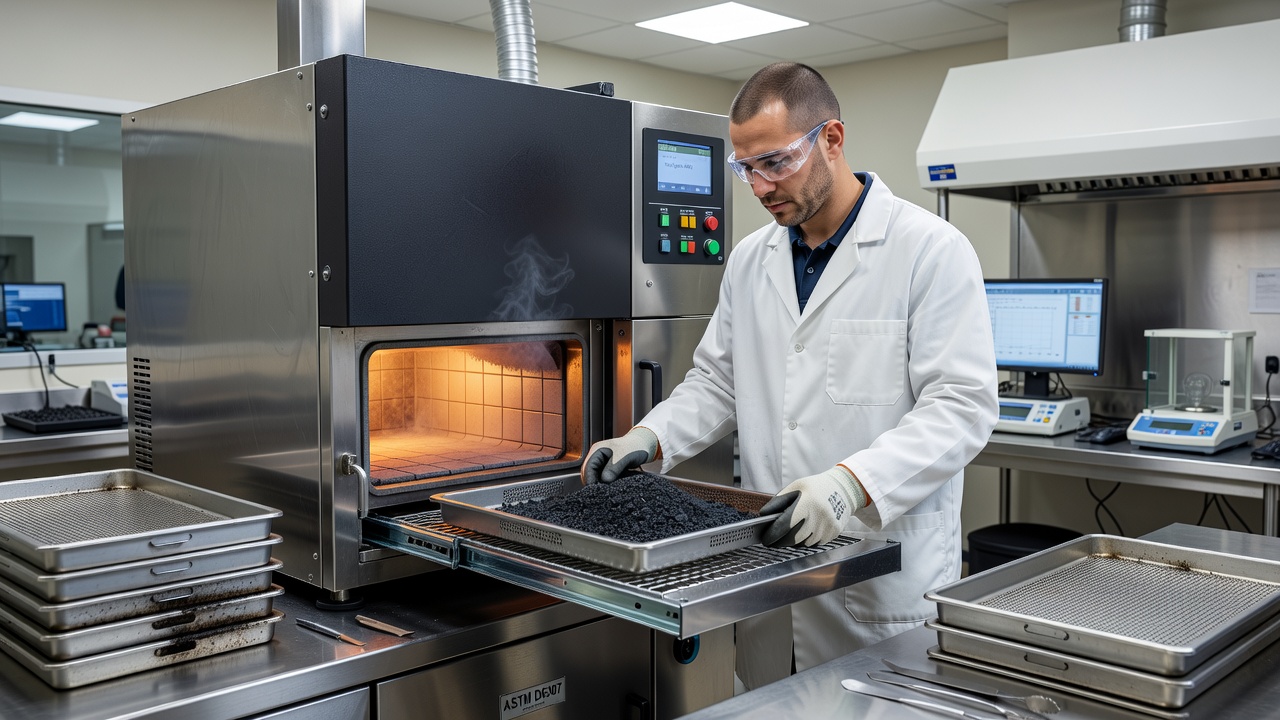
Asphalt binder content is the percentage of bituminous binder by weight of the total hot-mix asphalt (HMA) mixture and is arguably the single most important material property governing pavement performance. Binder content directly affects mixture stiffness, fatigue resistance, rutting resistance, moisture susceptibility, and durability. An optimum binder content provides sufficient film thickness around aggregate particles to ensure durability and adhesion while maintaining enough aggregate interlock and internal friction to resist permanent deformation. The difference between an optimum binder content of 5.2 percent and a deficient content of 4.6 percent can reduce pavement fatigue life by more than 50 percent according to data from the National Center for Asphalt Technology (NCAT) and the Long-Term Pavement Performance (LTPP) program. Conversely, excess binder content of 5.8 percent or higher can produce flushing, bleeding, and rutting, reducing skid resistance and creating safety hazards, particularly on airport runways and high-speed highways. Binder content is determined through three primary laboratory methods, each with specific advantages, limitations, and applicable standards. The ignition oven method, governed by AASHTO T 308 and ASTM D 6307, involves placing an asphalt mixture sample in a furnace heated to approximately 538 degrees Celsius (1000 degrees Fahrenheit), where the binder is burned off and the mass loss is measured to calculate binder content by difference. This method is the most widely used in the United States and is favored for its speed, precision, and reduced use of hazardous solvents. However, the ignition oven method requires correction factors for aggregate types that lose mass during ignition, such as limestone, dolomite, and certain lightweight aggregates. These correction factors must be determined through calibration testing using the specific aggregate source and gradation that will be used in production, adding a preliminary laboratory step that cannot be avoided. The precision of the ignition oven method, when properly calibrated, is reported as approximately plus or minus 0.11 percent binder content at the single-operator precision level (ASTM D 6307), which is adequate for both quality control and forensic investigations.
The solvent extraction method, governed by AASHTO T 164 and ASTM D 2172, uses a solvent such as trichloroethylene, n-propyl bromide, or methylene chloride to dissolve the asphalt binder from the aggregate. The binder content is determined by measuring the mass of extracted binder after solvent recovery or by the mass loss of the sample after extraction. The centrifuge extraction method (Method A of ASTM D 2172) spins the solvent-aggregate mixture at high speed to separate the dissolved binder from the aggregate, while the reflux extraction method (Method B) continuously circulates hot solvent through the sample until the binder is fully dissolved. Solvent extraction was the standard method for decades before the ignition oven method became prevalent, and it remains the reference method for certain applications, particularly when the aggregate is highly susceptible to ignition loss or when the binder is modified with polymers that do not burn off cleanly in the ignition oven. The solvent extraction method has the advantage of recovering the binder for further testing such as penetration, softening point, or dynamic shear rheometry, which may be necessary for forensic investigations where binder aging or modification is of interest. The disadvantages include the use of hazardous solvents that require environmental and worker safety controls, longer testing times (typically two to four hours per test), and lower precision compared to the ignition oven method, with inter-laboratory precision reported at approximately plus or minus 0.26 percent binder content (ASTM D 2172). The choice between ignition oven and solvent extraction depends on the purpose of the testing, the available laboratory equipment, and the specific requirements of the governing specification. For routine quality control during new construction, the ignition oven method is preferred for its speed and precision. For forensic investigations where the binder must be recovered for rheological testing, solvent extraction is necessary. For projects involving high polymer-modified binders such as styrene-butadiene-styrene (SBS) or terminal-blend tire rubber, both methods may be required, with the ignition oven providing the binder content and solvent extraction enabling binder recovery for performance grading verification.
The nuclear asphalt content gauge, governed by ASTM D 4125, provides a non-destructive method for determining binder content by measuring the attenuation of neutron or gamma radiation passing through an asphalt mixture sample. The gauge is calibrated using samples of known binder content from the same mix design, and the calibration relationship between radiation attenuation and binder content is established through laboratory testing. The nuclear gauge method is rapid, typically requiring one to three minutes per test, and does not destroy the sample, allowing the same material to be used for other tests such as gradation or moisture content. However, the nuclear gauge requires careful calibration for each mix type and aggregate source, is sensitive to changes in aggregate mineralogy and moisture content, and has lower precision than the ignition oven method, with typical precision in the range of plus or minus 0.3 to 0.5 percent binder content. The nuclear gauge also involves regulatory requirements for radioactive source handling, storage, and personnel training, which limits its use in many jurisdictions. The nuclear gauge method is used primarily for rapid quality control screening during production, where a large number of tests must be performed quickly and minor variations in precision are acceptable, but it is not considered an acceptable substitute for ignition oven or solvent extraction testing for acceptance decisions in most agency specifications.
The fundamental reason that RGB cameras cannot determine binder content is that visible light reflects from the asphalt surface, which is dominated by the surface binder film and exposed aggregate, not by the bulk binder distribution throughout the pavement layer. The surface binder film thickness varies with construction practices, traffic abrasion, and environmental exposure, and bears no consistent relationship to the total binder content. A pavement with adequate binder content can appear dry and oxidized at the surface due to surface binder aging and weathering, while a pavement with deficient binder content can appear rich at the surface due to binder migration during construction. The color and reflectivity of the asphalt surface, which are the only optical signals available to an RGB camera, are influenced by aggregate color, binder oxidation state, surface texture, moisture, dust, and rubber deposition from tire wear, all of which confound any attempt to correlate surface appearance with binder content. Published research in the Transportation Research Record has attempted to use hyperspectral imaging in the short-wave infrared range (1000 to 2500 nanometers) to estimate binder content through spectral absorption features associated with hydrocarbon bonds in the asphalt binder. While these studies have shown correlation coefficients in the range of 0.70 to 0.85 under controlled laboratory conditions, the results degrade significantly under field conditions with variable lighting, moisture, surface texture, and binder aging states. No published study has demonstrated that standard RGB imagery can predict binder content within the plus or minus 0.15 percent precision required for acceptance testing or the plus or minus 0.30 percent precision adequate for forensic investigation. The scientific consensus, reflected in FAA, AASHTO, ASTM, and ICAO standards, remains that binder content is a laboratory-determined property requiring measured mass loss during binder combustion or dissolution.
3. Density and Air Voids
The in-place density of asphalt pavement, expressed as a percentage of the laboratory-determined maximum theoretical specific gravity (Gmm, also known as Rice gravity), is the most critical construction quality indicator for asphalt pavement performance. Density is directly related to the air void content of the compacted pavement layer, with typical specification requirements ranging from 92 to 97 percent of Gmm, corresponding to air void contents of 3 to 8 percent. Pavements compacted to less than 92 percent of Gmm (more than 8 percent air voids) are susceptible to moisture infiltration, oxidation, raveling, and premature cracking, while pavements compacted to more than 97 percent of Gmm (less than 3 percent air voids) are susceptible to flushing, bleeding, and rutting under traffic loading. The relationship between density and pavement life is well established through the LTPP database, which has demonstrated that a one percent reduction in air voids (an increase in density) can extend pavement fatigue life by approximately 10 percent, while a one percent increase in air voids (a decrease in density) can reduce fatigue life by a similar amount. The measurement of in-place density requires either destructive sampling through core extraction followed by laboratory bulk specific gravity testing, or non-destructive field testing using nuclear or non-nuclear density gauges that measure the interaction of radiation or electromagnetic fields with the pavement material. Neither method can be approximated by visual inspection, and no correlation between surface appearance and in-place density has been established in the peer-reviewed literature.
The core sampling method, governed by AASHTO T 166 and ASTM D 2726 for bulk specific gravity determination, involves extracting a cylindrical pavement core of approximately 100 millimeters (4 inches) or 150 millimeters (6 inches) diameter using a diamond-tipped core drill. The core is dried to a constant mass, weighed in air, coated with paraffin wax or using a vacuum-sealed plastic bag method to seal surface voids, weighed again in air, and weighed while submerged in water at a controlled temperature of 25 degrees Celsius. The bulk specific gravity is calculated as the mass of the dry sample divided by the difference between the mass of the saturated surface-dry sample and the mass of the sample in water, with corrections applied for water absorption and paraffin or bag mass. This calculated bulk specific gravity is then divided by the maximum theoretical specific gravity (Gmm) of the same mixture, determined using AASHTO T 209 or ASTM D 2041 on loose mixture sampled during construction, to obtain the percent compaction. The air void content is calculated as 100 percent minus the percent compaction, representing the volume of interconnected and isolated air voids within the pavement structure as a percentage of total volume. The precision of core-based density measurement depends on the care taken in sample preparation, the accuracy of the temperature control, and the uniformity of the core sample. Within-laboratory precision for AASHTO T 166 is reported as approximately plus or minus 0.015 in bulk specific gravity units, corresponding to approximately plus or minus 0.6 percent air voids for a typical dense-graded HMA with Gmm of approximately 2.500. This precision is adequate for acceptance testing, forensic investigation, and structural design.
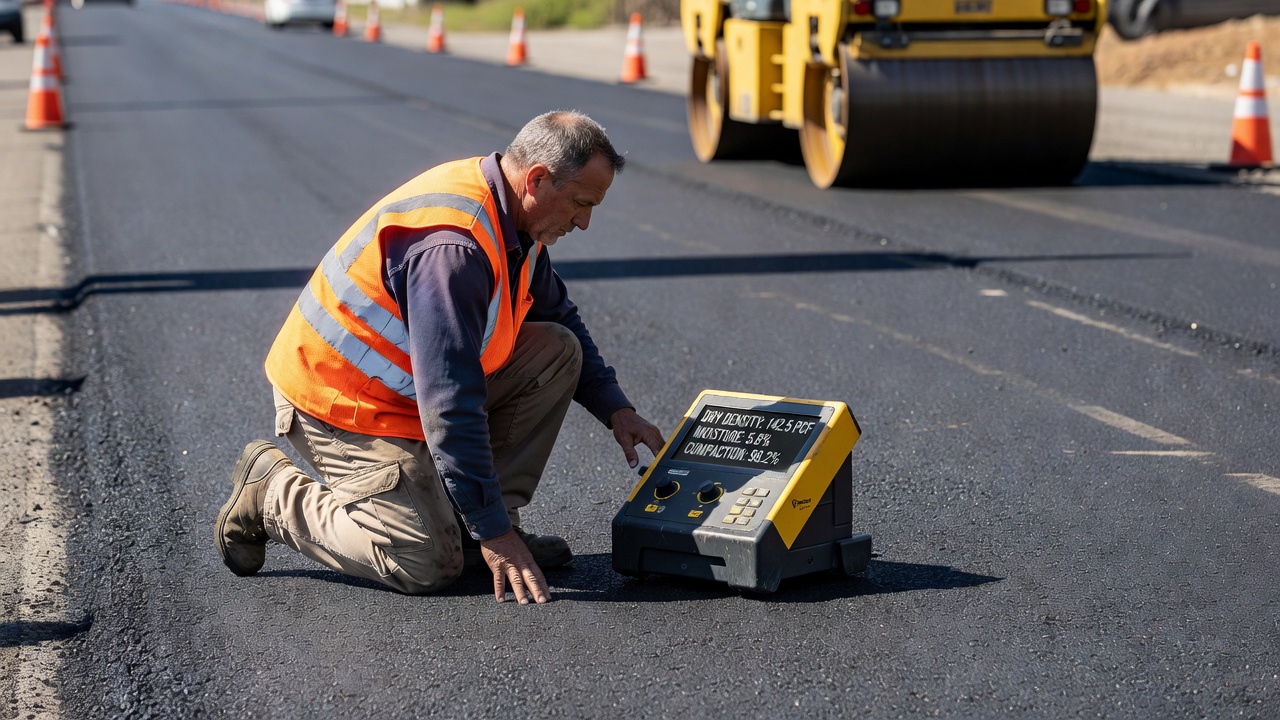
The nuclear density gauge method, governed by ASTM D 6938, measures in-place density by directing a radioactive source (typically cesium-137 for gamma radiation) into the pavement and measuring the backscatter or direct transmission of radiation to detectors on the gauge. The intensity of the detected radiation is inversely related to the density of the material, with denser materials attenuating more radiation. The nuclear gauge operates in either backscatter mode, where the source and detectors are on the same side of the pavement surface, or direct transmission mode, where the source is inserted into a small hole drilled through the pavement and detectors are on the pavement surface. The direct transmission mode provides a measurement through the full pavement thickness and is generally more accurate than the backscatter mode, which is influenced primarily by the density of the upper 50 to 75 millimeters of the pavement. Nuclear gauges require daily calibration checks using a manufacturer-supplied calibration block and must be recalibrated annually or after any maintenance involving the radioactive source. The precision of nuclear density gauges is approximately plus or minus 0.005 to 0.010 in density units (grams per cubic centimeter), depending on the mode of operation and the uniformity of the pavement material. Nuclear density gauges are widely used for quality control during construction because they provide immediate results, allowing compaction adjustments to be made in real time. However, nuclear gauges are not accepted as the sole basis for acceptance testing by many agencies, including the FAA for airport pavement construction per P-401 and P-501 specifications, which require core samples for acceptance. The nuclear gauge also requires licensed operators, regulated storage and transport of radioactive materials, and routine radiation safety monitoring, all of which add to the cost and complexity of its use.
The non-nuclear density gauge method, governed by ASTM D 7113, uses electromagnetic field measurement to estimate density without the regulatory burden of radioactive sources. These gauges transmit an electromagnetic field into the pavement and measure the dielectric properties of the material, which are correlated with density through a calibration relationship. Non-nuclear gauges require mix-specific calibration using cores from the same pavement section, and their accuracy degrades when aggregate mineralogy, moisture content, or mix gradation vary from the calibration conditions. The precision of non-nuclear gauges is generally lower than nuclear gauges, with typical standard deviations of plus or minus 0.012 to 0.018 in density units, and the correlation with core density measurements under field conditions is typically in the range of 0.80 to 0.90 R-squared. Non-nuclear gauges are acceptable for quality control monitoring during construction where rapid comparative measurements are needed but are rarely accepted for formal acceptance testing without core validation. Ground-penetrating radar (GPR) has emerged as a complementary tool for density assessment, with the dielectric constant measured by GPR correlating with air void content. Research by the FHWA and multiple university studies has demonstrated that GPR can detect density variations across a pavement section with reasonable accuracy, providing continuous coverage that complements the point measurements of cores and nuclear gauges. However, GPR cannot provide absolute density values without calibration against cores from the same section, and the accuracy of GPR density estimation is typically in the range of plus or minus 1.5 to 2.5 percent air voids when properly calibrated. This level of accuracy is adequate for identifying areas of low density that require further investigation but is not sufficient to replace core testing for acceptance or forensic determination.
The impossibility of determining density from visual inspection is obvious from the physics of the measurement. Density is a bulk material property that depends on the internal arrangement of aggregate particles, the volume of air voids between particles, and the distribution of binder within the mixture. Surface appearance, including surface texture, aggregate exposure, and surface macrotexture measured by sand patch or laser profiling, can indicate surface characteristics but does not correlate with bulk density. A pavement can have excellent surface texture and appearance with low density due to inadequate compaction at depth, and a pavement can have poor surface appearance with adequate density. Published studies have attempted to correlate surface texture measurements from laser profilometry with density, finding correlation coefficients typically below 0.50, indicating that surface texture explains less than 25 percent of the variation in density. No study has demonstrated a reliable correlation between RGB image data and in-place density or air voids. TarmacView therefore classifies density and air voids as lab-only measurements, recommending core sampling and laboratory bulk specific gravity testing whenever density-related distresses such as rutting, raveling, or surface deterioration are observed in the visual assessment.
4. Water Damage and Stripping
Moisture-induced damage, commonly referred to as stripping, is the loss of adhesion between the asphalt binder and the aggregate surface in the presence of water, leading to a progressive loss of mechanical strength, raveling, and structural failure of the pavement layer. Stripping is one of the most insidious forms of pavement deterioration because it can progress significantly within the pavement structure before any surface manifestation becomes visible. The internal damage mechanism begins at the microscopic level, where water molecules displace the asphalt binder from the aggregate surface due to thermodynamic incompatibility between the binder and the aggregate mineralogy. Hydrophilic aggregates, particularly siliceous aggregates such as quartz, granite, and gravel, are more susceptible to stripping than hydrophobic aggregates such as limestone and dolomite. The presence of water weakens the binder-aggregate bond over time through repeated freeze-thaw cycles, hydraulic pressure from traffic loading, and chemical dissolution of the binder-aggregate interface. The rate and severity of stripping depend on aggregate mineralogy, binder chemistry, binder film thickness, air void content, pavement drainage, traffic loading, and environmental conditions. Laboratory testing for moisture damage susceptibility is required for mix design approval, quality control during construction, and forensic investigation of premature pavement failure. The two primary laboratory tests for moisture damage are the tensile strength ratio (TSR) test governed by AASHTO T 283 and the Hamburg wheel tracking test governed by AASHTO T 324. Both tests require compacted specimens prepared in the laboratory from plant-produced mixture or cored from the pavement in the field, and neither test can be replaced by visual inspection of the pavement surface.
The AASHTO T 283 tensile strength ratio test, also known as the modified Lottman test, evaluates moisture susceptibility by comparing the indirect tensile strength of a set of dry-conditioned specimens to a set of moisture-conditioned specimens. Six compacted specimens are prepared at an air void content of 7.0 plus or minus 0.5 percent, with half of the specimens maintained at 25 degrees Celsius as the dry control group and half subjected to vacuum saturation to achieve 55 to 80 percent saturation followed by a freeze cycle at minus 18 degrees Celsius for 16 hours and a warm-water soak cycle at 60 degrees Celsius for 24 hours. After conditioning, the moisture-conditioned specimens are brought to 25 degrees Celsius and tested in indirect tension at a loading rate of 50 millimeters per minute alongside the dry control specimens. The tensile strength ratio is calculated as the average tensile strength of the moisture-conditioned specimens divided by the average tensile strength of the dry specimens, expressed as a percentage. A TSR of 80 percent or higher is typically required for acceptance in agency specifications, with some agencies requiring 85 percent for high-traffic or severe-environment applications. The within-laboratory precision of the TSR test is reported as approximately plus or minus 5 percent TSR for the same mix, while the between-laboratory precision can be as high as plus or minus 12 percent TSR, reflecting the sensitivity of the test to specimen preparation, air void content, saturation level, and testing conditions. The TSR test provides a direct measurement of the mechanical effect of moisture conditioning on the mixture and is correlated with field stripping performance for a wide range of mixture types, although the correlation is not perfect and varies with aggregate type, binder grade, and mixture design.
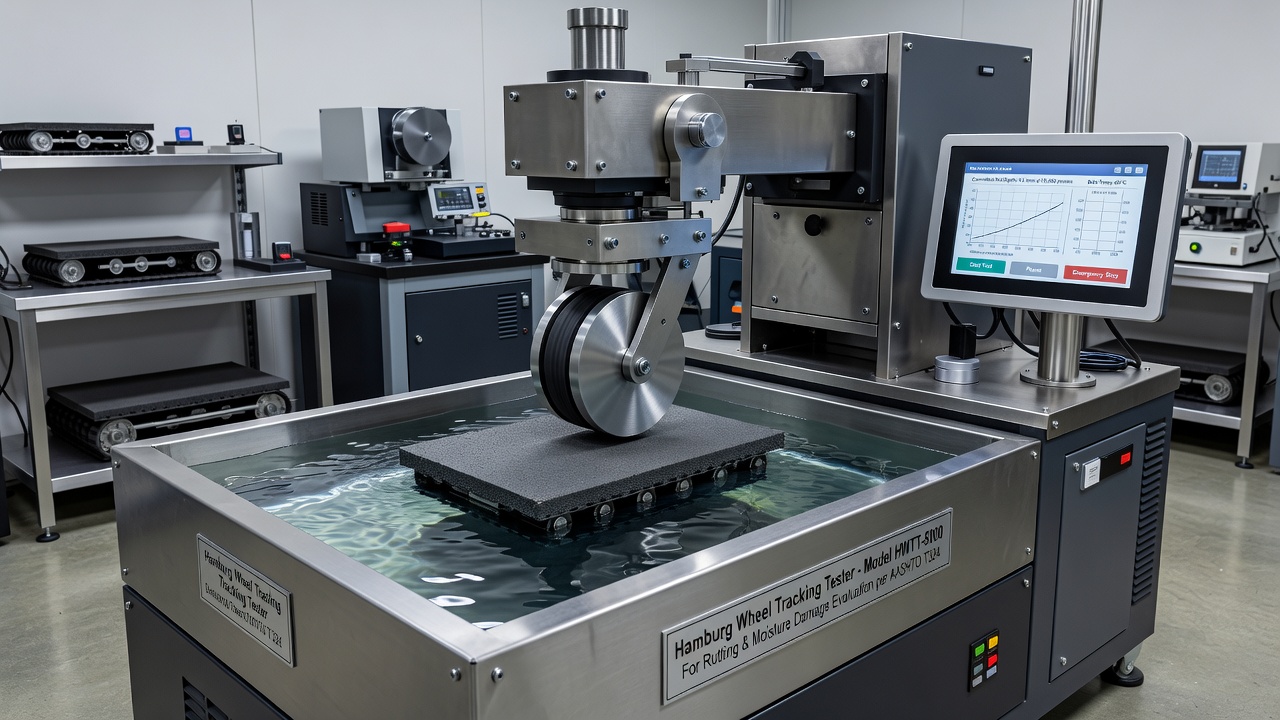
The Hamburg wheel tracking test, governed by AASHTO T 324, is a more severe and more information-rich test that simultaneously evaluates rutting resistance and moisture susceptibility. Compacted specimens are submerged in a water bath maintained at 50 degrees Celsius, and a steel wheel applies a load of approximately 703 Newtons (158 pounds) as it passes back and forth across the specimen surface at a frequency of approximately 56 passes per minute for up to 20,000 passes or until 20 millimeters of deformation occurs. The test records the deformation as a function of the number of passes, producing a curve that typically shows an initial consolidation phase, a creep phase, and a stripping phase where the deformation rate increases sharply as moisture damage accelerates. The stripping inflection point is identified as the number of passes at which the deformation rate increases due to moisture damage, and the stripping slope and total deformation at 20,000 passes are reported as measures of moisture susceptibility. The Hamburg test is widely used in Europe, the United States, and Asia, and is specified by many agencies including the Texas Department of Transportation, the Illinois Department of Transportation, and the California Department of Transportation. The precision of the Hamburg test has been studied through inter-laboratory testing programs, with typical coefficients of variation in the range of 10 to 25 percent for the number of passes to failure, depending on the mixture type and the experience of the laboratory. The Hamburg test provides a more direct simulation of field stripping conditions than the TSR test, particularly for dense-graded mixtures under heavy traffic loading, and is considered by many researchers to be the more reliable indicator of field stripping performance.
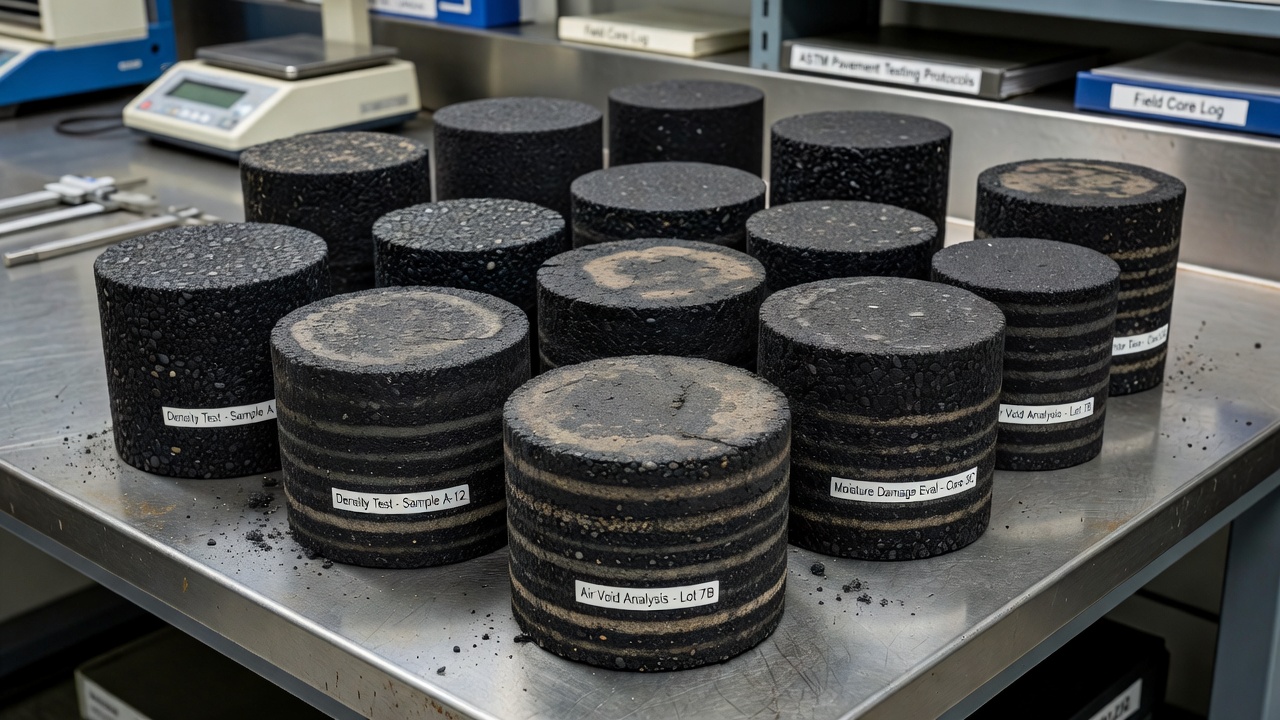
Visual inspection of extracted core samples provides supplementary information about moisture damage but cannot replace the quantitative TSR or Hamburg tests. When a core is extracted from a pavement suspected of stripping damage, the core is cut longitudinally through its center and examined for the characteristic staining, binder separation, and aggregate exposure that indicate stripping. The visual stripping rating, typically on a scale of 1 to 5 or expressed as the percentage of stripped aggregate surface area, is recorded at multiple depths through the pavement layer. Visual core inspection can identify the depth and extent of stripping within the pavement structure, providing information that surface inspection cannot obtain. However, visual core inspection is qualitative and operator-dependent, with inter-rater reliability coefficients typically in the range of 0.50 to 0.70, meaning that different inspectors frequently assign different stripping ratings to the same core. Visual core inspection cannot measure the mechanical strength loss caused by moisture damage, which is the critical parameter for structural capacity assessment and rehabilitation design. A core that shows visible stripping but retains adequate mechanical strength may require less aggressive rehabilitation than a core that shows minimal visible stripping but has lost 40 percent of its tensile strength. The quantitative laboratory tests (TSR and Hamburg) provide the mechanical property measurements that are required for engineering decisions, while visual core inspection provides qualitative context that helps interpret the laboratory results.
RGB cameras cannot measure moisture damage or stripping because stripping is an internal material condition that occurs at the aggregate-binder interface within the pavement structure. The surface manifestations of stripping, including raveling, potholing, and cracking, appear only after significant internal damage has occurred, and by the time these surface conditions are visible, the structural capacity of the pavement may have been reduced by 50 percent or more. Surface images can identify the advanced stages of stripping damage when raveling and surface aggregate loss are visible, but these observations are proxies for the internal condition, not measurements of it. No correlation has been established between surface image features and the TSR or Hamburg test results of the underlying pavement material. TarmacView identifies surface conditions consistent with stripping — including raveling, popouts, surface cracking in wheel paths, and potholes — and flags these as indicators of potential moisture damage requiring laboratory testing, but the platform does not claim to measure moisture damage from images alone.
5. Why Single RGB Cannot Measure These
The fundamental physical limitation of single RGB imaging for pavement material property measurement is rooted in the nature of electromagnetic radiation and its interaction with pavement materials. RGB cameras record reflected visible light in three spectral bands centered at approximately 450 nanometers (blue), 550 nanometers (green), and 650 nanometers (red). The depth of penetration of visible light into asphalt pavement is extremely limited, typically on the order of 50 to 200 micrometers for a dense-graded HMA surface at the wavelengths used by standard camera sensors. This penetration depth is several orders of magnitude less than the thickness of a typical pavement layer, which ranges from 40 millimeters for a thin surface course to 300 millimeters or more for a full-depth pavement structure. The visible light reflected from the pavement surface carries information only about the surface condition, surface binder film, exposed aggregate faces, surface texture in the micrometer to millimeter range, and surface contaminants. It carries no information about the interior of the pavement layer, the distribution of binder throughout the thickness, the air void structure, the aggregate gradation below the immediate surface, or the condition of the binder-aggregate interface. The physical principles governing this limitation are the same principles that prevent a visible-light camera from seeing through opaque materials, and no advancement in camera resolution, sensor sensitivity, or image processing can overcome this fundamental barrier.
Measurement
Physics of Measurement
Why RGB Cannot Measure
Required Method
Binder Content
Mass loss during combustion or dissolution
Surface binder film is unrelated to bulk binder content
Ignition oven (AASHTO T 308) or solvent extraction (AASHTO T 164)
In-Place Density
Bulk specific gravity of compacted material
No optical signal penetrates beyond 200 micrometers
Core sampling (AASHTO T 166) or nuclear gauge (ASTM D 6938)
Air Voids
Volume of air as percentage of total volume
Pore structure is internal and invisible
Calculated from Gmm and Gmb (ASTM D 3203)
Stripping Resistance
Tensile strength after moisture conditioning
Internal binder-aggregate debonding not visible
TSR (AASHTO T 283) or Hamburg (AASHTO T 324)
The concept of spectral penetration depth is critical to understanding this limitation. Each material has a characteristic penetration depth for electromagnetic radiation at a given wavelength, defined as the depth at which the intensity of the incident radiation is reduced to 1/e (approximately 37 percent) of its original value. For opaque materials such as asphalt concrete, this penetration depth is very small across the visible spectrum. Even at longer wavelengths in the near-infrared region up to 2500 nanometers, penetration depth in asphalt increases only to approximately 1 to 5 millimeters in the most favorable conditions with dry, dense-graded mixtures. Short-wave infrared (SWIR) hyperspectral imaging, which acquires reflectance data across 100 to 200 narrow spectral bands in the 1000 to 2500 nanometer range, can detect spectral absorption features associated with hydrocarbon bonds in the asphalt binder, enabling estimation of surface binder chemistry and oxidation state. However, even SWIR hyperspectral imaging cannot measure binder content because the spectral signal is dominated by the surface binder film, which is not representative of the bulk binder content. The correlation between SWIR-derived binder content and laboratory-determined binder content reported in research studies is typically in the range of 0.65 to 0.80 R-squared under controlled conditions, falling to 0.30 to 0.50 R-squared under field conditions with variable moisture, surface texture, and binder aging. These correlation levels are insufficient for acceptance testing, quality control, or forensic determination, where precision requirements of plus or minus 0.15 percent binder content are typical.
The temporal variability of pavement surface appearance introduces another fundamental limitation. The same pavement section imaged on different days can produce significantly different surface reflectance values due to changes in lighting angle, cloud cover, surface moisture, temperature, and the presence of dust, rubber deposits, or deicing chemicals. A binder content prediction model calibrated on images taken under one set of conditions will produce systematically biased predictions under different conditions, and the magnitude of this bias can exceed the entire acceptable range of binder content variation. Diurnal temperature variation changes the surface binder viscosity, which affects the surface microtexture and reflectance. A pavement surface can appear dry and oxidized in the morning when temperatures are low and the binder is stiff, then appear flushed and binder-rich in the afternoon when temperatures rise and the binder softens and exudes to the surface. No single RGB image or set of images captured at a specific point in time can account for this temporal variability, and no amount of training data can eliminate the systematic bias introduced by uncontrolled environmental variables. The supervised learning models used in pavement image analysis learn correlations present in their training data, but when the physical relationship between surface appearance and the target property is weak or non-existent, the models learn spurious correlations that do not generalize to new conditions. A deep learning model trained to predict binder content from RGB images might learn to associate darker surfaces with higher binder content — a correlation that holds under some conditions but fails completely when surface darkness is caused by moisture, binder oxidation, rubber deposits, or aggregate color rather than binder content. The model may achieve apparently good performance on a held-out test set drawn from the same distribution as the training data, but this performance collapses when the model is applied to data from a different site, different mix design, different climate, or different time of year.
TarmacView’s approach to this limitation is based on engineering first principles rather than statistical pattern matching. The platform does not attempt to estimate binder content, density, air voids, or stripping resistance from RGB imagery, because no scientifically valid method exists for making these measurements from visible-light images. Instead, TarmacView identifies and quantifies surface distresses that are directly observable in RGB images within carefully defined confidence bounds, and separately flags conditions that are consistent with lab-only material deficiencies that require laboratory testing for definitive diagnosis. This approach is not a limitation of the TarmacView technology specifically but a reflection of the fundamental physics of visible-light imaging applied to opaque pavement materials. Any platform that claims to measure lab-only properties from RGB images is either making unsupportable scientific claims or applying statistical models that produce misleading results outside their limited calibration range.
6. Visual Proxies vs Direct Measurement
A visual proxy in pavement assessment is a surface-observable condition that correlates with an underlying material property or pavement condition but is not a direct measurement of that property. Visual proxies are the foundation of pavement condition assessment using visual inspection methods because many critical pavement conditions are inaccessible to direct observation and must be inferred from their surface manifestations. The relationship between a visual proxy and the underlying condition is governed by the mechanics of pavement deterioration, which involves complex interactions between material properties, traffic loading, environmental exposure, and time. Understanding the strength and limitations of each visual proxy is essential for proper interpretation of visual assessment results and for determining when laboratory testing is necessary to confirm or refute the inferred condition. The key distinction between visual proxies and direct measurements is one of certainty: a direct measurement provides a quantitative determination of a specific property with known precision and accuracy, while a visual proxy provides an indication that the underlying condition may exist but with uncertainty that must be quantified and communicated. TarmacView quantifies this uncertainty through confidence ratings assigned to each condition indicator, providing users with explicit guidance on the reliability of each observation.
Visual Proxy
Associated Lab-Only Property
Correlation Strength
TarmacView Confidence
Recommended Lab Test
Surface rutting in wheel paths
Low density, high air voids, inadequate compaction
Moderate to weak
Medium
Core density (AASHTO T 166)
Bleeding or flushing
High binder content
Weak to moderate
Low
Binder content (AASHTO T 308)
Dry, raveling surface
Low binder content, binder aging
Weak
Low
Binder content (AASHTO T 308 or T 164)
Wheel-path cracking and raveling
Moisture damage, stripping
Moderate
Medium
TSR (AASHTO T 283)
Surface oxidation and color change
Binder aging, embrittlement
Weak
Low
Binder recovery and rheology
Patch deterioration adjacent to sound pavement
Density differential, segregation
Moderate
Medium
Core density comparison
Surface rutting provides a useful case study for understanding visual proxies. Rutting is a surface deformation in the wheel path that is directly measurable from an RGB image or from a laser profilometer, and the rut depth can be quantified with high accuracy. The visual observation of rutting is a direct measurement of the surface deformation, not a proxy. However, the cause of the rutting — whether it results from densification (volume reduction due to traffic loading), shear flow (lateral displacement of the mix under shear stress), or subgrade deformation — is not visible from the surface image. The interpretation of rutting as a proxy for low density or inadequate compaction is an inference that carries significant uncertainty. A pavement with adequate density can exhibit rutting due to shear flow if the mix is poorly designed with insufficient aggregate interlock or if the binder is too soft for the traffic loading and temperature conditions. Conversely, a pavement with low density may not exhibit rutting if the traffic loading is light or if the pavement has been in service for only a short time. TarmacView measures rut depth directly from the surface image using photogrammetric techniques but does not infer the cause of rutting from the visual observation alone. The platform reports the rut depth measurement with a confidence rating and separately notes that laboratory density testing is recommended when rutting is observed, because rutting is a possible indicator of density issues but is not a reliable substitute for direct density measurement.
The use of visual proxies necessarily involves Bayesian reasoning: the probability that a given underlying condition exists given the presence of a particular visual symptom depends on the prior probability of that condition in the pavement population and the conditional probability of the symptom given the condition. For example, the probability that a pavement has low density given that it exhibits rutting is equal to the probability of rutting given low density multiplied by the prior probability of low density in the general pavement population, divided by the overall probability of rutting from all causes. If rutting is equally likely to be caused by low density, shear flow, or subgrade deformation, and each of these conditions has equal prior probability, then the posterior probability that rutting indicates low density is only 33 percent. This low posterior probability means that relying on rutting alone to diagnose density problems would produce a false positive rate of approximately 67 percent, leading to unnecessary laboratory testing and rehabilitation costs. TarmacView improves the diagnostic value of visual proxies by considering multiple concurrent visual indicators. If a pavement exhibits rutting accompanied by raveling, surface cracking in the wheel paths, and a flushed surface, the combination of indicators increases the probability that the underlying cause is a material deficiency rather than structural deformation, because each additional indicator provides independent evidence that reduces the probability of alternative explanations.
The concept of visual proxies is fundamentally different from the concept of non-destructive testing (NDT) methods such as ground-penetrating radar, falling weight deflectometer, or nuclear density gauge. NDT methods provide direct physical measurements of material or structural properties using scientific principles that are independent of surface condition. GPR measures the dielectric properties of the pavement material, which are directly related to density and moisture content through established physical relationships. FWD measures the deflection response of the pavement under a controlled load, which is directly related to structural capacity through layered elastic theory. These NDT methods are not visual proxies because they provide direct physical measurements with known accuracy and precision, even though they require calibration and interpretation by skilled engineers. Visual proxies, by contrast, are based on empirical correlations between surface condition and underlying properties, and their accuracy depends heavily on the specific circumstances of each pavement section. TarmacView incorporates NDT data from GPR, FWD, and other sources when available, integrating these direct measurements with visual observations to provide a comprehensive pavement assessment that maximizes the diagnostic value of all available data.
7. When Lab Testing Is Required
Laboratory testing for lab-only pavement properties is required in a well-defined set of circumstances that are governed by regulatory requirements, engineering standards, contractual obligations, and risk management considerations. Understanding when laboratory testing is mandatory versus when it is optional but recommended is essential for pavement owners and engineers to allocate testing resources efficiently and to ensure compliance with applicable standards. The determination of when laboratory testing is required depends on the purpose of the assessment, the type of pavement facility, the governing regulations, the design requirements, and the observed condition of the pavement.
Scenario
Lab Testing Required
Governing Requirement
Consequences of Non-Compliance
Airport pavement acceptance
Mandatory
FAA P-401, P-501, ICAO Annex 14
Denial of acceptance, withholding of payment, regulatory action
Highway construction QA
Mandatory
AASHTO specifications, FHWA requirements
Rejection of non-compliant work, payment reduction
Forensic failure investigation
Mandatory
ASTM E2011, legal discovery standards
Inadmissible evidence, inability to determine cause
Structural overlay design
Required when material properties unknown
AASHTO Guide for Design of Pavement Structures
Unsafe or uneconomical design
Network-level condition survey
Recommended when visual indicators present
Not mandatory but engineering best practice
Missed deterioration, unexpected failures
Preventive maintenance design
Optional, recommended for major projects
Agency policy dependent
Suboptimal treatment selection
Airport pavement acceptance testing is the most stringent application for laboratory testing requirements. Federal Aviation Administration Specification P-401 for hot-mix asphalt and P-501 for Portland cement concrete require laboratory testing of binder content, gradation, air voids, and moisture susceptibility for every lot of material placed during construction. The FAA requires that at least one core sample be taken and tested for each 450 metric tons (500 tons) of HMA placed on runways and each 900 metric tons (1000 tons) of HMA placed on taxiways and aprons. The core density must achieve a minimum of 96 percent of the laboratory-determined maximum specific gravity for runway surfaces and 95 percent for other pavement surfaces. Binder content must be within plus or minus 0.35 percent of the job mix formula target value, and the TSR must be at least 80 percent for all mixes. These requirements are enforced through the FAA’s acceptance program, which withholds payment for non-compliant lots and can require removal and replacement of deficient material. No visual assessment methodology, regardless of sophistication, can substitute for the laboratory testing required by FAA specifications. The FAA explicitly addresses this in Advisory Circular 150/5370-10H, which states that acceptance of pavement materials is based on laboratory testing of sampled material and that visual inspection, while required for general workmanship observation, does not constitute acceptance testing.
Forensic investigation of premature pavement failure represents another scenario where laboratory testing is mandatory. When a pavement fails before reaching its design life — typically defined as failure before 50 percent of the design traffic or before 10 years of service for a 20-year design — the investigation must determine the root cause of the failure to assign responsibility, determine corrective actions, and prevent recurrence. The forensic investigation standard ASTM E2011 provides guidance on the investigation process, which requires laboratory testing of core samples from the failed pavement. The testing program typically includes binder content (AASHTO T 308 or T 164), gradation (AASHTO T 30), bulk specific gravity and air voids (AASHTO T 166), maximum specific gravity (AASHTO T 209), moisture susceptibility (AASHTO T 283), and, in cases where binder aging is suspected, binder recovery followed by penetration, softening point, and dynamic shear rheometry (AASHTO T 315). The results of this testing program are compared to the original job mix formula and acceptance test results to determine whether the failure resulted from a material deficiency, a construction deficiency, a design deficiency, or an unanticipated loading or environmental condition. Visual inspection of the failed pavement provides important context and documents the failure mode and extent, but it cannot determine the material properties needed to identify the root cause. A forensic investigation that relies on visual inspection alone would be rejected in legal proceedings and would not provide the technical basis needed for corrective action design or claims resolution.
Structural overlay design requires laboratory testing of existing pavement materials when the material properties are unknown or when the overlay design method requires them. The AASHTO Guide for Design of Pavement Structures uses the resilient modulus of the existing HMA layer as an input for overlay thickness design, and the resilient modulus can be determined from laboratory testing of core samples (AASHTO T 307) or from backcalculation of falling weight deflectometer data. When cores are available, laboratory testing provides the most reliable determination of existing material properties, including binder content, gradation, and density, which are required for the design of the overlay mix to be compatible with the existing pavement. When cores are not available, FWD backcalculation provides estimates of layer moduli that can be used for design, but these estimates carry significant uncertainty, particularly for thin HMA layers and for pavements with multiple layers of unknown thickness and material type. The AASHTO design guide recommends laboratory testing whenever the cost of testing is small relative to the cost of the overlay (which it almost always is) and when the consequences of incorrect material property assumptions are significant. For major pavement rehabilitation projects on high-traffic facilities, the cost of a comprehensive coring and laboratory testing program (typically $500 to $2000 per core location, depending on the test suite) is justified by the optimization of the overlay thickness, which can save $50,000 to $500,000 or more per kilometer of pavement, depending on the overlay thickness and width. The use of visual inspection data to estimate existing pavement material properties for overlay design is explicitly cautioned against in the AASHTO design guide and in the FHWA’s overlay design guidance.
8. Integrated Inspection: Visual + Lab + NDT
The most effective pavement assessment methodology integrates visual inspection, laboratory testing of core samples, and non-destructive testing (NDT) data into a unified analysis framework that leverages the strengths of each approach while compensating for their individual limitations. Integrated inspection is based on the principle that no single assessment method provides complete information about pavement condition and that the combination of multiple methods, each with known accuracy and limitations, produces a more reliable and useful assessment than any single method alone. The integration of visual, laboratory, and NDT data follows a tiered approach, with each tier providing specific information that informs the interpretation of the other tiers and guides decisions about additional testing and analysis.
Destructive, point-specific, higher cost, traffic control required
Tier 1, the visual survey, is the starting point for all pavement assessments and provides the broadest coverage at the lowest cost. TarmacView’s automated visual survey using RGB imagery covers 100 percent of the pavement surface area and provides comprehensive identification and quantification of surface distresses at sub-millimeter resolution. The visual survey identifies areas of concern that require further investigation at higher tiers, and the distribution and severity of surface distresses inform the selection of core locations for laboratory testing. Pavements with extensive fatigue cracking in the wheel paths but minimal rutting may require laboratory testing focused on binder aging and stiffness, while pavements with significant rutting and surface deformation may require laboratory testing focused on density and air voids. The visual survey also identifies construction features such as joints, tapers, and patches that affect the structural behavior of the pavement and must be considered in the interpretation of laboratory and NDT results.
Tier 2, the NDT survey, provides intermediate-density data that bridges the gap between the full coverage of visual inspection and the discrete point measurements of laboratory testing. GPR provides continuous coverage of layer thickness and dielectric properties, enabling the identification of areas with anomalous density or moisture content that warrant coring and laboratory testing. FWD provides structural capacity measurements at intervals of approximately 30 to 100 meters along the pavement length, enabling the identification of weak sections and providing the data needed for structural backcalculation of layer moduli. The NDT survey data are calibrated against core measurements from Tier 3, with the GPR dielectric constant correlated with core density and the FWD deflections correlated with core dynamic modulus. The calibration enables the NDT data to be interpreted in terms of absolute material properties rather than relative indicators, significantly increasing the value of the NDT survey for engineering decisions. The NDT survey also provides validation of the visual survey interpretations by identifying conditions that are not visible from the surface, such as stripping within a dense-graded HMA layer that shows minimal surface distress.
Tier 3, laboratory testing, provides the definitive material property measurements required for acceptance, forensic determination, and design. Core samples are extracted at locations selected based on the visual and NDT survey results, ensuring that the core testing program addresses the specific conditions identified in the earlier tiers. The laboratory testing program is designed to answer specific engineering questions: whether binder content is within specification, whether density meets acceptance criteria, whether the mixture is moisture-susceptible, and whether the material properties support the assumed structural capacity. The laboratory results are integrated with the visual and NDT data through statistical correlation and engineering judgment, producing a comprehensive pavement assessment that is more valuable than the sum of its component parts. The integrated assessment provides: identification of specific distress mechanisms with quantified confidence levels; determination of whether observed distresses result from material, construction, structural, or environmental causes; calibrated NDT models that enable continuous prediction of material properties across the entire pavement network; and specific recommendations for rehabilitation, monitoring, or further testing based on the complete assessment.
TarmacView facilitates integrated inspection by providing a data management platform that stores, processes, and visualizes visual, NDT, and laboratory data in a unified geospatial framework. The platform accepts GPR, FWD, and core laboratory data from any standard data format and integrates these data with the visual survey results through a geographic information system (GIS) interface that enables spatial correlation of all assessment data. The integrated data visualization shows pavement sections with visual distress maps overlaid with GPR dielectric profiles, FWD deflection basins, and core laboratory results, enabling engineers to rapidly identify correlations and anomalies across data types. The platform also provides automated statistical analysis tools that calculate correlations between visual, NDT, and laboratory data, quantifying the strength of relationships and identifying conditions where the visual or NDT data are not predictive of laboratory results. This capability enables engineers to confidently use visual and NDT data for screening and prioritization while relying on laboratory data for definitive decisions.
9. Lab Testing Standards
Laboratory testing for pavement materials is governed by a comprehensive framework of standards developed by the American Association of State Highway and Transportation Officials (AASHTO), ASTM International, and international standards organizations such as the International Organization for Standardization (ISO) and the European Committee for Standardization (CEN). These standards define the test procedures, equipment specifications, sample preparation requirements, calculation methods, and precision statements that ensure laboratory test results are consistent and comparable across laboratories, projects, and jurisdictions. Understanding the applicable standards is essential for specifying the correct tests, interpreting test results correctly, and ensuring that test results are accepted by regulatory agencies and contracting authorities.
Standard Number
Standard Title
Measured Property
Typical Precision
Application
AASHTO T 308 / ASTM D 6307
Asphalt Content by Ignition Method
Binder content
±0.11% (single operator)
Quality control, acceptance, forensic
AASHTO T 164 / ASTM D 2172
Asphalt Content by Solvent Extraction
Binder content
±0.26% (multi-laboratory)
Forensic, polymer-modified binder recovery
AASHTO T 166 / ASTM D 2726
Bulk Specific Gravity of Compacted Asphalt
Density, air voids
±0.015 Gsb
Acceptance, structural design
AASHTO T 209 / ASTM D 2041
Maximum Specific Gravity of Asphalt
Theoretical max density
±0.012 Gmm
Density calculation, mix design
ASTM D 6938
In-Place Density by Nuclear Gauge
Field density
±0.008 g/cm³
Quality control during construction
AASHTO T 283
Resistance of Asphalt to Moisture Damage
TSR
±5% TSR
Mix design, acceptance, forensic
AASHTO T 324
Hamburg Wheel Track Test
Rutting and stripping
10-25% CV
Mix design, moisture susceptibility
ASTM D 3203
Air Voids in Asphalt
Air void content
±0.6%
Acceptance, forensic
AASHTO T 307
Resilient Modulus of Asphalt
Dynamic modulus
±15%
Structural design, forensic
AASHTO T 315
Dynamic Shear Rheometer
Binder rheology
±5% G*
Binder aging, forensic
The AASHTO and ASTM standards are developed through consensus processes involving state highway agencies, federal agencies (FHWA, FAA), industry associations (National Asphalt Pavement Association, Asphalt Institute), consulting engineers, and equipment manufacturers. The standards are reviewed and updated on a five-year cycle, with interim revisions issued as needed to address emerging issues such as new binder types, new aggregate sources, or new testing technologies. The precision statements included in each standard are based on inter-laboratory testing programs conducted by the sponsoring organizations, which involve multiple laboratories testing identical materials under standardized conditions and analyzing the results statistically to determine within-laboratory (repeatability) and between-laboratory (reproducibility) precision. These precision statements are essential for interpreting test results, particularly for acceptance testing where the difference between a passing and failing result may be similar in magnitude to the precision of the test method.
The selection of the appropriate testing standard depends on the specific material, the purpose of the testing, and the governing specification. For binder content determination, the ignition oven method (AASHTO T 308) is the primary method for most applications because of its speed, precision, and environmental advantages over solvent extraction. However, solvent extraction (AASHTO T 164) is required when the binder must be recovered for rheological testing, when the aggregate is susceptible to ignition loss (such as limestone with high mass loss at ignition temperatures), or when the specification specifically requires solvent extraction. For density and air voids, the bulk specific gravity test (AASHTO T 166) using the saturated surface-dry method is the standard for dense-graded HMA with absorption less than 2 percent, while the paraffin-coated method (ASTM D 1188) or the vacuum-sealed method (ASTM D 6752) is required for open-graded mixtures or mixtures with high absorption. For moisture susceptibility, AASHTO T 283 is the standard in most US jurisdictions, but AASHTO T 324 (Hamburg) is increasingly specified by agencies with significant moisture damage experience, particularly in the southern and western United States. The Hamburg test is also specified in many European countries under the CEN standard EN 12697-22.
The quality assurance requirements for laboratory testing are established in AASHTO R 18 (Standard Practice for Establishing and Implementing a Quality System for Construction Materials Testing Laboratories) and the ASTM E329 standard for agencies engaged in construction inspection and testing. These quality assurance standards require that testing laboratories maintain documented quality systems, participate in proficiency testing programs, maintain calibrated equipment, and employ qualified technicians with demonstrated competency through programs such as the AASHTO Accreditation Program (AAP) or the AMRL inspection program. Laboratories performing FAA-acceptance testing for airport pavement construction must be accredited by the FAA through the Airport Materials Laboratory Evaluation program, which includes on-site inspections, proficiency testing, and documentation review. Laboratories performing forensic testing for legal proceedings must maintain chain-of-custody documentation, use validated test methods, and provide expert testimony on the test procedures and results. TarmacView recommends that all laboratory testing be performed by accredited laboratories with documented quality systems and qualified personnel, and the platform accepts laboratory data only from sources that meet these quality standards.
10. Communicating Limitations
The communication of assessment limitations is an essential professional responsibility in pavement engineering, governed by the ethical standards of engineering practice and the legal requirements for disclosure of material information. The fundamental principle is that the user of the assessment must be informed of what the assessment can and cannot determine, enabling informed decision-making about the pavement management actions that follow. TarmacView is designed from the ground up with this principle embedded in its reporting architecture, ensuring that the distinction between visually determined condition indicators and lab-only material properties is clearly and consistently communicated to every user of the platform’s output.
The TarmacView reporting system communicates limitations through multiple mechanisms operating at different levels of detail. The executive summary provides a high-level statement of the assessment scope, explicitly listing which pavement condition indicators were assessed using visual methods and which properties were not assessed due to being lab-only. This statement is not buried in fine print or technical appendices but appears prominently in the report’s opening section, where it is seen by every reader regardless of their technical background. The executive summary statement reads: “This assessment is based on automated visual inspection of pavement surface conditions using high-resolution RGB imagery. The following properties are not assessed and require laboratory testing of core samples: asphalt binder content, in-place density and air voids, moisture damage and stripping resistance, and material mechanical properties. Where surface conditions consistent with deficiencies in these properties have been identified, laboratory testing is recommended and flagged in the detailed report sections.”
At the detailed level, each condition indicator in the TarmacView report includes a confidence rating that reflects the reliability of the visual determination. The confidence rating is expressed as a qualitative label — “High,” “Medium,” or “Low” — accompanied by a quantitative probability range where applicable. High-confidence indicators are those that can be directly measured from the image with high accuracy, such as crack width, crack length, spall area, and patch area. These measurements are supported by photogrammetric calibration and validation against reference measurements. Medium-confidence indicators are those that can be identified with reasonable accuracy but have greater measurement uncertainty, such as rut depth from photogrammetry, surface texture classification, and raveling severity. Low-confidence indicators are those that are inferred from visual proxy conditions rather than directly measured, such as potential stripping based on raveling and cracking patterns, potential density issues based on rutting, and potential binder content issues based on surface appearance. Each low-confidence indicator includes a recommendation for laboratory testing to confirm or refute the inferred condition.
The TarmacView report also includes a dedicated “Limitations and Further Actions” section that provides specific guidance on the laboratory testing recommended for each flagged condition. This section is organized by pavement section and condition type, with clear recommendations for the number and location of core samples, the specific laboratory tests to be performed, the applicable standards, and the acceptance criteria. For example, a pavement section with moderate rutting and raveling in the wheel paths would include a recommendation for three core samples in the affected area, tested for bulk specific gravity (AASHTO T 166), binder content (AASHTO T 308), and moisture susceptibility (AASHTO T 283). The report estimates the cost and timeline for the recommended laboratory testing, enabling the pavement owner to budget for the testing and schedule the work. This level of specificity distinguishes TarmacView from generic pavement assessment platforms that provide broad recommendations without actionable detail.
The communication of limitations extends to the regulatory and contractual implications of the assessment. For airport pavement assessments subject to FAA regulation, the TarmacView report explicitly states that the visual assessment does not satisfy FAA requirements for material acceptance testing, that laboratory testing per FAA P-401 or P-501 is required for acceptance, and that the visual assessment is intended for condition monitoring and maintenance planning rather than regulatory compliance. For forensic investigations, the report states that the visual assessment provides preliminary identification of potential failure mechanisms but that definitive determination of the root cause requires laboratory testing in accordance with ASTM E2011. For structural overlay design, the report states that the visual assessment provides surface condition data that inform the overlay design strategy but that the material properties required for structural thickness design must be determined from core testing or FWD backcalculation.
The TarmacView platform also provides tools for communicating limitations to non-technical stakeholders, including pavement owners, airport managers, and public works officials. The platform generates a non-technical summary that explains in plain language what the assessment found, what it did not find, and what additional testing is needed. The summary avoids technical jargon and focuses on actionable recommendations, such as “The visual inspection found cracking and surface weathering on Taxiway B. To determine whether the asphalt mix needs to be replaced or can be overlaid, we recommend taking three core samples for laboratory testing. These tests will determine the asphalt content, density, and moisture resistance of the existing pavement, which are needed to design the repair.” This plain-language summary is supported by the comprehensive technical report for the engineering team, ensuring that all stakeholders have the information they need at the appropriate level of technical detail.
The ethical and professional obligation to communicate limitations is not merely a matter of customer service or risk management but a fundamental requirement of engineering practice under the codes of ethics of the American Society of Civil Engineers (ASCE), the National Society of Professional Engineers (NSPE), and the International Federation of Consulting Engineers (FIDIC). These codes require that engineers express opinions only on matters in which they are competent, disclose known limitations of their work, and avoid making unsupported claims about the capabilities of their methods or tools. TarmacView’s approach to communicating limitations is consistent with these ethical requirements and reflects the engineering culture of transparency and professional responsibility that distinguishes credible pavement assessment from marketing-driven claims. By clearly stating what can and cannot be determined from visual inspection, and by providing specific guidance on the laboratory testing needed to fill the gaps, TarmacView enables pavement owners and engineers to make informed decisions based on complete and accurate understanding of their pavement condition and the assessment methods used to determine it.
Frequently Asked Questions
Lab-only properties include asphalt binder content (requires ignition oven or solvent extraction per AASHTO T 308 or ASTM D 6307), in-place density and air voids (requires core sampling with AASHTO T 166 or nuclear density gauge per ASTM D 6938), and moisture damage/stripping resistance (requires AASHTO T 283 tensile strength ratio or Hamburg wheel tracking per AASHTO T 324). These cannot be determined from surface photographs or RGB imagery alone.
Asphalt binder content is the percentage of bitumen by weight in the hot-mix asphalt mixture. Visual inspection can only observe surface binder-related distress such as bleeding or flushing — which indicate excess binder at the surface — but cannot quantify the total binder content throughout the pavement layer. The binder is distributed throughout the thickness, mixed with aggregate at a microscopic level. Determining binder content requires burning off or dissolving the binder in a laboratory and measuring the mass difference.
GPR can provide continuous estimates of relative dielectric constant, which correlates with density and air voids, but it is a comparative tool, not an absolute measurement. GPR must be calibrated against known core measurements from the same pavement section. The FHWA and multiple studies (MDPI Sensors 2024, Geophysical 2019) confirm GPR is excellent for detecting density variations across a project but cannot replace laboratory bulk specific gravity testing (AASHTO T 166) for absolute density values.
A visual proxy is a surface-visible phenomenon that suggests an underlying condition. For example, surface cracking may indicate fatigue damage, or surface rutting may indicate insufficient density or binder content. However, visual proxies are indirect indicators with significant uncertainty. TarmacView uses AI to quantify these visual proxies but explicitly notes that lab-only properties must be verified through coring and laboratory testing for definitive diagnosis.
Laboratory testing is mandatory for airport pavement acceptance per FAA P-401 (asphalt binder content, gradation, air voids), for forensic investigations when determining root cause of premature failure, for structural overlay design when existing pavement material properties are unknown, for quality assurance in new construction, and for regulatory compliance under ICAO Annex 14 and FAA AC 150/5320-6G which require documented material properties for pavement strength reporting.
Key standards include: AASHTO T 308 / ASTM D 6307 (binder content by ignition), AASHTO T 164 / ASTM D 2172 (binder content by solvent extraction), AASHTO T 166 / ASTM D 2726 (bulk specific gravity), ASTM D 6938 (nuclear density gauge), ASTM D 7113 (non-nuclear density gauge), AASHTO T 283 (moisture damage TSR), AASHTO T 324 (Hamburg wheel tracking), and ASTM D 3203 (air voids calculation).
TarmacView's condition assessment reports explicitly delineate which pavement condition indicators are derived from visual inspection (cracking, spalling, surface defects, FOD, surface rutting) versus which properties require laboratory testing (binder content, density, air voids, stripping susceptibility). This transparent boundary ensures engineering credibility and helps clients plan appropriate follow-up coring and laboratory testing programs where needed.
Need Professional Pavement Assessment?
TarmacView combines AI-powered visual inspection with clear identification of lab-only measurements requiring core sampling and laboratory testing. Our condition reports explicitly state the boundaries of image-based assessment.
Crack Area Percentage in Pavement and Structural Assessment
Crack area percentage (crack_area_pct) is the ratio of crack mask area to total analyzed image area, expressed as a percentage. It is a key quantitative severit...
TarmacView's surface quality grading assigns an ordinal 1-5 rating (1=Excellent, 5=Very Bad) based on cosine kNN majority vote against a fine-tuned DINOv3 refer...
Visual Proxy in Image-Based Infrastructure Assessment
Visual proxies are image-observable surface indicators that approximate material properties or structural conditions typically requiring laboratory testing or i...
31 min read
assessment
inspection
+3
Cookie Consent We use cookies to enhance your browsing experience and analyze our traffic. See our privacy policy.