Approach Slope
A comprehensive glossary entry on the aviation concept of approach slope, including definitions, associated concepts (glide slope/path, pitch angle, angle of at...
7 min read
Aviation
Approach
+5
Longitudinal grade is the slope of pavement along the direction of travel, critical for drainage, sight distance, and aircraft operational performance on runways. Grade changes beyond specifications cause operational issues and water accumulation. Covers ICAO runway grade requirements, measurement, and inspection for grade changes from differential settlement.

Longitudinal grade — also referred to as profile grade, running slope, or simply grade — is the slope of a pavement surface measured along its longitudinal axis, in the direction of vehicular or aircraft travel. It is expressed as a percentage calculated by dividing the vertical rise or fall by the horizontal distance and multiplying by 100. A longitudinal grade of 1% means the pavement elevation changes by 1 unit vertically for every 100 units horizontally — for example, a 1 m elevation change over 100 m of runway length.
The mathematical expression of longitudinal grade is:
G = (ΔElevation / ΔDistance) × 100%
Where G is the grade in percent, ΔElevation is the change in elevation (positive for uphill, negative for downhill relative to the direction of travel), and ΔDistance is the horizontal distance over which the elevation change occurs.
Longitudinal grade serves three primary functions on airport pavements. First, it provides surface drainage along the pavement length. Water falling on the pavement surface flows along the longitudinal grade toward collection points such as inlets, catch basins, or pavement edges where cross-slope carries it to side ditches. Without adequate longitudinal grade, surface water would pond on the pavement, creating operational hazards. Second, longitudinal grade directly affects aircraft performance during takeoff and landing. An uphill grade increases takeoff distance because the aircraft must overcome the gravitational component of the slope. A downhill grade reduces takeoff distance but increases landing distance. For each 1% of runway grade, takeoff distance can change by 5-10% depending on the aircraft type and operating conditions. Third, longitudinal grade influences pilot sight distance along the runway. Steep grades or abrupt grade changes can limit the pilot’s ability to see the far end of the runway or other aircraft on the pavement, which is critical for safe ground operations.
Longitudinal grade must be distinguished from cross-slope (transverse slope), which is the slope measured perpendicular to the direction of travel. Cross-slope governs lateral drainage across the pavement width and vehicle stability in turns. On runways, cross-slope typically ranges from 1.0% to 1.5% for concrete pavements and 1.5% to 2.0% for asphalt pavements. Longitudinal grade and cross-slope work together as a two-directional drainage system — longitudinal grade conveys water along the runway centerline, while cross-slope moves water from the centerline toward the edges.
The design of longitudinal grade involves a fundamental tension between drainage requirements and operational constraints. Steeper grades improve drainage by increasing flow velocity and reducing water film depth — the Manning equation for open channel flow shows that flow velocity is proportional to the square root of the slope. However, steeper grades degrade aircraft performance, increase fuel consumption during takeoff, extend landing distances, and create pilot visibility limitations. The design process must balance these competing factors to produce a grade profile that satisfies all operational requirements within the constraints of the existing terrain.
ICAO Annex 14 — Aerodromes, Volume I establishes the international standards and recommended practices for runway geometric design, including longitudinal grade. These requirements are organized by the Aerodrome Reference Code, which classifies runways based on two components: Code Number (1 through 4) based on aircraft reference field length, and Code Letter (A through F) based on aircraft wingspan and outer main gear wheel span.
The maximum allowable longitudinal grade on a runway is determined by the code number component of the Aerodrome Reference Code, as specified in ICAO Annex 14, Table 3-1:
| Code Number | Reference Field Length | Maximum Longitudinal Grade |
|---|---|---|
| 1 | Less than 800 m | 1.25% |
| 2 | 800 m to less than 1200 m | 1.25% |
| 3 | 1200 m to less than 1800 m | 1.0% |
| 4 | 1800 m or greater | 1.0% |
For Code Number 1 and 2 runways, which typically serve smaller aircraft operating from shorter runways, the maximum longitudinal grade is 1.25%. These airports often have more challenging terrain constraints — smaller sites have less flexibility for grading to meet the 1% standard, and the shorter runway lengths reduce the total elevation change that a 1.25% grade produces over the runway length.
For Code Number 3 and 4 runways, which serve larger commercial and transport-category aircraft with reference field lengths of 1200 m or more, the maximum longitudinal grade is reduced to 1.0%. The stricter requirement reflects the higher operating speeds, heavier weights, and greater performance sensitivity of larger aircraft. A 1% grade on a 3000 m runway produces a total elevation change of 30 m from end to end, which already creates significant aircraft performance effects.
ICAO Annex 14 includes an additional restriction specifically for Code Number 4 runways (the largest category). Where the code number is 4, the longitudinal slope should not exceed 1.25% for the first and last quarter of the runway length. This means that on a 3600 m runway, the first 900 m from each threshold are limited to a maximum grade of 0.8% — 1.25% at the most. This restriction recognizes that the runway ends are the most critical zones for aircraft operations. Takeoff ground roll begins at the threshold with the aircraft at or near maximum takeoff weight, and the initial acceleration phase is most sensitive to uphill grades. Similarly, the landing rollout and deceleration phase in the final quarter of the runway is most sensitive to downhill grades that reduce braking effectiveness.
The end-quarter grade restriction also supports obstacle clearance requirements for instrument approach procedures. The approach surface, which begins at the runway threshold and extends outward and upward, must remain free of obstructions. High runway grades near the threshold can create conflicts between the approach surface and terrain or infrastructure.
Longitudinal grade changes — transitions from one grade to another — are subject to stricter control than the maximum grade itself. ICAO Annex 14 specifies that when a longitudinal grade change on a runway is unavoidable, the transition between two consecutive slopes must be accomplished through a vertical curve with the following minimum radius requirements:
| Code Letter | Maximum Grade Change Rate | Minimum Vertical Curve Radius |
|---|---|---|
| A or B | 1% per 25 m | 2,500 m |
| C, D, E, or F | 1% per 30 m | 3,000 m |
The 1% per 30 m (or 1% per 25 m) rate means that the grade must not change by more than 1% over any 30 m (or 25 m) segment of the runway. This effectively ensures that the vertical curve radius is no smaller than the specified minimum. A grade change of 2% — for example, from +1.0% to -1.0% — would require a vertical curve with a radius of at least 3,000 m and a length of at least 60 m for code letters C through F.
These grade change requirements serve three purposes. Aircraft tail clearance — abrupt grade changes at the point where the aircraft rotates for takeoff could cause the tail section to strike the runway surface. The Boeing 737, for example, has a tail strike angle of approximately 10-12 degrees, and grade changes must be gradual enough that the aircraft attitude during rotation does not exceed this limit. Pilot visibility — grade changes creating convex vertical curves (crest curves) can obscure the far end of the runway from the pilot’s eye height, particularly during landing flare. Vertical acceleration — abrupt grade changes produce vertical acceleration that can affect passenger comfort, cargo restraint, and aircraft structural loading. A grade change rate of 1% per 30 m corresponds to a centripetal acceleration of approximately 0.017g at typical landing speeds, which is within acceptable comfort limits.
The number of grade changes along a runway is also restricted. ICAO Annex 14 recommends that the distance between points of intersection of two successive vertical curves should be at least 45 m multiplied by the sum of the absolute grade changes. This ensures that grade transitions are spaced sufficiently far apart to avoid compounding vertical acceleration effects and to provide stable sight distance zones.
A vertical curve on a runway is a parabolic transition between two straight longitudinal grades. The purpose of the vertical curve is to provide a smooth, gradual change from one grade to another rather than an abrupt angular break that would create operational hazards. The geometry of a vertical curve is defined by three parameters: the initial grade (G₁), the final grade (G₂), and the length of the vertical curve (L).
The algebraic difference in grades, A = |G₂ - G₁|, determines the sharpness of the curve. For a given curve length L, a larger value of A produces a sharper transition. The minimum curve length required by ICAO Annex 14 is determined by the minimum radius requirement. For a parabolic vertical curve, the minimum length is related to the minimum radius by:
L_min = A × R_min / 100
Where A is the algebraic grade change in percent and R_min is the minimum radius in meters. For example, for code letter E with A = 2% and R_min = 3,000 m, the minimum vertical curve length is L_min = 2 × 3000 / 100 = 60 m.
ICAO Annex 14 specifies minimum radii of vertical curves for runways based on the Aerodrome Reference Code:
| Code Number | Code Letter | Minimum Radius of Vertical Curve |
|---|---|---|
| 4 | F | 30,000 m |
| 4 | C, D, E | 18,000 m |
| 3 | All | 15,000 m |
| 1 or 2 | All | 7,500 m |
The extremely large radius for Code 4F runways — 30,000 m — reflects the operating characteristics of very large aircraft like the Airbus A380 and Boeing 747-8. These aircraft have longer fuselage lengths (73 m for the A380) and higher tail strike risk during rotation. A 30,000 m radius vertical curve produces a maximum vertical acceleration of only 0.0003g at typical landing speeds — virtually imperceptible to passengers and crew.
For Code 4 runways serving code letters C, D, or E — the most common category for major commercial airports serving aircraft like the Boeing 737, 767, 777, and Airbus A320, A330, A350 families — the minimum radius is 18,000 m. This provides adequate protection for tail clearance during rotation while accommodating the terrain constraints that often exist at airport sites.
Vertical curves on runways should be located to avoid critical operational zones. ICAO recommends that no vertical curve should be placed within 75 m of a runway end for code numbers 3 and 4, and within 45 m for code numbers 1 and 2. This ensures that the runway threshold area — where the aircraft touches down or begins its takeoff roll — has a consistent, predictable grade. Grade transitions near thresholds could cause the pilot to misjudge the flare height during landing or create uneven dynamic loading on landing gear at the critical touchdown moment.
The vertical curve must also be positioned to maintain adequate sight distance along the runway. On convex (crest) curves, the vertical curve restricts the distance at which a pilot at standard eye height (typically 1.5 m above the pavement for transport aircraft) can see another aircraft or vehicle on the runway surface. The required sight distance is a function of the operating speed and the grade change magnitude. For Code 4 runways, the minimum sight distance is the runway length or the distance required to see an object 1 m high from a pilot eye height of 1.5 m — whichever is less demanding.
Sight distance along a runway longitudinal grade is a critical safety parameter that governs the pilot’s ability to detect and react to obstacles, other aircraft, or vehicles on the runway surface. The FAA Advisory Circular AC 150/5300-13B — Airport Design specifies line-of-sight (LOS) requirements for runways based on the Runway Design Code (RDC).
For visual runways (those used for visual approaches only), FAA standards require that any point on the runway surface be visible from any other point on the runway. This ensures that a pilot landing on the runway can see an aircraft or vehicle that has entered the runway from an intersecting taxiway or from the opposite threshold. The standard is absolute — no hidden dips, crests, or grade reversals are permitted that would block the sight line between any two points on the runway pavement.
For instrument runways, the sight distance requirement is more nuanced. FAA standards require that from any point on the runway, a pilot at an eye height of 3.5 m (for approach categories C, D, and E) or 1.5 m (for categories A and B) can see the entire runway surface. The higher eye height for larger aircraft reflects the taller cockpit position of transport-category aircraft. The sight line must clear all obstructions — including the pavement surface itself on crest vertical curves — with a minimum clearance of 0.3 m (1 ft) for safety.
The relationship between longitudinal grade and sight distance on crest vertical curves is governed by the following geometric relationship. For a crest curve where the sight distance S is less than the curve length L:
L = (A × S²) / (200 × (√h₁ + √h₂)²)
Where A is the algebraic grade difference in percent, h₁ is the pilot eye height (m), h₂ is the object height (m), and S is the required sight distance (m). For runway applications, the critical case is seeing an object 1.0 m high (representing a vehicle or aircraft tail) from a pilot eye height of 1.5 m (small aircraft) or 3.5 m (large aircraft).
This formula demonstrates that larger grade changes A require longer vertical curves L to maintain adequate sight distance. For a Code 4 runway with aircraft approach category C, D, or E (pilot eye height 3.5 m) and a grade change of 2.0%, the minimum crest curve length to maintain sight distance to a 1.0 m object is approximately 270 m — substantially longer than the minimum vertical curve lengths required by ICAO for vertical acceleration and tail clearance alone.
Measuring longitudinal grade on airport pavements requires survey methods that provide sufficient accuracy to detect deviations from design specifications. The required measurement accuracy depends on the application: construction quality control typically requires ±2-3 mm vertical accuracy, acceptance testing requires ±3-5 mm accuracy, and routine inspection for grade changes from settlement can tolerate ±5-20 mm accuracy depending on the severity of the anticipated deviations.
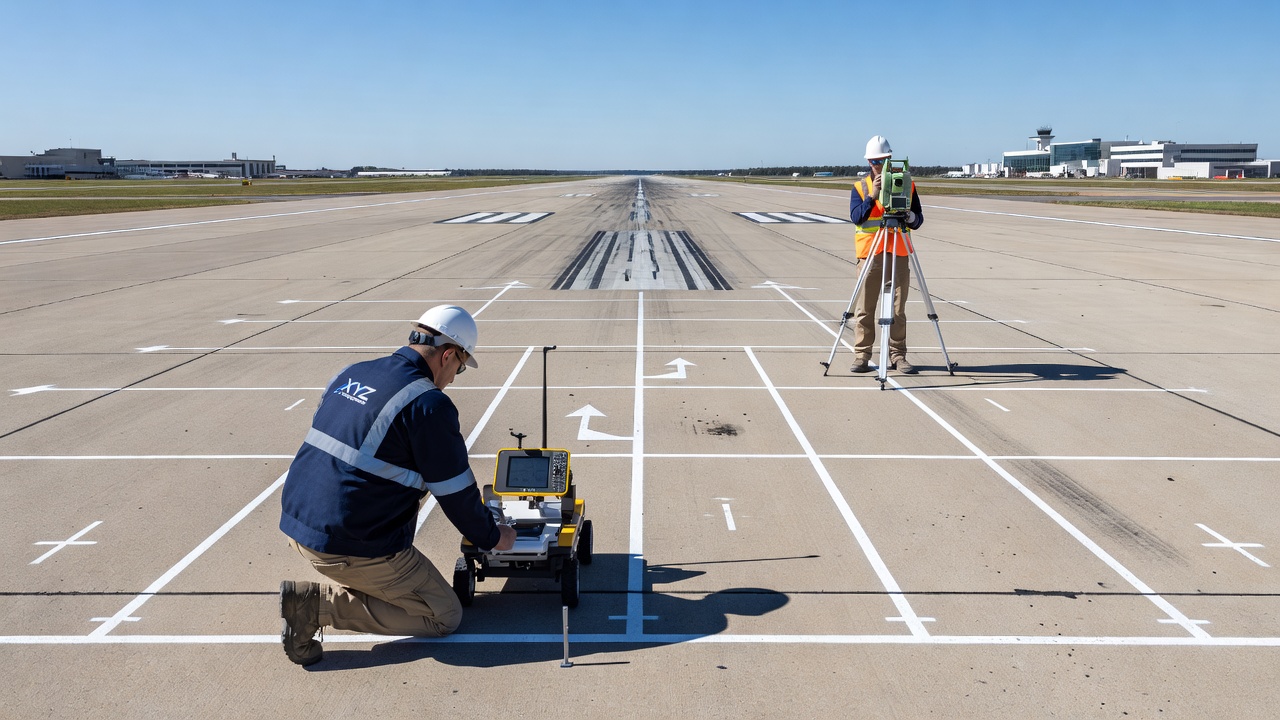
First-Order, Class I level surveys provide the highest accuracy for longitudinal grade measurement, achieving a closure tolerance of ±0.3√K mm where K is the distance in kilometers. The survey uses an optical or digital automatic level with a compensator (typically accurate to ±0.3 arc-seconds) and a calibrated invar-strip leveling rod. The survey establishes a closed loop of benchmarks on stable deep foundations (typically driven piles or bedrock piers) and measures elevation at grade points spaced at intervals of 5-30 m along the runway centerline and sometimes along each edge.
The survey methodology follows ASTM E1364 — Standard Test Method for Measuring Road Roughness by Static Level Method. Class 1 profile measurement requires profile error less than 2% of IRI and is used for forensic investigations and acceptance testing of new construction. Class 2 (profile error less than 5% of IRI) is suitable for routine condition assessment and pavement management.
The output of a level survey is a longitudinal profile — a plot of elevation versus distance along the runway. From this profile, the actual grade at each segment is calculated as the elevation difference between adjacent survey points divided by the horizontal distance. The comparison of actual grade to design grade reveals zones where settlement, heave, or construction defects have altered the pavement geometry.
Terrestrial LiDAR (Light Detection and Ranging) and aerial LiDAR provide the most comprehensive grade measurement capability, capturing continuous surface profiles from dense point clouds with typical vertical accuracy of ±2-6 mm. Terrestrial laser scanners emit up to 1 million laser pulses per second and measure the time-of-flight return to calculate three-dimensional coordinates. Mobile LiDAR systems mounted on vehicles can survey an entire runway at speeds of 30-60 km/h, collecting point clouds with a density of 100-500 points per square meter.
The point cloud data is processed to extract the longitudinal profile along the runway centerline and any desired offset lines (edge lines, wheelpath lines). Digital Elevation Models (DEMs) generated from the point cloud provide a continuous elevation surface from which grade is calculated at any point. Change detection between sequential LiDAR surveys identifies grade changes as small as 1-5 mm per year, revealing progressive differential settlement before it reaches critical thresholds.
For airport applications, the FAA Airport Technology Research and Development Branch has validated the use of LiDAR for pavement geometry assessment. Studies at multiple US airports have demonstrated that LiDAR-derived grade measurements compare favorably with conventional survey methods, with the advantage of providing complete spatial coverage rather than discrete point measurements. The research confirms that grade changes from settlement zones as shallow as 3-5 mm can be reliably detected in LiDAR data with proper survey control.
Real-Time Kinematic (RTK) GPS provides vertical accuracy of ±2-5 cm with a base station and rover configuration. The base station broadcasts correction data to the rover, eliminating atmospheric and satellite orbit errors through differential correction. Network RTK services using multiple reference stations achieve vertical accuracies approaching ±1-2 cm in areas with good cellular coverage.
RTK GPS is well suited for large-area grade surveys where point-to-point relative accuracy is more important than absolute elevation accuracy. A single surveyor with an RTK rover can collect 500-1000 elevation readings per hour across an airfield pavement network, making it the most efficient method for general condition assessment. The technique is less accurate than optical leveling or LiDAR for detecting small grade changes but fully adequate for identifying settlement zones requiring further investigation.
The Vertical Precision (VPR) of RTK GPS is limited by satellite geometry (measured by Position Dilution of Precision, PDOP), multipath interference from adjacent structures, and atmospheric conditions. For optimal grade measurement, surveys should be conducted with PDOP below 3, at least 6 satellites in view, and a minimum of 5-minute occupation times at each point to average the vertical readings.
Inertial profilers measure pavement longitudinal profile at traffic speeds using accelerometers to establish an inertial reference and laser sensors to measure the vertical distance from the vehicle body to the pavement surface. The accelerometer tracks the vertical movement of the vehicle body as it traverses the pavement, and the laser displacement sensors measure the instantaneous height between the vehicle and pavement. By combining these two measurements, the profiler computes the absolute pavement elevation profile.
Inertial profilers operate under ASTM E950 — Standard Test Method for Measuring the Longitudinal Profile of Traveled Surfaces. The standard defines four accuracy classes based on the root-mean-square (RMS) profile error:
| ASTM E950 Class | RMS Profile Error | Typical Application |
|---|---|---|
| Class 1 | Less than 2.5 mm/km | Research, certification |
| Class 2 | 2.5 to 5.0 mm/km | Acceptance testing |
| Class 3 | 5.0 to 10.0 mm/km | Network-level survey |
| Class 4 | Greater than 10.0 mm/km | Screening survey |
The profiler output includes the International Roughness Index (IRI), expressed in m/km, which correlates well with ride quality and pavement condition. For airport pavements, FAA specifies acceptable IRI thresholds in AC 150/5380-6C: IRI below 2.5 m/km indicates good surface condition, 2.5-4.0 m/km indicates fair condition requiring monitoring, and IRI above 4.0 m/km indicates poor condition requiring investigation. Longitudinal grade changes from differential settlement produce localized IRI spikes that are readily identifiable in the roughness profile.
Profilographs — multi-wheeled mechanical devices that physically trace the pavement surface — provide a graphical record of longitudinal profile. The California-type profilograph uses a 7.6 m (25 ft) frame with a wheel at each end and a recording wheel at the center. As the device moves along the pavement, the center wheel records deviations from the frame reference line. The output is a Profile Index (PI), calculated as the cumulative deviation from the reference line per unit distance, typically expressed in mm/km.
Unmanned Aerial Vehicle (UAV) photogrammetry uses structure-from-motion algorithms to process overlapping photographs into three-dimensional models. With proper ground control, the vertical accuracy can reach ±2-5 cm — comparable to RTK GPS but with vastly greater spatial density. A single drone flight can survey a 3000 m runway in 15-20 minutes, collecting 500-1000 overlapping images processed into a point cloud containing 50-100 million points.
The photogrammetric workflow begins with mission planning using flight planning software that sets flight altitude (typically 50-120 m AGL), forward overlap (70-80%), and side overlap (60-70%). Ground Control Points (GCPs) of at least 5 per hectare are placed at surveyed locations and used to georeference the model. The images are processed in photogrammetry software (such as Agisoft Metashape, Pix4D, or RealityCapture) that detects common features across overlapping images, computes camera positions, and generates a dense point cloud.
From the point cloud, a Digital Surface Model (DSM) is generated at a resolution of 2-10 cm per pixel. The longitudinal grade profile is extracted along any desired path on the DSM by sampling elevations at intervals of 0.5-2.0 m. The resulting profile can be compared to design grades or to profiles from previous surveys to detect grade changes.
The FAA Airport Technology R&D program has conducted extensive validation of drone-based photogrammetry for pavement inspection, concluding that with 2 mm/pixel ground sample distance, drone surveys can detect pavement distresses and geometry changes with equivalent accuracy to traditional foot-on-ground inspection. Grade changes as small as 5-10 mm can be reliably detected with proper GCP control.
Differential settlement is the most common cause of longitudinal grade changes in existing airport pavements. When the subgrade or underlying pavement layers settle unevenly — by different amounts at different locations — the pavement surface deforms into a depression that alters the longitudinal grade profile. These grade changes can range from a few millimeters to tens of centimeters, depending on the magnitude of the settlement and the extent of the affected area.
Differential settlement produces a characteristic grade reversal — the pavement surface transitions from the design grade to a localized steeper grade (increased slope), then levels out at the bottom of the depression, then transitions back to the design grade through a reverse slope. At the margins of the settlement zone, the local grade can be 2-3 times the design grade, creating localized steep sections that violate ICAO grade change criteria even though the overall runway grade remains within limits.
The relationship between settlement magnitude and grade change depends on the wavelength of the settlement depression. A shallow, broad settlement (e.g., 10 mm over 50 m) produces a grade change of only 0.04% — negligible for operational purposes. A sharp, localized settlement (e.g., 20 mm over 5 m) produces a grade change of 0.8% — significant and potentially exceeding ICAO criteria for grade change rates. The critical parameter is angular distortion (δ/L), where δ is the settlement magnitude and L is the horizontal distance over which the settlement occurs.
For airport pavements, the FAA Pavement Condition Index (PCI) methodology (ASTM D5340) identifies settlement-related distress as “Depression” — a localized low area of the pavement surface. Depression severity is classified as:
| Severity | Vertical Deviation | Typical Grade Change | Operational Impact |
|---|---|---|---|
| Low | 6-13 mm | 0.1-0.5% | Minor ride quality effect |
| Moderate | 13-25 mm | 0.3-1.0% | Noticeable ride degradation, water ponding |
| High | Greater than 25 mm | 0.5-2.0% | Significant operational impact, FOD risk |
Variable subgrade conditions — lateral changes in soil type, stiffness, or compressibility across the pavement footprint cause differential settlement as different soil zones compress differently under the same surface loads. A transition from dense glacial till to soft alluvial clay, for example, can produce differential settlement of 25-75 mm over a distance of 30-60 m, creating grade changes of 0.1-0.3%.
Poor compaction during construction — subgrade zones compacted below specified density (typically 95% of Modified Proctor maximum dry density per ASTM D1557) undergo further densification under traffic loading. Loose zones can consolidate by 10-30 mm under heavy aircraft traffic, producing localized grade changes of 0.2-0.6%.
Expansive clay subgrade — cyclic wet-dry cycles in expansive soils (PI above 35, Expansion Index above 90) produce seasonal heave and settlement movements of 10-50 mm. The differential movement produces grade changes that fluctuate seasonally, making single-survey assessment unreliable. Multiple surveys over different seasons are required to characterize the full amplitude of movement.
Frost heave and thaw weakening — in cold climates, segregated ice lens formation can lift pavement by 25-150 mm during winter. Spring thaw releases this water into the subgrade, reducing soil resilient modulus (Mr) by 50-90% and causing differential settlement under traffic. The resulting grade changes can exceed 1.0% in the first traffic season after thaw.
Consolidation of soft subgrade — saturated fine-grained soils under embankment fills undergo time-dependent consolidation that can continue for 5-25 years after construction. Primary consolidation settlement of 50-200 mm is common in soft clay subgrades, producing grade changes of 0.3-1.0% along settlement transitions.
Leaking utilities and undermining — subsurface erosion from leaking water mains, sanitary sewers, or drainage pipes washes fine soil particles away, creating voids beneath the pavement. When these voids collapse or the pavement bridges them, sudden grade changes of 1-5% can occur over short distances — among the most dangerous grade defects because of their abruptness.
Excessive longitudinal grade — whether from design limitations, construction defects, or differential settlement — creates multiple operational and safety hazards on airport pavements.
Each 1% of runway grade changes takeoff and landing distances by approximately 5-10% depending on aircraft type and weight. For a Boeing 737-800 at maximum takeoff weight from a 3000 m runway, a persistent 1% uphill grade increases the takeoff distance by approximately 200-300 m — representing a 7-10% distance penalty. This can reduce the maximum allowable takeoff weight or require the use of declared distances (Takeoff Run Available, Takeoff Distance Available, Accelerate-Stop Distance Available) that restrict payload.
For downhill landings, the effect is reversed but equally significant. A 1% downhill grade increases landing distance by approximately 5-10% because the aircraft must dissipate both its forward kinetic energy and the gravitational potential energy from the descent along the slope.
The FAA requires that takeoff and landing performance calculations account for runway grade through the Airplane Flight Manual (AFM) performance data. Aircraft performance engineers apply correction factors for runway grade, and dispatch decisions must respect the corrected performance limits. Grade changes that develop over time from settlement can render previously acceptable runways marginal for certain aircraft operations without the airport operator being immediately aware of the change.
Longitudinal grade changes that create ponding zones — localized depressions where water accumulates — produce hydroplaning hazards for aircraft. When standing water on the runway surface exceeds approximately 3 mm in depth, aircraft tires at speeds above 70 knots can experience dynamic hydroplaning, where the tire rides on a water layer with zero pavement contact. At this point, braking effectiveness is essentially eliminated, directional control is lost, and the aircraft can skid uncontrollably.
The FAA Advisory Circular AC 150/5320-5C — Airport Drainage Design provides guidance on acceptable water film depths. For runways used by transport-category aircraft, the design should limit ponding to water depths below 3 mm within the critical operating zone (central 2/3 of the runway length). Longitudinal grade changes that produce depressions exceeding 3 mm in depth require correction or, at minimum, the application of grooving or porous friction course overlay to provide water escape paths for tire footprint pressures.
The relationship between ponding depth and grade change is direct. A depression producing a 5 mm ponding depth requires a grade reversal of at least 0.5-1.0% at the depression edges to confine the ponding area. The severity of the hazard depends not only on the depth but also on the extent of the ponded area — a shallow pond over a large area can be more dangerous than a deep pond over a small area because it affects a longer segment of the landing rollout.
Excessive grade changes can generate Foreign Object Debris (FOD) through several mechanisms. Joint faulting — vertical offsets at pavement joints from differential settlement — creates slab edges that can break under traffic load, producing loose concrete fragments that become FOD. Tensile cracking from grade-induced bending stresses in the pavement slab produces crack edges that spall under traffic, generating aggregate-sized debris. Surface disintegration in depressed zones where water ponding has weakened the pavement surface produces loose material that aircraft jet blast can scatter across the runway.
The FAA AC 150/5380-6C specifies that pavement surface deviations exceeding 6 mm under a 4.5 m straightedge create FOD risk and require investigation. For joint faulting on runways, the severity thresholds are:
| Severity | Vertical Offset | FOD Risk |
|---|---|---|
| Low | Less than 6 mm | Minimal |
| Moderate | 6 to 13 mm | Moderate — monitoring required |
| High | Greater than 13 mm | High — immediate repair needed |
Longitudinal grade changes produce vertical acceleration that affects passenger comfort, cargo restraint, and aircraft structural fatigue. The vertical acceleration a_v experienced by an aircraft traversing a vertical curve at speed V is:
a_v = V² / R
Where V is the speed in m/s and R is the vertical curve radius in meters. For a grade change of 1% per 30 m (the ICAO limit), the equivalent vertical curve radius is approximately 3,000 m. At a landing speed of 70 m/s (approximately 136 knots), the vertical acceleration is:
a_v = (70)² / 3000 = 1.63 m/s² ≈ 0.17g
This acceleration is within acceptable limits for passenger comfort (typically 0.2-0.3g for vertical acceleration). However, settlement-induced grade changes that concentrate the grade transition over shorter distances — for example, a fault at a joint producing 15 mm offset over 1 m — produce instantaneous vertical accelerations of 5-10 m/s² that can cause passenger injury, cargo shift, and aircraft structural fatigue.
The Aircraft Classification Number/Pavement Classification Number (ACN/PCN) system used for airport pavement load rating does not directly account for grade-induced dynamic loading. However, excessive grade changes that cause dynamic impact loading can effectively increase the load on the pavement above the static gear load, accelerating pavement deterioration in the settlement zone.
Settlement-induced grade changes on crest vertical curves can reduce pilot sight distance below acceptable thresholds. A depression on a convex vertical curve effectively reduces the crest curve radius, shortening the distance at which a pilot can see the runway surface ahead. In extreme cases — settlement depressions of 50-100 mm over 30-50 m — the sight distance can be reduced by 20-30%, potentially violating the requirement for any point on the runway to be visible from any other point.
Drone-based inspection for longitudinal grade changes has become a standard practice at major airports worldwide, offering significant advantages over traditional ground-based survey methods in coverage speed, spatial density, and operational safety.
A drone-based longitudinal grade inspection follows a structured workflow:
Mission planning — the runway is divided into flight blocks that respect airspace restrictions and allow for safe battery management. Flight altitude is set to achieve the required Ground Sample Distance (GSD) — typically 1-3 cm/pixel for grade inspection, and 1-2 mm/pixel for detailed crack detection. Forward overlap of 70-80% and side overlap of 60-70% ensure complete coverage.
Flight execution — the drone flies a grid pattern along and across the runway, collecting geotagged images at intervals that provide the required overlap. Modern drones like the DJI Matrice 350 RTK or Autel EVO II Pro can cover a 3000 m × 45 m runway in 15-25 minutes of actual flight time, requiring one to three battery swaps depending on wind conditions. Real-time kinematic (RTK) georeferencing built into the drone provides camera positioning accuracy of 2-5 cm without ground control points.
Ground control — for the highest accuracy grade measurement, Ground Control Points (GCPs) are placed at 100-200 m intervals along the runway edges and surveyed with RTK GPS or total station. Each GCP is a high-visibility target (typically 30 cm × 30 cm black-and-white cross pattern) that appears clearly in the drone imagery. The GCPs anchor the photogrammetric model to absolute coordinates and eliminate the cumulative drift error that can occur in GPS-only georeferencing.
Photogrammetric processing — the images are processed in specialized software that detects common feature points across overlapping images, computes camera positions for each image through Structure-from-Motion (SfM) algorithms, and generates a dense point cloud through Multi-View Stereo (MVS) reconstruction. The resulting point cloud contains millions of points with 3D coordinates, from which a Digital Surface Model (DSM) is extracted at 2-10 cm resolution.
Profile extraction and analysis — the longitudinal grade profile is extracted from the DSM along the runway centerline and designated wheelpath lines. Elevation data is sampled at 0.5-2.0 m intervals to produce a continuous elevation profile. The local grade is calculated for each segment as the elevation difference divided by the segment length. The resulting grade profile is compared to the design grade profile to identify zones where settlement, heave, or construction defects have altered the pavement geometry.
Deviation mapping — grade change zones are identified where the actual grade deviates from the design grade by more than specified thresholds. The analysis produces color-coded deviation maps that show the spatial distribution of grade changes across the pavement network, directly identifying settlement zones requiring ground investigation or repair.
In 2016, ADP (Paris Airports Authority) conducted what was then the world’s largest drone pavement inspection on a runway at Paris Charles de Gaulle Airport. A surface area of over 200,000 m² was captured in approximately 1 hour 45 minutes of flight time, divided into nine short segments to minimize disruption to airport operations. Each segment lasted approximately 18 minutes, with flights carefully coordinated with air traffic control during gaps in traffic.
The drone collected ultra-high-resolution orthoimagery with a ground sample distance of 2-3 mm/pixel — sufficient to resolve pavement cracks as fine as 1-2 mm in width. The resulting orthomosaic was used to generate a detailed Digital Surface Model from which longitudinal grade profiles were extracted along the runway centerline and wheelpaths. The analysis, documented in an interactive digital report, identified grade changes from localized settlement that were then verified by ground survey. The inspection met ICAO and EASA standards for pavement geometry assessment and was used to prioritize repair zones for the airport’s pavement maintenance program.
The FAA Airport Technology Research and Development Branch conducted multi-airport trials during 2020-2022 to develop procedures for integrating drones into airport Pavement Management Programs. Tests at five US airports — including Habersham County Airport (GA) and Roosevelt Airport (NJ) — established data collection workflows for grade inspection.
A total of 97 missions were flown across varied conditions, amassing approximately 1.5 TB of imagery data. The final FAA report confirmed that all distress types identified in traditional foot-on-ground PCI surveys could be identified in drone imagery when the GSD was 2 mm/pixel or better. Grade changes from differential settlement were reliably detected when the settlement magnitude exceeded 5 mm over a distance of 5 m or more — corresponding to a grade change of 0.1%.
The FAA research concluded that drone-based grade inspection is equivalent to traditional visual PCI inspection in terms of findings but offers 2-5 times faster coverage and provides archival digital records that enable year-over-year change detection.
When longitudinal grade changes from settlement or construction defects exceed acceptable thresholds, corrective action is required. The choice of correction method depends on the extent and magnitude of grade deviation, pavement type (asphalt or concrete), traffic demands, operational constraints, and budget.
Asphalt overlay with variable thickness is the most common method for correcting longitudinal grade in flexible pavements. A leveling course of asphalt is placed in variable thickness to fill depressions and restore the design longitudinal profile, followed by a uniform wearing course of 40-60 mm thickness.
The leveling course thickness is determined from the grade deviation survey. For a depression of 20 mm maximum depth over 25 m length, the leveling course would vary from 0 mm at the edges to 25-30 mm at the deepest point (allowing for compaction tolerance). The overlay thickness must meet minimum structural requirements — typically 75-100 mm total overlay thickness for light aircraft pavements, 100-150 mm for transport aircraft pavements — to avoid delamination and reflective cracking.
The overlay must also address the vertical clearance impact. An overlay that changes the pavement elevation by 50-100 mm can affect runway edge light height, navigational aid signal clearance, drainage inlet height, and aircraft door sill height at gate positions. These secondary effects require careful coordination with airport operations and maintenance departments.
Cold milling (cold planing) removes existing pavement to a controlled depth to restore the longitudinal profile, followed by resurfacing with new asphalt or concrete. The milling machine uses a rotating drum with tungsten carbide cutting teeth to remove 25-150 mm of pavement in a single pass, with elevation control from a laser or stringline reference.
Cold milling is preferred when settlement has created positive grade errors (high spots) as well as negative errors (low spots), or when the vertical clearance cannot accommodate an overlay. The process can restore the longitudinal profile to within ±3 mm of design grade when guided by a laser-controlled elevation reference system. The milled surface provides a clean bonding surface for the new overlay, improving interlayer bond strength compared to overlay-on-existing-surface construction.
Slab jacking — also called mudjacking or pressure grouting — injects a cementitious grout beneath settled concrete pavement slabs to lift them back to design grade. The grout, typically a mixture of 1 part Portland cement to 2-4 parts sand with water for pumpability, is injected at pressures of 150-400 psi through 40-50 mm diameter holes drilled through the slab.
The lifting process is monitored continuously using dial gauges or laser levels placed at survey points on the slab surface. The technician controls the injection to achieve the targeted lift — typically within ±3 mm of design grade — and the grout cures to a compressive strength of 3-7 MPa within 24-48 hours. The cost ranges from $3-8 per square foot, and the method is effective only for slabs that are structurally intact.
Polyurethane foam injection provides an alternative to cementitious grout, with the advantages of 15-minute cure time (versus 24-48 hours), lightweight (40-60 lb/ft³), and precise lift control due to the expanding foam’s self-limiting nature. The foam expands to 20-30 times its liquid volume within seconds of injection, filling voids and lifting the slab to grade. Cost ranges from $9-14 per square foot, and the service life is 10-20 years.
When concrete slabs are severely cracked or the subgrade has experienced significant consolidation, full-depth slab replacement provides the definitive correction. The deteriorated slab is saw-cut to a clean rectangular shape, broken and removed with a hydraulic breaker, and the subgrade is recompacted or stabilized before placing new concrete.
The new slab must include dowel bar retrofitting at transverse joints to restore load transfer. Dowel bars of 32-38 mm diameter, 450 mm long are installed into drilled holes at mid-depth of the slab, grouted with epoxy or non-shrink grout, and aligned parallel to the pavement surface and centerline. Joints are sealed with silicone sealant (ASTM C920). Slab replacement costs $8-20 per square foot and provides a 15-25 year service life.
For widespread grade deficiencies affecting large pavement areas — typically when more than 20-30% of the pavement surface has grade deviations exceeding thresholds — pavement reconstruction provides the most effective long-term solution. Reconstruction involves removing the existing pavement structure, re-grading the subgrade to the design longitudinal profile, re-compacting to specified density (95% of Modified Proctor), and placing new pavement layers to the original structural section.
Reconstruction costs are typically 3-5 times higher than overlay or slab replacement but address the root cause of settlement — subgrade deficiency — rather than just the surface symptom. For runways serving critical aircraft operations, reconstruction may be the only acceptable option when settlement has reached magnitudes that compromise safety or operational reliability.
Longitudinal grade is a key parameter in Pavement Management Systems (PMS) for airport pavements. The FAA requires all federally-obligated airports to maintain a Pavement Maintenance Program that includes regular inspections and condition assessment. The Pavement Condition Index (PCI) per ASTM D5340 evaluates pavement condition on a scale of 0 to 100, with PCI values below 55 typically triggering rehabilitation planning.
Grade-related distresses are scored within the PCI methodology as distinct distress types. Settlement (depression) is rated based on depth and extent, faulting is rated based on vertical offset and frequency, and ponding is rated based on water depth and area affected. The combined effect of these distresses on the PCI score determines the priority and timing of rehabilitation.
The FAA recommends the following inspection frequencies for grade-related pavement distress:
| Pavement Type | Use | Visual Inspection | Grade Survey |
|---|---|---|---|
| Runway | All | Annually | Every 3 years |
| Taxiway | All | Annually | Every 3-5 years |
| Apron | All | Annually | Every 3-5 years |
These intervals assume stable pavement conditions. When settlement has been identified on adjacent pavement sections, or when the pavement is in a settlement-prone environment (soft subgrade, fill sections, expansive soils), the grade survey frequency should be increased to annual or semi-annual intervals until settlement rates stabilize below 1 mm per year.
Longitudinal grade data from surveys, LiDAR, or drone inspection should be integrated into the airport’s Pavement Management System as a separate data layer. The grade profile is georeferenced to the pavement network and linked to the pavement structural data (layer thickness, material type, construction date) and traffic data (annual departures, aircraft types, gear loads). This integration enables correlation analysis between grade change patterns and:
Traffic loading patterns — grade changes that coincide with wheelpath zones indicate traffic-induced settlement. Grade changes that are uniform across the pavement width indicate subgrade or environmental causes.
Pavement layer conditions — grade changes on flexible pavements that coincide with identified base layer degradation indicate progressive structural failure. Grade changes on rigid pavements that coincide with joint or crack patterns indicate load transfer loss or subgrade pumping.
Drainage patterns — grade changes that produce ponding zones are correlated with accelerated pavement deterioration in the ponded area from water infiltration and subgrade weakening.
Rehabilitation history — grade changes that accelerate after overlay or slab replacement indicate inadequate subgrade preparation during the previous rehabilitation, guiding the design of the next rehabilitation to address the root cause.
Grade trend analysis — the rate of grade change over time — is the most valuable PMS data for predictive maintenance. Settlement rates below 1 mm per year indicate stable conditions suitable for routine monitoring. Rates of 1-3 mm per year indicate developing conditions requiring investigation. Rates above 3 mm per year require immediate intervention to prevent accelerated deterioration and operational safety hazards.
The integration of longitudinal grade data into PMS enables data-driven prioritization of pavement maintenance and rehabilitation, ensuring that limited maintenance resources are directed to the zones with the greatest operational risk. At airports with comprehensive grade monitoring programs, the typical result is a 20-30% reduction in emergency pavement repairs and a 15-25% extension of pavement service life through early detection and correction of developing grade defects before they escalate into structural failures.

TarmacView uses AI-powered drone inspection to measure and analyze longitudinal grade across airport pavements. Our platform detects grade changes from differential settlement and generates precise grade deviation maps for targeted maintenance.
A comprehensive glossary entry on the aviation concept of approach slope, including definitions, associated concepts (glide slope/path, pitch angle, angle of at...
A drain in airport infrastructure is an engineered system for the removal of surface and subsurface water from paved areas such as runways, taxiways, and aprons...
Grooving is the cutting of transverse or longitudinal channels into runway or road pavement surfaces to improve water drainage, increase wet-weather friction, a...