A comprehensive technical glossary on the Marshall mix design method for asphalt pavements. Covers the full procedure from history and development, Marshall compaction, stability and flow testing, volumetric analysis (air voids, VMA, VFA), determination of optimum binder content, airport pavement applications, comparison with Superpave, and quality control using Marshall testing.
Marshall Mix Design Method for Asphalt Pavements
What is the Marshall Mix Design Method?
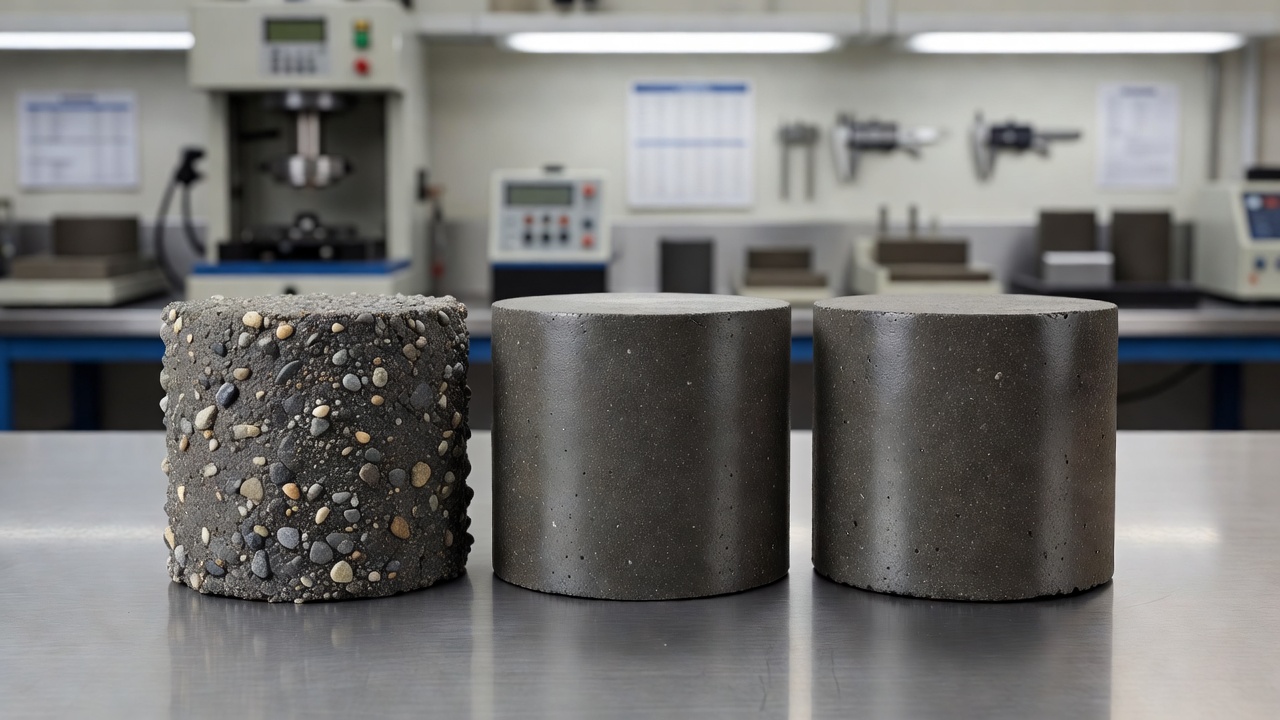
The Marshall mix design method is an empirical laboratory procedure for designing Hot Mix Asphalt (HMA) that determines the optimum asphalt binder content by evaluating compacted cylindrical specimens for stability (maximum load resistance) and flow (deformation) characteristics. Developed by Bruce G. Marshall of the Mississippi Highway Department in 1939, the method was subsequently refined by the U.S. Army Corps of Engineers (USACE) at the Waterways Experiment Station (WES) in Vicksburg, Mississippi, during the 1940s and 1950s for military airfield pavement design. Today, the Marshall method is used in some capacity by approximately 38 U.S. states and remains the most widely employed asphalt mix design procedure globally, particularly in developing nations, due to its simplicity, portability, and low equipment cost.
The Marshall method is fundamentally an optimization process that balances the competing requirements of strength, flexibility, durability, and workability in an asphalt mixture. The core premise involves preparing multiple trial blends at different asphalt binder contents (typically in 0.5% increments), compacting them under standardized conditions, subjecting them to controlled loading until failure, and performing detailed volumetric analysis to identify the binder content that produces a mix meeting all specified criteria. These criteria encompass Marshall stability (measured in kN or lbs), Marshall flow (measured in mm or 0.01 in increments), air voids (Va), voids in mineral aggregate (VMA), and voids filled with asphalt (VFA).
The primary references governing the Marshall method include AASHTO T 245 (Resistance to Plastic Flow of Bituminous Mixtures Using Marshall Apparatus), ASTM D6927 (Standard Test Method for Marshall Stability and Flow of Asphalt Mixtures), and the Asphalt Institute Manual Series MS-2 (Mix Design Methods for Asphalt). Additionally, the method is referenced in ASTM D6926 (Standard Practice for Preparation of Asphalt Mixture Specimens Using Marshall Apparatus) for specimen preparation. For airport applications, the FAA Advisory Circular AC 150/5370-10H (Item P-401) specifies Marshall criteria for plant-mix bituminous pavements on airfields.
1. History and Development of the Marshall Method
Origins at the Mississippi Highway Department (1939)
Bruce G. Marshall developed the original stability test apparatus in 1939 while working as a bituminous engineer for the Mississippi State Highway Department. The equipment was designed to be a simple, rapid field test for evaluating the quality of asphalt concrete mixtures being placed on Mississippi roads. Marshall’s original apparatus consisted of a loading fixture that could be fitted onto existing California Bearing Ratio (CBR) testing equipment — a strategic design choice that leveraged equipment already available in most highway laboratories. The original test measured only the maximum load (stability) resistance of compacted specimens, without any deformation measurement.
Refinement by the U.S. Army Corps of Engineers (1943–1955)
In 1943, during World War II, the U.S. Army Corps of Engineers began a systematic evaluation of available asphalt mix design methods at the Waterways Experiment Station (WES) in Vicksburg, Mississippi. The motivation was urgent: military aircraft were rapidly increasing in size, wheel load, and tire pressure, requiring stronger and more reliable airfield pavements. Early-generation military aircraft like the B-17 Flying Fortress imposed wheel loads of approximately 15,000 lbs (66.7 kN), while the later B-29 Superfortress pushed loads toward 30,000 lbs (133.4 kN) — requiring pavements far beyond existing road construction standards.
The USACE examined several competing design methods, including the Hveem stabilometer method (developed in California) and various empirical approaches. The Corps selected the Marshall method for adoption because it satisfied four critical requirements:
Full-sample stress distribution: The curved loading heads stressed the entire specimen cross-section, rather than a localized portion.
Rapid testing capability: A complete test cycle could be performed in minutes, enabling high laboratory throughput.
Compact and portable apparatus: The entire setup could be transported to field laboratories.
Field-density simulation: The impact hammer produced compacted densities reasonably close to those achieved by field rollers, particularly for the compaction equipment of the era.
The Addition of Flow Measurement (1945)
The most significant refinement to Marshall’s original method came from the USACE Waterways Experiment Station, which added a deformation (flow) measurement capability to the test. The flow meter — typically a dial gauge or linear variable displacement transducer (LVDT) — measures the vertical deformation of the specimen at the point of maximum load. The Corps reasoned that a mix with adequate stability but excessive deformation under load would be prone to rutting and shoving in service. Conversely, a mix with low deformation (stiff) but low stability might be brittle and prone to cracking. The flow measurement thus provided an essential check against excessively high asphalt contents that would produce a tender, unstable mix.
WES Experimental Validation (1948–1955)
Throughout the late 1940s and early 1950s, WES conducted extensive field validation studies correlating Marshall test results with actual pavement performance. These studies examined variables including aggregate type and gradation, asphalt binder source and grade, compaction effort, and climate conditions. The Corps established the now-standard compaction levels of 35, 50, and 75 blows per side corresponding to light, medium, and heavy traffic classifications, respectively. They also developed the first comprehensive Marshall design criteria tables specifying minimum stability, flow ranges, and air void requirements for different traffic levels.
Global Dissemination and Adoption
Following World War II, the Marshall method spread worldwide through several channels: USACE technical manuals distributed to allied nations, the Asphalt Institute’s MS-2 manual (first published in the 1950s and periodically updated), and the method’s inclusion in International Civil Aviation Organization (ICAO) guidance documents for airport pavement design. By the 1970s, the Marshall method had become the dominant asphalt mix design procedure in North America, Europe, Asia, Africa, and Australasia.
2. Marshall Compaction: Equipment and Procedures
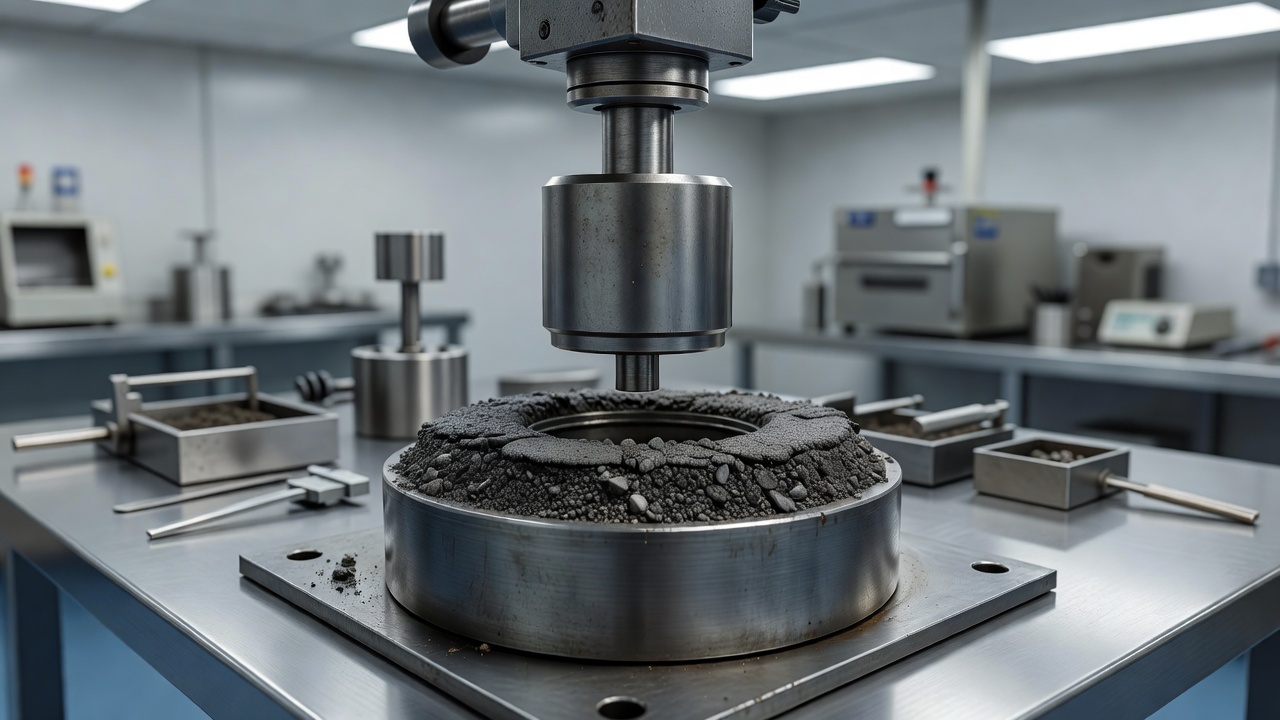
The Marshall Compaction Hammer
The Marshall hammer is the central compaction device, designed to simulate the kneading and densification action of field rollers on an asphalt pavement. Key specifications include:
Component
Specification
Standard
Hammer weight
4,536 g (10.0 lb)
AASHTO T 245
Drop height
457.2 mm (18.0 in) free fall
AASHTO T 245
Tamper foot diameter
98.4 mm (3.875 in)
ASTM D6926
Tamper foot area
76 cm² (11.8 in²)
ASTM D6926
Specimen diameter
101.6 mm (4.0 in) standard
AASHTO T 245
Specimen height
63.5 mm (2.5 in) nominal
AASHTO T 245
Two types of Marshall hammers are available: manual hammers where the operator lifts and releases the sliding weight at the specified drop height, and automatic hammers (electrically or pneumatically operated) that provide consistent blow frequency and drop height. Automatic hammers are generally preferred as they reduce operator variability and improve test reproducibility. Modern automatic Marshall compactors can achieve blow frequencies of approximately 60 blows per minute with consistent energy delivery.
Compaction Levels by Traffic Classification
The number of blows applied to each end of the specimen is determined by the anticipated traffic loading. Standard compaction levels per AASHTO T 245 and the Asphalt Institute MS-2 are:
Traffic Classification
Equivalent Single Axle Loads (ESALs)
Blows per Side
Application
Light Traffic
Less than 10⁴ ESALs
35
Local roads, residential streets
Medium Traffic
10⁴ to 10⁶ ESALs
50
Secondary highways, collector roads
Heavy Traffic
Greater than 10⁶ ESALs
75
Interstate highways, major arterials, airport runways
For airport pavements, the FAA P-401 specification typically requires 75 blows per side for all surface courses and binder courses, reflecting the extreme loads imposed by aircraft operations. Some international specifications for airport pavements require up to 112 blows per side in modified Marshall procedures for large aggregate mixes (up to 38 mm nominal maximum size).
Specimen Preparation Procedure
The standard Marshall specimen preparation sequence per ASTM D6926 involves:
Aggregate preparation: Aggregates are dried to constant mass at 105–110°C (221–230°F) and sieved into individual size fractions. They are then recombined according to the design gradation.
Heating: Aggregates are heated to the mixing temperature, typically 160–177°C (320–350°F) for conventional binders. Asphalt binder is heated to the specified mixing temperature, typically 150–163°C (302–325°F). The temperature-viscosity relationship of the binder is used to determine exact mixing and compaction temperatures, targeting a viscosity of 170±20 cSt for mixing and 280±30 cSt for compaction.
Mixing: The heated aggregates and binder are thoroughly mixed in a mechanical mixer (or by hand for small batches) until all aggregate particles are uniformly coated — typically 90–120 seconds of mixing time.
Molding: The mixture is placed in a preheated Marshall mold assembly (mold cylinder, collar, and base plate) using a heated spatula or scoop. Filter paper discs are placed at the top and bottom. The mixture is spaded 15 times around the perimeter and 10 times in the center.
Compaction: The mold assembly is placed on the compaction pedestal. The specified number of blows is applied to one face, the specimen is rotated 180°, and the same number of blows is applied to the opposite face.
Extrusion and cooling: After compaction, the specimen is allowed to cool. The mold assembly is then placed in a sample ejector to extrude the compacted specimen. Specimens are stored at room temperature until testing.
Modified Marshall Procedure for Large Aggregates
When the nominal maximum aggregate size exceeds 26.5 mm (1.0 inch), a modified Marshall procedure using 152.4 mm (6.0 inch) diameter specimens is required. The key modifications per ASTM D5581 include:
Parameter
Standard Marshall
Modified Marshall
Specimen diameter
101.6 mm (4 in)
152.4 mm (6 in)
Specimen height
63.5 mm (2.5 in)
95.2 mm (3.75 in)
Hammer weight
4,536 g (10.0 lb)
10,206 g (22.5 lb)
Drop height
457.2 mm (18 in)
457.2 mm (18 in)
Batch weight
1,200–1,500 g
4,050 g
Maximum aggregate size
26.5 mm (1 in)
38 mm (1.5 in)
Blows per side
35/50/75
112 (heavy traffic)
3. Marshall Stability and Flow Testing
Test Fundamentals
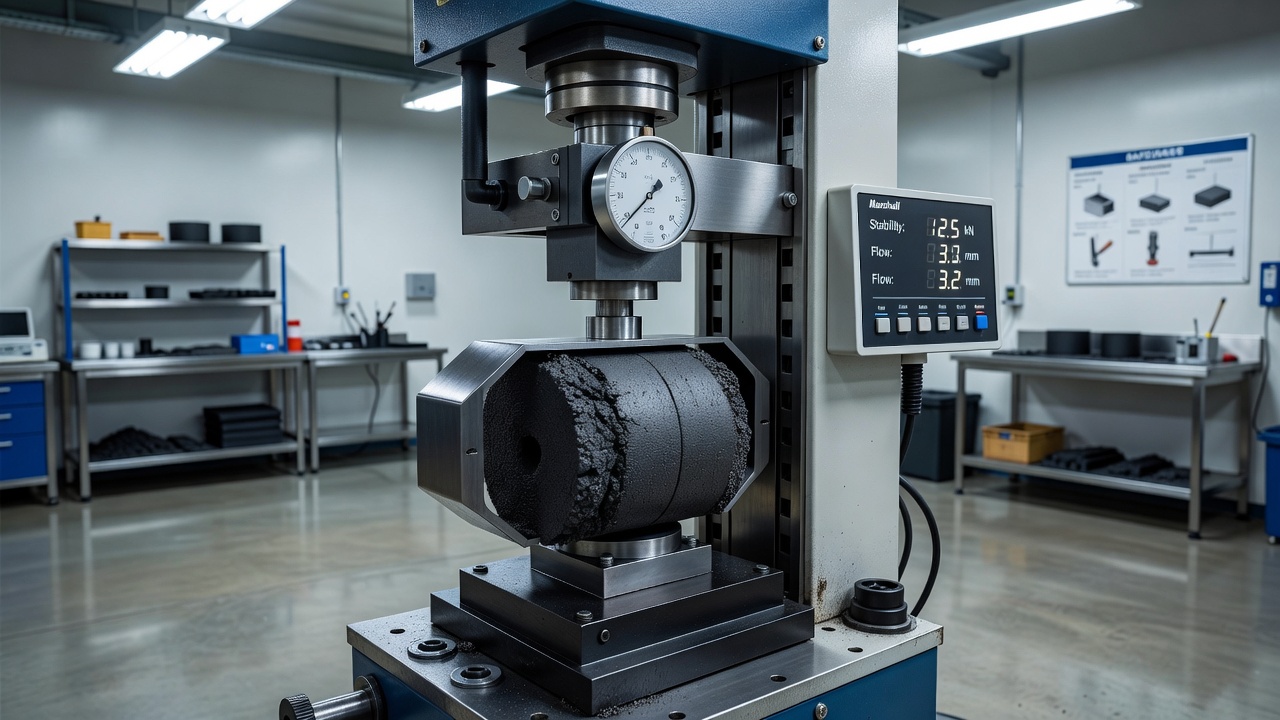
The Marshall stability test (ASTM D6927 / AASHTO T 245) measures the maximum load a compacted asphalt specimen can sustain at a standard test temperature of 60°C (140°F) — representing the worst-case summer pavement temperature in most climates. The specimen is conditioned in a water bath at 60°C±1°C for 30–40 minutes prior to testing, ensuring all specimens reach uniform temperature throughout the cross-section.
Test Apparatus
The Marshall testing system consists of:
Loading frame: A mechanical or hydraulic compression machine capable of applying load at a constant rate of 50.8 mm/min (2.0 in/min) with accuracy of ±2%.
Breaking head: Two curved steel loading strips, each with a radius of curvature of 50.8 mm (2.0 in), that cradle the cylindrical specimen. The upper and lower heads are fitted with guide rods to maintain alignment during loading.
Load measurement: A proving ring, load cell, or electronic transducer calibrated to measure load within 1% accuracy, typically with capacity of 25–50 kN (5,600–11,200 lbs).
Flow measurement: A dial gauge or LVDT mounted on the breaking head, measuring vertical deformation in 0.25 mm (0.01 in) increments.
Test Procedure
The conditioned specimen is removed from the 60°C water bath and surface-dried with a damp cloth.
The specimen is centered in the Marshall breaking head between the upper and lower loading strips.
The breaking head and specimen assembly is positioned in the loading frame.
The flow meter is positioned and zeroed against the specimen.
The load is applied at a constant rate of 50.8 mm/min (2.0 in/min).
The maximum load (stability) and corresponding deformation (flow) are recorded simultaneously.
Loading continues until the load decreases noticeably, confirming the failure point.
Interpreting Stability and Flow Results
Marshall stability is recorded in kN (or lbs) and represents the peak load resistance of the mixture. Higher stability values generally indicate stiffer mixes with greater resistance to rutting and deformation, but excessively high stability may indicate a mix that is too brittle and prone to cracking under thermal or fatigue loading.
Marshall flow is recorded in mm (or 0.25 mm increments) and represents the plastic deformation of the specimen at failure. Higher flow values indicate greater flexibility but may signal an excessively rich binder content that could lead to rutting. Lower flow values indicate a stiff, possibly under-asphalted mix that may crack under load.
The Marshall quotient (stability divided by flow, expressed in kN/mm) is sometimes used as a stiffness indicator. MoRTH (India) specifies a Marshall quotient range of 2.5–5.0 kN/mm for dense Bituminous Macadam (DBM) and Bituminous Concrete (BC) mixes.
Typical Marshall Design Criteria
Mix Property
Light Traffic (<10⁴ ESALs)
Medium Traffic (10⁴–10⁶ ESALs)
Heavy Traffic (>10⁶ ESALs)
Blows per side
35
50
75
Stability, min
2,224 N (500 lbs)
3,336 N (750 lbs)
6,672 N (1,500 lbs)
Flow (0.25 mm units)
8–20
8–18
8–16
Air voids (%)
3–5
3–5
3–5
VFA (%)
70–80
65–78
65–75
Source: Asphalt Institute MS-2, 6th Edition
4. Volumetric Analysis in Marshall Mix Design
Density Measurements
Accurate density determination is the foundation of Marshall volumetric analysis. Two specific gravity values are essential:
Bulk Specific Gravity (Gmb) of compacted specimens is determined per ASTM D2726 / AASHTO T 166 using the saturated surface-dry (SSD) method:
Gmb = Dry Mass / (SSD Mass − Submerged Mass)
For specimens with high absorption (greater than 2%), alternative methods (ASTM D1188 paraffin-coated method or ASTM D6752 vacuum sealing method) are required.
Theoretical Maximum Specific Gravity (Gmm) of the loose asphalt mixture is determined per ASTM D2041 / AASHTO T 209 (the Rice test), where the loose, uncompacted mixture is vacuum-saturated to remove entrapped air, enabling calculation of the density of the mixture with zero air voids.
Air Voids (Va)
Air voids, also expressed as voids in the total mix (VTM), represent the small air spaces between coated aggregate particles in the compacted mixture. Calculation:
Va = [1 − (Gmb / Gmm)] × 100%
Design air void targets are typically 4.0% (with acceptable range of 3–5%), representing the void content immediately after construction. Over time, traffic compaction reduces air voids to 2–3%, known as the voids in service condition. Maintaining adequate air voids is critical because:
Too low (< 3%): Causes bleeding, flushing, and rutting as binder expands into the reduced void space under traffic
Too high (> 8%): Allows excessive water and oxygen ingress, accelerating oxidative aging, moisture damage, and raveling
The design air void target of 4% provides a balance between preventing binder bleeding and maintaining adequate durability over the pavement’s service life.
Voids in Mineral Aggregate (VMA)
VMA represents the intergranular void space between the aggregate particles in a compacted mixture, including the space occupied by asphalt binder and air voids. VMA is calculated as:
VMA = 100 − [(Gmb × Ps) / Gsb]
Where:
Gmb = bulk specific gravity of compacted mix
Ps = aggregate content, percent by total weight of mix
Gsb = bulk specific gravity of total aggregate
Minimum VMA requirements are critical for ensuring adequate binder film thickness around aggregate particles. Insufficient VMA leads to thin binder films that age rapidly and produce brittle, crack-prone pavements. Asphalt Institute minimum VMA criteria depend on the nominal maximum particle size (NMPS) of the aggregate:
NMPS (mm)
NMPS (U.S. Standard)
Minimum VMA (%)
63.0
2.5 inch
11.0
50.0
2.0 inch
11.5
37.5
1.5 inch
12.0
25.0
1.0 inch
13.0
19.0
0.75 inch
14.0
12.5
0.5 inch
15.0
9.5
0.375 inch
16.0
4.75
No. 4 sieve
18.0
Voids Filled with Asphalt (VFA)
VFA represents the portion of the VMA that is occupied by asphalt binder (excluding absorbed binder). Calculation:
VFA = [(VMA − Va) / VMA] × 100%
Where:
VMA = voids in mineral aggregate (%)
Va = air voids (%)
VFA indicates the degree of filling of the aggregate void system. Higher VFA values indicate more VMA filled with binder, producing richer, more durable mixes. Lower VFA values indicate leaner mixes with greater air void content. VFA criteria vary by traffic level as shown in the design criteria table above.
Bulk Specific Gravity of Aggregate (Gsb, Gsa, Gssd)
Determining the correct specific gravity of the aggregate blend is crucial for accurate VMA calculation. Three measures are defined per ASTM C127 / AASHTO T 84:
Bulk specific gravity (Gsb): Includes all permeable void volume within aggregate particles — used in VMA calculation
Saturated surface-dry specific gravity (Gsa): Includes permeable voids filled with water — used in absorption calculation
Apparent specific gravity (Gssd): Excludes all permeable voids — used for theoretical maximum density calculations
5. Determining Optimum Binder Content
Trial Blend Preparation
The Marshall method typically requires five trial asphalt contents at 0.5% increments, with the middle value representing the estimated optimum binder content. For each trial content, three replicate specimens are prepared (total of 15 specimens). The trial range should extend at least 1.0% above and below the estimated optimum to establish clear trends in the resulting curves.
Graphical Analysis
After all specimens are tested, six graphs are plotted with asphalt content on the x-axis:
Asphalt content vs. density: Density typically increases with asphalt content, reaches a peak (maximum density), then decreases as excess binder pushes aggregate particles apart. The peak density generally occurs at a higher binder content than peak stability.
Asphalt content vs. Marshall stability: Stability typically increases with asphalt content to a peak, then decreases. Two behaviors are possible: a well-defined peak (most virgin mixes) or a monotonic decrease with no peak (some recycled mixtures).
Asphalt content vs. flow: Flow increases steadily with increasing asphalt content as the binder film thickens and the mix becomes more flexible.
Asphalt content vs. air voids: Air voids decrease linearly with increasing asphalt content as binder fills the void space between aggregate particles.
Asphalt content vs. VMA: VMA decreases with increasing asphalt content, reaches a minimum, then increases. The minimum VMA point corresponds approximately to the point where excess binder begins to push particles apart.
Asphalt content vs. VFA: VFA increases steadily with increasing asphalt content.
Optimum Binder Content Selection Procedure (Asphalt Institute MS-2 Method)
The standard procedure for selecting optimum asphalt content:
Determine the asphalt content at 4.0% air voids (the specification median) by reading the air voids graph. This is the candidate optimum binder content.
Verify this candidate content against all other criteria:
Stability at the candidate content must exceed the minimum requirement
Flow must fall within the specified range
VMA must exceed the minimum for the NMPS
VFA must fall within the specified range
If all criteria are satisfied, the candidate optimum binder content is accepted.
If one or more criteria are not satisfied, the mixture must be redesigned by adjusting aggregate gradation, changing aggregate sources, modifying binder grade, or altering the design compaction level.
Alternate Methods
Some agencies (e.g., MoRTH in India) use an alternate approach: calculate the binder content corresponding to:
Maximum stability
Maximum density
4% air voids
The optimum binder content (OBC) is then the average of these three values. This method produces slightly different results than the Asphalt Institute approach and is common in specifications derived from British Standards.
6. Marshall Mix Design for Airport Pavements
FAA and ICAO Requirements
The Marshall method is explicitly referenced in FAA Advisory Circular AC 150/5370-10H (Standard Specifications for Construction of Airports) under Item P-401 (Plant-Mix Bituminous Pavements). The FAA specifies Marshall design criteria specifically tailored for airport pavements:
Parameter
FAA P-401 Requirement
Compaction
75 blows per side
Stability (minimum)
6,672 N (1,500 lbs) for surface courses
Flow range
8–16 (0.25 mm units)
Air voids
3.0–5.0%
VMA
Per Asphalt Institute minimums
VFA
65–75%
Research literature from the ICAO Airport Pavement Design and Evaluation guidance confirms that the Marshall mix design method is the preferred approach for runway asphalt mix design according to both FAA and ICAO specifications. The ICAO Aerodrome Design Manual (Doc 9157, Part 3 – Pavements) provides additional guidance on materials selection and testing procedures for airport pavements.
Airport-Specific Considerations
Airport pavements differ from highway pavements in several critical respects that influence Marshall mix design:
Extreme wheel loads: Aircraft like the Boeing 747-400 or Airbus A380 impose wheel loads up to 22,500 kg (49,600 lbs) per wheel — far exceeding highway legal loads. Multi-wheel gear configurations (e.g., 4-wheel bogies, 6-wheel triple-dual tandem) create complex stress distributions.
Chemical resistance: Airport pavements must resist attack from jet fuel (kerosene), hydraulic fluids (Skydrol), and de-icing chemicals (glycols, potassium acetate). Polymer modified binders (PMB) are now standard for main runways and aprons. The Marshall method can accommodate PMB evaluation, though the empirical stability-flow criteria may require modification for highly modified binders.
Surface friction requirements: Airport runways require specific macrotexture and microtexture for wet-weather braking. The Marshall method does not directly address surface friction characteristics, so supplementary testing (e.g., British Pendulum Number, sand patch texture depth) is required.
Grooving compatibility: Runway grooving (6 mm × 6 mm grooves at 38 mm spacing) is commonly applied to improve friction and reduce hydroplaning risk. The mix design must have sufficient stability to maintain groove integrity under traffic.
FM 5-530 Marshall Criteria for Military Airfields
The U.S. Army Corps of Engineers manual FM 5-530 provides modified Marshall criteria for military airfields, accounting for the discrete-load nature of aircraft traffic:
Aircraft Category
Stability (min)
Flow (0.25 mm)
Air Voids (%)
Light aircraft (<30,000 lbs GW)
6,672 N (1,500 lb)
8–18
3–5
Medium aircraft (30,000–100,000 lbs GW)
8,896 N (2,000 lb)
8–16
3–5
Heavy aircraft (>100,000 lbs GW)
11,120 N (2,500 lb)
8–14
3–4.5
7. Marshall vs. Superpave: Comparative Analysis
Fundamental Differences
The Superpave (Superior Performing Asphalt Pavements) mix design system was developed under the U.S. Strategic Highway Research Program (SHRP) from 1987 to 1993 as a performance-based replacement for the Marshall method. Key differences include:
Aspect
Marshall Method
Superpave Method
Compaction type
Impact (drop hammer)
Gyratory (shear kneading)
Compaction measurement
Number of blows
Number of gyrations (N_design)
Performance indicator
Stability (empirical load)
Shear resistance, rutting, fatigue
Binder specification
Penetration/Viscosity grade
Performance Grade (PG)
Selection criteria
Stability + flow + volumetrics
Volumetrics at N_design + optional performance tests
Aggregate requirements
Basic gradation bands
Restricted zone + consensus properties
Aging consideration
Minimal
Short-term and long-term aging protocols
Performance testing
No
Optional: flow number, flow time, IDT creep
Advantages of Superpave
Gyratory compaction produces specimens with aggregate orientation and internal structure more representative of field compaction from modern high-frequency vibratory rollers.
Performance-graded (PG) binders are selected based on climate-specific temperature ranges, providing more rational binder selection than penetration or viscosity grades.
Consensus aggregate properties (coarse aggregate angularity, fine aggregate angularity, flat and elongated particles) ensure robust aggregate skeletons.
Volumetric design at N_design uses a rational compaction level corresponding to the design traffic level.
Optional performance tests (e.g., AASHTO T 378 flow number test for rutting, AASHTO T 322 indirect tension test for cracking) provide fundamental engineering properties.
Advantages of the Marshall Method
Lower equipment cost: A complete Marshall laboratory setup costs significantly less than a Superpave gyratory compactor and associated equipment.
Simplicity and speed: Testing can be performed rapidly with minimal training, making it suitable for routine quality control.
Portability: Equipment can be transported to field laboratories for remote project sites.
Extensive historical database: Decades of correlation between Marshall test results and field performance in thousands of projects provide a reliable empirical foundation.
Widespread international adoption: The Marshall method is specified in standards across North America, Europe, Asia, Africa, and Australasia, ensuring global consistency.
Applicability to dense-graded mixes: For conventional dense-graded HMA with NMPS up to 25 mm, the Marshall method produces satisfactory designs.
Performance Comparison
Research comparing Marshall and Superpave designs (e.g., published studies in Construction and Building Materials, Journal of Transportation Engineering) generally demonstrates that:
Superpave mixes show 5–14% better rutting resistance and improved cracking resistance across various climatic regions.
Marshall mixes designed to current criteria provide adequate performance for low-to-medium traffic levels (up to 10⁶ ESALs) where the empirical correlations are well-established.
For high-traffic and heavy-load applications (airport runways, interstate highways exceeding 30 million ESALs), Superpave or balanced mix design (BMD) approaches are increasingly preferred.
8. Limitations of the Marshall Method
Fundamental Empirical Nature
The Marshall stability and flow values are empirical indices, not fundamental engineering properties. A stability value of 10 kN does not directly translate to a specific modulus, shear strength, or fatigue life. This empirical nature means the method relies on historical correlation rather than mechanistic modeling of pavement response.
Compaction Simulation
The Marshall drop hammer applies vertical impact compaction, which produces aggregate particle orientation and internal structure different from the kneading and shear compaction of modern pneumatic-tire rollers, steel-wheel rollers, and Superpave gyratory compactors. This discrepancy can lead to:
Over-estimation of achievable field density for stiff mixes
Under-estimation of achievable field density for tender mixes
Different aggregate orientation affecting the measured stability
Limited Testing Conditions
The Marshall test evaluates specimens at a single temperature (60°C) and loading rate (50.8 mm/min). This does not capture:
Low-temperature cracking behavior (tested via thermal stress restrained specimen tests or semi-circular bending tests)
Fatigue cracking under repeated loading (tested via four-point beam fatigue tests)
Moisture damage susceptibility (tested via tensile strength ratio per AASHTO T 283)
Aging effects on binder properties over time
Modified Binder Compatibility
The Marshall stability-flow criteria were developed for conventional unmodified binders. Modern polymer-modified binders (PMB) — including SBS, EVA, and elastomeric modifications — exhibit different viscoelastic behavior that may not be adequately captured by the Marshall test. PMB mixes may show:
Higher stability values exceeding traditional criteria (requiring relaxation of maximum limits)
Different flow characteristics that do not correlate linearly with field performance
Temperature sensitivity that differs from conventional binders
Large Aggregate Limitations
Standard Marshall equipment (101.6 mm diameter mold) is only suitable for aggregates with nominal maximum size (NMS) up to 26.5 mm. For larger aggregates, the modified Marshall procedure (152.4 mm diameter, 22.5 lb hammer) is required but is less standardized and has limited historical correlation data.
Variability and Reproducibility
Marshall test results can exhibit considerable variability due to:
Operator technique in manual compaction (blow frequency, hammer alignment)
Specimen height variation (corrections required for non-standard heights)
Temperature control during specimen preparation and conditioning
Aggregate coating uniformity
9. Marshall Criteria by Traffic Level
Comprehensive Design Criteria Table
The following table presents comprehensive Marshall design criteria compiled from the Asphalt Institute (MS-2), ASTM D6927, AASHTO T 245, and FAA P-401 specifications:
Design Parameter
Light Traffic
Medium Traffic
Heavy Traffic
Airport (P-401)
Compaction (blows/side)
35
50
75
75
Stability, min (N)
2,224
3,336
6,672
6,672
Stability, min (lbs)
500
750
1,500
1,500
Flow (0.25 mm units)
8–20
8–18
8–16
8–16
Flow (mm)
2.0–5.0
2.0–4.5
2.0–4.0
2.0–4.0
Air voids (%)
3–5
3–5
3–5
3–5
VFA (%)
70–80
65–78
65–75
65–75
Marshall quotient (kN/mm)
1.5–4.0
2.0–4.5
2.5–5.0
2.5–5.0
International Variation
Marshall criteria vary significantly between countries and agencies:
Country/Standard
Stability (kN) min
Flow (mm)
Air Voids (%)
Notes
Asphalt Institute (USA)
3.34 (med), 6.67 (heavy)
2.0–4.5
3–5
Base criteria
MoRTH (India)
12.0 (DBM/BC)
2.5–4.0
3–5
Higher stability
BS 4987 (UK)
5.0–10.0 (grade dependent)
2.0–5.0
2–8
Grading specific
China (JTG F40)
7.5–8.5 (traffic dependent)
1.5–4.0
3–6
Higher for heavy traffic
South Africa (SABITA)
7.0–10.0
2.0–4.5
3–5
Modified binder provisions
10. Quality Control Using Marshall Testing
Plant-Produced vs. Laboratory-Mixed Specimens
Marshall testing serves dual roles in quality management:
Design phase (LMLC): Laboratory-mixed, laboratory-compacted specimens establish the job-mix formula (JMF).
Production phase (PMLC): Plant-mixed, laboratory-compacted specimens verify that the produced mix conforms to the JMF.
The production tolerance criteria per AASHTO and FAA standards:
Parameter
Allowable Deviation from JMF
Asphalt content
±0.3%
Stability
±20% of design value
Flow
±1.5 mm (±6 units of 0.25 mm)
Air voids
±1.0%
VMA
±1.0%
Gradation (passing No. 4 and larger)
±5%
Gradation (passing No. 8 to No. 200)
±3%
Statistical Quality Control
Modern quality control programs apply statistical process control (SPC) to Marshall test results:
Control charts track running averages of stability, flow, air voids, and VMA from successive production samples.
Upper and lower control limits (UCL/LCL) are established at ±3 standard deviations from the JMF target.
Moving range charts detect shifts in production consistency.
Lot acceptance is based on the percentage of tests meeting specification criteria (typically 90% individual conformance, 100% average conformance per lot).
Failure Analysis
When Marshall test results fall outside acceptance limits, the following systematic investigation is recommended:
Check gradation: Wash sieve analysis on extracted aggregate
Check compaction: Verify hammer calibration, blow count, and temperature
Check conditioning: Verify water bath temperature and immersion time
Check testing: Verify load ring calibration and loading rate
Check sampling: Verify that the sample is representative of the production lot
Frequency of Testing
Typical quality control testing frequencies per FAA P-401 and state DOT specifications:
Test
Minimum Frequency
Gradation
1 per 500 tons
Asphalt content
1 per 500 tons
Marshall stability and flow
1 per 500 tons
Bulk specific gravity
1 per 500 tons
Maximum theoretical specific gravity
1 per 500 tons or 1 per day
Air voids, VMA, VFA (calculated)
From above data
Conclusion
The Marshall mix design method remains a cornerstone of asphalt pavement engineering more than 80 years after its development. Its enduring relevance stems from its practical balance of simplicity, reproducibility, and empirical correlation with field performance. The method’s widespread global adoption — across five continents and in both highway and airport applications — has created a vast database of performance correlations that continue to inform pavement design decisions.
While the Superpave system has addressed many of the Marshall method’s limitations through performance-graded binders, gyratory compaction, and fundamental engineering property testing, the Marshall method retains advantages in cost, portability, and ease of implementation that make it the preferred method for many agencies worldwide. For airport pavements specifically, the method’s integration into FAA P-401 and ICAO guidance ensures its continued relevance for airfield construction.
The most effective approach for modern pavement engineering is to apply the Marshall method for routine quality control and low-to-medium traffic designs, while transitioning to Superpave or balanced mix design (BMD) approaches for high-traffic corridors, heavy-load airport pavements, and projects where advanced binder modification or performance testing is required. Understanding both methods — their strengths, limitations, and appropriate applications — is essential for the pavement engineer’s toolkit.
Frequently Asked Questions
The Marshall mix design method is an empirical laboratory procedure developed in 1939 by Bruce Marshall at the Mississippi Highway Department and later refined by the U.S. Army Corps of Engineers for designing Hot Mix Asphalt (HMA). It involves preparing compacted cylindrical specimens at varying asphalt contents, testing them for stability (maximum load resistance) and flow (deformation), and analyzing volumetric properties to determine the optimum binder content that provides adequate strength, durability, and resistance to rutting and cracking.
Optimum asphalt content is determined by preparing trial blends at 0.5% binder content increments (typically 5 blends with 3 specimens each). Specimens are compacted using the Marshall hammer at 35, 50, or 75 blows per side depending on traffic level. After testing, graphs are plotted for asphalt content vs. density, stability, flow, air voids, VMA, and VFA. The optimum binder content is typically selected as the asphalt content corresponding to the median air void content (usually 4%), provided all other properties fall within specified limits.
Marshall stability is the maximum load (in kN or lbs) a compacted asphalt specimen can resist before failure when loaded at 50.8 mm/min (2 in/min) in a Marshall testing apparatus. Marshall flow is the corresponding vertical deformation (in mm or 0.01 in increments) measured at the point of maximum load. Together, stability and flow indicate the mix's strength and flexibility. Typical criteria require minimum stability of 6672 N (1500 lbs) for heavy traffic and flow values between 8 and 14 (0.25 mm units).
The Marshall method uses impact compaction with a drop hammer (35-75 blows per side) and evaluates empirical stability and flow properties. Superpave uses gyratory compaction (SGC) with controlled shear and angle, evaluates fundamental engineering properties including shear resistance and rutting, and incorporates performance-graded (PG) binders, volumetric design at N_design gyrations, and optional performance testing for fatigue and low-temperature cracking. Superpave also accounts for binder aging and climate-specific performance more thoroughly than the Marshall method.
Limitations include: (1) the empirical nature of stability and flow measurements does not directly measure fundamental engineering properties; (2) the impact compaction method may not accurately simulate field compaction from modern rollers; (3) the method does not adequately address long-term pavement performance under varied climates; (4) limited compatibility with modern modified binders like polymer-modified bitumen; (5) larger aggregates (>26.5 mm) require modified larger-scale Marshall testing; and (6) the method does not include performance testing for fatigue cracking or low-temperature cracking.
Optimize Your Asphalt Pavement Designs
Need expert guidance on asphalt mix design for airport or highway pavements? Our pavement specialists can help you implement Marshall or Superpave methods for optimal performance, durability, and regulatory compliance.
Voids in Mineral Aggregate (VMA) is the volume of intergranular void space between aggregate particles in a compacted hot-mix asphalt specimen, including both a...
Voids Filled with Asphalt (VFA) is the percentage of the Voids in Mineral Aggregate (VMA) that is filled with asphalt binder rather than air. VFA is a critical ...
Hot Mix Asphalt (HMA) for Airport and Road Pavements
Hot Mix Asphalt (HMA) is the standard flexible pavement material produced by heating and mixing aggregate and asphalt binder at 150–180°C, then placing and comp...
31 min read
Pavement Materials
Airport Infrastructure
+3
Cookie Consent We use cookies to enhance your browsing experience and analyze our traffic. See our privacy policy.