Pavement design life is the planned duration for which a pavement is engineered to serve before requiring major rehabilitation or reconstruction. For airport pavements, typical design lives range from 20 years for flexible to 30–40 years for rigid pavements, governed by FAA AC 150/5320-6G and ICAO standards. The actual service life depends on traffic loading, climate, maintenance quality, and materials. This glossary covers design life concepts, terminal condition thresholds, rehabilitation triggers, and how periodic inspection tracks remaining life through Pavement Condition Index (PCI) and nondestructive testing methods.
Pavement Design Life — Definition and Fundamental Concepts
Pavement design life is the planned duration for which a pavement structure is engineered to provide acceptable service under predicted traffic and environmental conditions before requiring major rehabilitation or reconstruction. It is one of the most critical parameters in pavement engineering, establishing the structural thickness, material specifications, and construction quality requirements for any airport, highway, or industrial pavement project.
The concept of design life rests on the understanding that all pavements deteriorate over time under the combined effects of traffic loading and environmental exposure. Structural deterioration manifests as cracking, rutting, faulting,raveling, and loss of smoothness — each progressing at a rate determined by the pavement’s structural capacity relative to the demands placed upon it. The design life establishes a performance target: the pavement must maintain its condition above a defined terminal condition threshold for the entire design period.
For airport pavements, the Federal Aviation Administration (FAA) specifies in Advisory Circular AC 150/5320-6G — Airport Pavement Design and Evaluation that the standard design life is 20 years for flexible pavements and 30 to 40 years for rigid pavements. The International Civil Aviation Organization (ICAO), through ICAO Doc 9157 — Aerodrome Design Manual, Part 3: Pavements, provides complementary guidance that aligns with these durations. These design lives are not arbitrary; they reflect decades of empirical data from the AASHO Road Test (1958–1960), subsequent field validation studies, and economic optimization analyses that balance initial construction cost against future rehabilitation expense.
It is essential to understand that design life is a design target, not a guarantee of actual service life. Many pavements exceed their design life when properly maintained, while others fail prematurely due to overload, poor construction quality, inadequate drainage, or unexpected environmental conditions. The distinction between the planned design life and the actual service life is a central theme in pavement management.
Design Life vs. Analysis Period vs. Performance Period
The terminology surrounding pavement design life is often confused because design life, analysis period, and performance period are related but distinct concepts. Understanding the differences is fundamental to proper pavement engineering.
Design Life is the time a newly constructed or reconstructed pavement is expected to perform before reaching a terminal condition. For example, a new rigid pavement designed per FAA standards has a design life of 30 years. This means the structural design (slab thickness, joint spacing, dowel bar sizing, concrete strength) is calculated to withstand the predicted traffic loading for 30 years before the pavement reaches a condition that requires major intervention.
Analysis Period is the total timeframe used in Life Cycle Cost Analysis (LCCA) to compare different design alternatives. The analysis period is typically longer than any single design life and may span 30, 40, or even 50 years. For instance, comparing a 20-year flexible pavement against a 35-year rigid pavement over a 40-year analysis period requires accounting for one rehabilitation cycle on the flexible pavement (a structural overlay at year 20) and possibly none on the rigid pavement. The analysis period must be long enough to capture the full economic implications of the different design strategies and must be the same for all alternatives being compared.
Performance Period refers to the length of time between successive rehabilitation activities. A pavement might have an initial design life of 20 years, then receive a structural overlay that provides an additional 15-year performance period, followed by another rehabilitation providing 10 years, and so on. The sum of all performance periods over a pavement’s total service life can far exceed the original design life. The concept of performance period is central to staged construction approaches, where an initial pavement is built thinner and strengthened with planned overlays to meet long-term traffic demands.
The AASHTO Guide for Design of Pavement Structures (1993) formalizes this distinction by requiring engineers to specify both the design period (the life of the initial pavement) and the analysis period (the total time horizon for economic evaluation). The FHWA publication Reformulated Pavement Remaining Service Life Framework (FHWA-HRT-13-038) further illustrates how these concepts interact: when the required performance period exceeds the predicted life of an initial design, overlays must be incorporated into the design strategy to extend the pavement’s total service life.
Parameter
Definition
Typical Value
Design Life (initial)
Target service duration before first major rehab
20 yr (flexible), 30–40 yr (rigid, FAA)
Analysis Period
Total economic evaluation horizon
30–50 yr (LCCA standard)
Performance Period
Duration between successive rehab activities
10–20 yr (overlay cycles)
Actual Service Life
Real-world duration until terminal condition
Highly variable; depends on loading, climate, maintenance
Typical Design Lives for Airport Pavements
The standard design lives used in airport pavement engineering differ between flexible and rigid pavement types, reflecting the fundamentally different structural behavior, deterioration mechanisms, and economic characteristics of each.
Flexible Pavement Design Life — 20 Years Standard
FAA AC 150/5320-6G specifies a 20-year design life as the standard for new flexible airport pavements constructed using Hot Mix Asphalt (HMA) or Asphalt Concrete (AC) surfaces. This standard applies to flexible pavements serving runways, taxiways, and apron areas at commercial service, general aviation, and reliever airports.
The 20-year convention originates from the AASHO Road Test findings, which established empirical relationships between traffic loading (expressed in Equivalent Single Axle Loads, or ESALs) and pavement performance over a two-year accelerated testing period. These relationships were extrapolated to longer design periods under the assumption that the fundamental deterioration mechanisms remain consistent over time. The 20-year design life represents a balance between initial construction cost, anticipated traffic growth, and the practical limits of extrapolating empirical models.
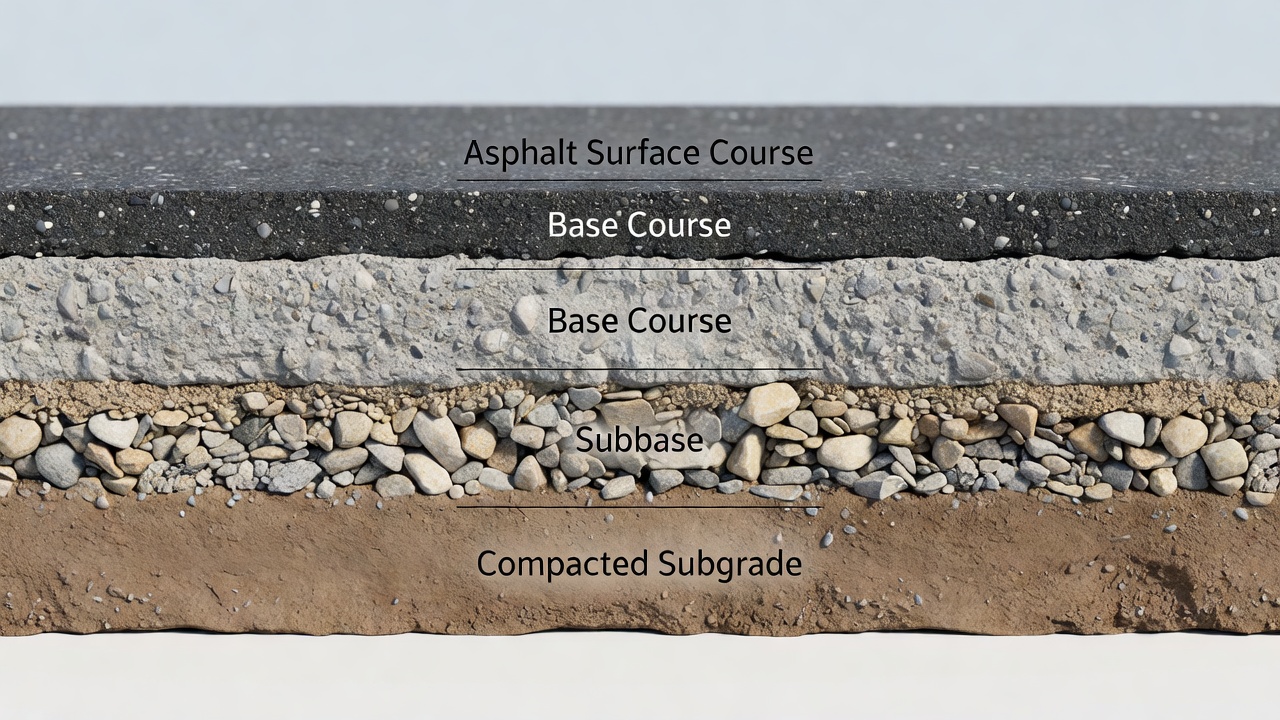
FAA’s design methodology for flexible pavements uses layered elastic analysis through the FAARFIELD (FAA Rigid and Flexible Iterative Elastic Layer Design) computer program. FAARFIELD computes the required thickness of each pavement layer (asphalt surface, base, subbase) to prevent critical tensile strains at the bottom of the asphalt layer and vertical compressive strains on the subgrade from exceeding allowable limits over the 20-year design life. The allowable strain limits are calibrated from field performance data to correspond with the onset of structural fatigue cracking (bottom-up cracking) and subgrade rutting at approximately year 20.
Rigid Pavement Design Life — 30 to 40 Years Standard
Rigid pavements constructed with Portland Cement Concrete (PCC) are assigned a longer design life of 30 years (standard) to 40 years (extended) per FAA AC 150/5320-6G. The extended life is increasingly specified for primary runways at major commercial service airports where the economic and operational consequences of closure for rehabilitation are highest.
The longer design life for rigid pavements is justified by several factors. Concrete pavements exhibit slower structural deterioration rates than flexible pavements under the same traffic loading, as the rigid slab distributes loads over a wider area through slab action rather than layered load distribution. Rigid pavements are also less susceptible to temperature-related rutting and fuel spill damage. The FAA research report Operational Life of Airport Pavements (DOT/FAA/AR-04/46) documents that properly designed concrete airport pavements have historically performed well beyond 30 years, with many exceeding 40 years of service.
The Extended Airport Pavement Life (EAPL) Program, initiated by the FAA in 2011, aims to double the expected life of runways at large hub airports from 20 to 40 years for both flexible and rigid pavements. The program funds research into improved design methodologies, advanced materials (such as high-performance concrete, polymer-modified asphalt, and fiber reinforcement), optimized construction techniques, and enhanced maintenance and rehabilitation strategies. Early phases of the EAPL program have demonstrated that extending pavement life is achievable through thicker structural sections, improved base and subbase drainage, tighter construction quality control, and the application of preventive maintenance at optimal times.
Rehabilitation Design Life — Minimum 10 Years
For pavement rehabilitation projects (overlays, slab replacements, surface recyclings), FAA requires a minimum 10-year design life. AC 150/5320-6G states that rehabilitation projects should be designed for a minimum 10-year design life and requires the engineer to provide documentation and justification of the selected design life in the project design report. This shorter period reflects the reality that rehabilitation is applied to an existing pavement structure with some degree of deterioration, and the remaining structural life of the existing layers constrains the overall performance of the rehabilitated section.
ICAO Doc 9157 Part 3 echoes this requirement, stating that “rehabilitation projects should be designed for a minimum 10-year design life” to ensure cost-effectiveness and alignment with airport capital planning cycles.
Terminal Condition and Rehabilitation Trigger
The concept of terminal condition is inseparable from design life. A pavement reaches the end of its design life when its condition deteriorates to a predefined minimum acceptable level — the terminal condition threshold. At this point, the pavement can no longer provide adequate service and requires rehabilitation or reconstruction.
Terminal Serviceability Index (pt) — AASHTO Method
The AASHO Road Test introduced the concept of Present Serviceability Index (PSI) as a quantitative measure of a pavement’s ability to serve traffic. PSI is calculated from measured pavement characteristics including roughness, cracking, patching, and rutting, on a scale from 0 (impassable) to 5 (perfect). The terminal serviceability index (pt) is the minimum acceptable PSI value that defines the end of design life.
AASHTO recommends the following terminal serviceability values:
Major highways and interstates: pt = 2.5 to 3.0
Lower-volume highways and arterials: pt = 2.0 to 2.5
Airport runways: pt values are not directly specified in AASHTO; instead, FAA uses PCI thresholds
The initial serviceability (p₀) for new pavements is typically 4.2 for flexible pavements and 4.5 for rigid pavements, based on AASHO Road Test calibration. The serviceability loss (ΔPSI = p₀ − pt) represents the total acceptable deterioration over the design life and appears as one of the key input variables in the AASHTO design equation.
Pavement Condition Index (PCI) — ASTM D5340
For airport pavements, the primary condition assessment tool is the Pavement Condition Index (PCI) defined in ASTM D5340 — Standard Test Method for Airport Pavement Condition Index Surveys. PCI rates pavement condition on a scale from 0 (failed) to 100 (excellent), based on the type, severity, and density of surface distresses.
The PCI scale and associated condition ratings are:
PCI Range
Condition Rating
Typical Action Required
86–100
Good
Routine maintenance only
71–85
Satisfactory
Minor preventive maintenance
56–70
Fair
Major preventive maintenance / minor rehab
41–55
Poor
Rehabilitation (overlay or structural repair)
26–40
Very Poor
Major rehabilitation
11–25
Serious
Reconstruction consideration
0–10
Failed
Reconstruction required
For airport pavement management, a PCI of 55 to 60 is commonly used as the terminal condition threshold that triggers rehabilitation planning. A PCI of 40 is typically the threshold for reconstruction. These values correspond to the point at which distress densities and severity levels become economically and operationally unacceptable.
Other Terminal Condition Indicators
Beyond PCI and PSI, several other distress-specific thresholds define terminal condition:
Rut depth: FAA limits rutting to a maximum of 0.5 inches (13 mm) for runways before rehabilitation is triggered
International Roughness Index (IRI): values above 200–250 inches/mile indicate roughness that affects ride quality and dynamic loading
Friction levels: FAA requires corrective action when runway friction falls below minimum friction levels specified in AC 150/5320-6G
Structural capacity ratio (SCR): the ratio of remaining structural capacity to required capacity; values below 1.0 indicate structural deficiency
Factors Affecting Actual Service Life
No pavement performs exactly as designed. The actual service life — the real-world duration from construction to the point where terminal condition is reached — depends on a complex interaction of factors that can extend or shorten the design life.
Traffic Loading Beyond Design Assumptions
The single most influential factor affecting actual service life is traffic loading. Pavements are designed for a predicted number and weight of aircraft operations over the design life. When actual traffic exceeds these predictions — higher frequency of operations, heavier aircraft, or wider gear configurations than anticipated — pavement deterioration accelerates.
The relationship between load magnitude and pavement damage is exponential. Under the AASHTO load equivalency concept, doubling the axle load increases pavement damage by a factor of approximately 16 to 40 (depending on pavement type and structural number). For airport pavements, the introduction of new aircraft types with higher wheel loads or different gear configurations (such as the Airbus A380 or Boeing 777X) can significantly shorten the service life of pavements designed for earlier-generation aircraft.
FAARFIELD and other airport pavement design programs account for the full spectrum of aircraft traffic mix — the percentage of total operations contributed by each aircraft type — using cumulative damage factors. When the actual traffic mix differs from the design mix, the cumulative damage diverges from the design prediction, altering the actual service life.
Climate and Environmental Conditions
Temperature extremes, freeze-thaw cycles, precipitation, and seasonal water table fluctuations all influence pavement deterioration rates. Flexible pavements are particularly susceptible to:
Thermal cracking in cold climates as asphalt binder embrittles
Moisture damage (stripping) from water infiltration into the asphalt-aggregate bond
Permanent deformation (rutting) during extended hot periods
Freeze-thaw damage to base and subgrade layers in regions with multiple annual cycles
Rigid pavements are affected by:
Thermal curling and warping from temperature differentials through the slab depth, causing edge and corner stresses
Durability cracking (D-cracking) from freeze-thaw deterioration of certain aggregate types
Alkali-silica reaction (ASR) in concrete exposed to sustained moisture
Sulfate attack in sulfate-rich subgrade or groundwater conditions
FAA Advisory Circular and ICAO design guidance require engineers to account for local climate through appropriate material selection, mix design modifications, joint spacing adjustments, and drainage design. Failure to adequately address climate is a primary cause of premature pavement failure.
Construction Quality
The gap between design intent and as-built quality can significantly reduce actual service life. Key construction quality parameters that affect life include:
Asphalt compaction: Each 1% reduction in air voids below the target can reduce fatigue life by 10–30%
Concrete strength and thickness: Variations in slab thickness or compressive strength directly affect structural capacity
Joint construction quality: Improper dowel bar placement, joint saw cut timing, or joint sealant installation leads to premature joint deterioration and faulting
Drainage system installation: Inadequate subdrain installation leads to moisture-related damage that can halve pavement life
FAA AC 150/5370-10 (Standards for Specifying Construction of Airports) provides detailed construction specifications and quality control procedures. Conformance with these specifications during construction is critical to achieving the design life.
Maintenance Quality and Timing
The type, quality, and timing of maintenance has a profound effect on actual service life. Well-timed preventive maintenance can extend pavement life by 5 to 10 years or more beyond the design life. Conversely, delayed or absent maintenance can shorten life by 10 years or more.
The pavement deterioration curve (condition vs. time) typically follows a concave shape: slow deterioration in the early years, accelerating as distresses initiate and propagate. The “fatal pothole” concept illustrates that pavements deteriorate about 40% in the first 75% of their life and 40% in the last 25% of their life. The critical period for life extension is the “window of opportunity” — the period early in the pavement’s life when condition is still good (PCI 70–100) and cost-effective preventive treatments can be applied to delay the onset of deterioration.
Treatment
Typical Timing
Life Extension
Cost Relative to Reconstruction
Crack sealing
PCI 70–85
2–5 years
1–2%
Slurry seal / microsurfacing
PCI 65–80
5–7 years
5–10%
Thin overlay (1–2 inches)
PCI 55–70
7–12 years
15–25%
Structural overlay (3–6 inches)
PCI 40–55
10–15 years
30–50%
Reconstruction
PCI < 40
20+ years
100%
Overload Operations
Aircraft overload operations — operations by aircraft exceeding the pavement’s design load-bearing capacity (as indicated by the ACN-PCN system) — can cause immediate structural damage that dramatically shortens pavement life. Even occasional overload operations can initiate structural cracks or permanent deformations that propagate under subsequent normal traffic, reducing the pavement’s remaining life disproportionately to the overload magnitude and frequency.
ICAO Annex 14 and Doc 9157 provide guidance on evaluating overload operations and their effect on pavement life. Airports must maintain records of all overload operations and assess their cumulative impact on pavement structural capacity.
Design Life in AASHTO and FAA Methods
The treatment of design life differs between the AASHTO pavement design methodology (predominantly used for highways) and the FAA methodology (used for airports), though both share common foundations.
AASHTO 1993 Design Methodology
The 1993 AASHTO Guide for Design of Pavement Structures uses an empirical equation derived from the AASHO Road Test to relate design inputs to predicted traffic capacity. The design life is implicitly handled through:
Traffic prediction: The number of 18-kip ESALs expected over the design life
Reliability (R): The probability that the pavement will perform satisfactorily over the design life, expressed as a standard normal deviate (ZR)
Overall standard deviation (So): Combined standard error of traffic prediction and performance prediction
Serviceability loss (ΔPSI): The difference between initial and terminal PSI
Subgrade resilient modulus (MR): The structural support provided by the subgrade
Structural Number (SN): The required structural capacity, converted into layer thicknesses using layer coefficients (ai) and drainage coefficients (mi)
The design equation is solved iteratively: an assumed SN is used to calculate ESAL equivalency factors for each traffic load, these are used to predict total ESALs over the design life, and the predicted ESALs are compared to the ESALs the assumed SN can support. The process repeats until convergence.
AASHTO introduces the remaining life factor in the overlay design procedure. This factor accounts for the structural condition of the existing pavement at the time of overlay: a pavement that has consumed 80% of its design life requires a thicker overlay than one that has consumed only 20% of its life, even if the required future traffic capacity is the same.
FAA FAARFIELD Design Methodology
FAA’s FAARFIELD program (FAA Rigid and Flexible Iterative Elastic Layer Design) represents the current state of the art in airport pavement design. FAARFIELD uses mechanistic-empirical (M-E) design principles:
Mechanical analysis: Computes stresses, strains, and deflections in the pavement structure under aircraft loading using layered elastic theory (flexible) or 3D finite element analysis (rigid)
Empirical calibration: Relates computed mechanical responses to pavement performance through transfer functions calibrated to field observations
The design life enters FAARFIELD through:
Traffic spectrum: The number of annual departures for each aircraft type, projected over the design life (20 years for flexible, 30-40 years for rigid)
Cumulative damage factor (CDF): Sum of damage from each aircraft type, where damage = (actual passes) / (allowable passes to failure). Design life is achieved when CDF ≤ 1.0 at the end of the design period
Allowable strain criteria: Maximum allowable tensile strain at the bottom of the asphalt layer (flexible) and maximum allowable concrete stress (rigid), calibrated to provide the specified design life
FAARFIELD’s CDF approach enables precise tracking of how different aircraft types and load configurations contribute to pavement deterioration over the design life. When CDF reaches 1.0, the pavement is predicted to have reached terminal condition.
For the FAA Extended Airport Pavement Life program, FAARFIELD is being extended to support the increased design life targets (40 years) through refined transfer functions, improved traffic characterization, and advanced material models.
ICAO Design Guidance
ICAO Doc 9157 — Aerodrome Design Manual, Part 3: Pavements provides international guidance on pavement design principles, complementing FAA standards. ICAO does not prescribe specific design life values but recommends that design life be selected based on:
The type and criticality of the pavement (runway, taxiway, apron)
Anticipated traffic levels and aircraft types
Local economic conditions and budget cycles
Compatibility with the airport master plan
ICAO accepts design methodologies from FAA (AC 150/5320-6G), AASHTO, or national standards that demonstrate equivalence. The Aircraft Classification Number — Pavement Classification Number (ACN-PCN) system, defined in ICAO Annex 14, provides the international framework for reporting pavement strength and evaluating aircraft-pavement compatibility throughout the design life.
Remaining Life Estimation from Inspection
Estimating remaining pavement life is a critical function of pavement management systems (PMS) and forms the basis for rehabilitation planning, budget forecasting, and capital programming. Remaining life is defined as the estimated time until the pavement reaches terminal condition under projected future traffic, assuming continued routine maintenance.
Visual Condition Surveys and PCI
The primary method for remaining life estimation is the Pavement Condition Index (PCI) survey per ASTM D5340. PCI surveys involve:
Dividing the pavement into sample units of approximately 5,000 sq ft (flexible) or 20 slabs (rigid)
Identifying and measuring 19 types of flexible pavement distress and 15 types of rigid pavement distress
Recording distress type, severity (low, medium, high), and quantity
Computing a deduct value for each distress using established distress-deduct curves
Subtracting the total deduct value from 100 to obtain the PCI
The PCI value is then used in performance prediction models to estimate remaining life. The most common model is the modified performance curve:
PCI_max is the initial PCI after construction (typically 100)
PCI_terminal is the PCI at terminal condition (typically 55–60 for airports)
β is the deterioration curvature parameter (typically 0.5–2.0, calibrated from local data)
For example, a pavement with a current PCI of 65, a 20-year design life, and β = 1.2 has consumed approximately 13 years of life (65% of design life consumed), leaving 7 years of remaining life before terminal condition at PCI = 55.
Structural Evaluation — FWD and Deflection Testing
While PCI assesses surface condition, Falling Weight Deflectometer (FWD) testing evaluates the structural capacity and remaining structural life of the pavement. FWD testing applies a dynamic load (typically 9,000–60,000 lbs for airport pavements) and measures the resulting pavement surface deflections at multiple sensor locations.
The measured deflection basin is analyzed through backcalculation to determine the elastic modulus (stiffness) of each pavement layer. Backcalculation uses layered elastic theory to iteratively adjust layer moduli until the computed deflections match the measured deflections.
FWD-based remaining life estimation involves:
Computing the effective structural capacity from backcalculated layer moduli
Comparing the effective capacity to the capacity required for future traffic
Expressing the ratio as a Structural Capacity Ratio (SCR) or remaining life factor
A pavement with SCR greater than 1.0 has sufficient structural capacity to serve its remaining design life; SCR less than 1.0 indicates structural deficiency and reduced remaining life. A typical criterion is that when SCR falls below 1.0 or when the computed remaining life falls below 5 years, rehabilitation planning should commence.
FWD testing is typically performed on a regular cycle of 3–5 years for airport pavements, aligned with the pavement management system update cycle.
Ground Penetrating Radar
Ground Penetrating Radar (GPR) is a non-destructive geophysical method that uses high-frequency electromagnetic pulses to image pavement layer thickness and detect subsurface anomalies. GPR provides:
Layer thickness measurements (asphalt, base, subbase) along continuous profiles
Detection of subsurface moisture, voids, and delamination
Identification of layer interfaces and variability
GPR data improves remaining life estimates by providing accurate as-built layer thicknesses (which often differ from design thicknesses) and identifying subsurface deterioration not visible from the surface.
Pavement Life Extension through Preventive Maintenance
The preservation philosophy underlying modern pavement management recognizes that timely preventive maintenance can extend pavement service life by 5 to 15 years beyond the original design life at a fraction of the cost of rehabilitation or reconstruction.
The Preservation Window
The “preservation window” is the period during which cost-effective preventive treatments can be applied — typically when the pavement PCI is between 70 and 85 (or within the first 40–60% of the design life). Treatments applied within this window cost $1–5 per square yard and yield 5–10 years of life extension. Treatments applied after the window closes (PCI below 60) typically require $15–50 per square yard for rehabilitation overlays and yield no additional life for the existing pavement structure — they merely restore lost capacity.
Preventive Treatment Types
Treatment
Description
PCI Window
Life Extension
Crack sealing
Routing and filling cracks to prevent water infiltration
70–85
2–4 years
Fog seal
Light application of diluted asphalt emulsion
75–85
1–3 years
Slurry seal
Mixture of emulsion, aggregate, and fillers applied in thin layer
65–80
3–5 years
Microsurfacing
Polymer-modified slurry with controlled-set properties
60–80
5–7 years
Thin overlay (HMA)
1.0–1.5 inch HMA layer
55–70
7–10 years
Diamond grinding
Concrete surface restoration for friction and smoothness
60–80 (rigid)
5–10 years
Each treatment effectively resets the deterioration clock for the surface layer, though the underlying structural deterioration continues. The combination of preventive maintenance at optimal intervals and structural rehabilitation at the end of the design life represents the most cost-effective lifecycle strategy.
Life Cycle Cost Analysis and Design Life Selection
Life Cycle Cost Analysis (LCCA) is the economic framework used to select the optimal design life and pavement type for a given project. LCCA compares the total costs of competing design alternatives over a common analysis period, accounting for initial construction, future maintenance, rehabilitation, and user costs.
LCCA Methodology for Airport Pavements
The FAA and ICAO recommend LCCA as the basis for pavement type selection. The standard LCCA approach follows these steps:
Establish the analysis period: Typically 30–50 years for airport pavements, aligned with the airport master plan horizon
Identify design alternatives: At least two alternatives differing in pavement type (flexible vs. rigid), design life (20 vs. 40 years), or construction strategy (conventional vs. staged)
Establish performance periods and rehabilitation timing: Determine when each alternative will reach terminal condition and what rehabilitation will be required
Estimate agency costs: Initial construction, routine maintenance, periodic preventive maintenance, rehabilitation, and reconstruction costs in current dollars
Estimate user costs: Costs of delay, aircraft operating cost increases, and revenue loss during construction or rehabilitation periods (required for FAA-funded projects)
Discount future costs to present value: Using the discount rate specified by Office of Management and Budget (OMB) Circular A-94 (typically 2–4% real discount rate)
Calculate Net Present Value (NPV) and Equivalent Uniform Annual Cost (EUAC)
Perform sensitivity analysis: Vary key assumptions (traffic growth rate, discount rate, rehabilitation timing) to test the robustness of the selection
Design Life Selection Criteria
The optimal design life balances:
Initial construction cost: Increases with longer design life (thicker sections, higher-quality materials)
Future rehabilitation cost: Decreases with longer design life (fewer rehabilitation cycles)
User delay cost: Decreases with longer design life (fewer closures for rehabilitation)
Risk of premature failure: Increases with uncertainty in traffic forecasts and climate projections
A longer design life (30–40 years vs. 20 years) is economically justified when:
Traffic is high and disruption costs from closures are large
Traffic growth is predictable
Future congestion makes closures operationally unacceptable
Subgrade conditions are favorable
Quality materials and construction are available
For major hub airports with high traffic volumes, the FAA’s EAPL program has demonstrated that the 40-year design life yields the lowest total life cycle cost despite higher initial investment. The cost of even a single runway closure for rehabilitation at a major airport can exceed $50 million in airline delay costs alone.
Design Life and Pavement Management
Pavement management systems (PMS) use design life as a fundamental reference parameter for deterioration modeling, budget forecasting, and investment optimization. The integration of design life into pavement management follows a structured cycle.
Pavement Management Workflow
Pavement inventory: Record pavement sections, construction history, design life, layer thicknesses, and material types in the PMS database
Condition assessment: Conduct periodic PCI surveys (annually or biennially) and FWD testing (every 3–5 years) to measure current condition
Deterioration modeling: Develop or calibrate performance prediction models that estimate future condition based on current condition, age, design life, traffic, and maintenance history
Remaining life computation: Calculate remaining years to terminal condition using the deterioration model
Rehabilitation need identification: Identify sections requiring rehabilitation within the planning horizon (typically 5–10 years)
Budget optimization: Prioritize projects and treatment types within available budget to maximize system-wide condition
Performance monitoring: Track actual condition vs. predicted condition and recalibrate models
Performance Prediction Models
The most common PMS performance models for remaining life estimation include:
Linear model: PCI = PCI₀ − (age × slope)
Simplest form but does not capture the accelerating deterioration pattern observed in real pavements.
Exponential model: PCI = PCI₀ × e^(−α × age)
Captures nonlinear deterioration but may overestimate early life deterioration.
Family curves: Pavements grouped by construction type, traffic level, climate zone, and maintenance history. A family curve is developed from historical data for each group and used to predict future condition for individual pavements in the group.
The choice of model depends on data availability, the range of PCI values in the network, and the sophistication of the PMS. Airports with long-term PCI data (10+ years) can calibrate models to local conditions, significantly improving remaining life prediction accuracy.
Network-Level vs. Project-Level Analysis
Network-level pavement management uses design life and deterioration models to:
Forecast future condition across the entire pavement network
Estimate budget requirements for maintaining target condition levels
Optimize the allocation of maintenance and rehabilitation funds
Identify the optimal mix of preventive maintenance, rehabilitation, and reconstruction
Project-level analysis uses detailed design life and remaining life data to:
Select the most cost-effective treatment type for a specific pavement section
Design rehabilitation thickness and materials based on remaining life of existing structure
Schedule construction to minimize operational disruption
Inspection for Life Consumption Assessment
Periodic inspection is the mechanism through which design life consumption is measured and remaining life is estimated. Inspection provides the empirical data that bridges the gap between the theoretical design and the actual pavement condition.
Inspection Types and Frequencies
Inspection Type
Method
Frequency
Life Assessment Output
Visual condition survey
PCI per ASTM D5340
Annual to biennial
Current PCI, distress identification
Roughness measurement
Profilograph, inertial profiler (IRI)
Annual
Ride quality, dynamic loading
Friction measurement
Continuous friction measuring equipment (CFME)
Quarterly to annual
Safety condition, surface life
Structural evaluation
FWD, HWD
3–5 years
Layer moduli, structural capacity, remaining life
GPR survey
Ground penetrating radar
5 years (or with FWD)
Layer thickness, subsurface condition
Core sampling
Coring and lab testing
As needed
Thickness verification, material condition
Life Consumption Calculation
Life consumption is calculated by comparing the pavement’s age and current condition to the deterioration model and design life. The life consumption ratio (LCR) is:
LCR = Age / Estimated Service Life at Current Condition
Where Estimated Service Life at Current Condition is determined by projecting current PCI forward to terminal PCI using the deterioration model (extrapolated backward from current condition to the condition curve).
Example: A 12-year-old flexible pavement with design life of 20 years has a current PCI of 72 and a modeled terminal PCI of 55 at year 20. The age-based life consumption is 12/20 = 60%. However, if the deterioration model shows that PCI = 72 corresponds to a “model age” of 14 years (the age at which the model predicts PCI = 72), then the condition-based life consumption is 14/20 = 70%, indicating the pavement is deteriorating faster than designed.
Remaining Life from Nondestructive Testing
FWD-based remaining life estimation follows a different methodology:
Backcalculate the effective structural number (SN_eff) or effective slab modulus (E_eff)
Compute the required structural number (SN_req) for remaining traffic
Calculate the Structural Capacity Ratio: SCR = SN_eff / SN_req
The relationship between SCR and remaining life is nonlinear. A pavement with SCR = 1.2 at mid-life has consumed approximately 50% of its structural life, while a pavement with SCR = 0.85 is structurally deficient and may have less than 5% remaining life regardless of surface condition.
Reporting and Decision Framework
The output of life consumption assessment is typically presented in a pavement condition report or pavement management system dashboard. Key metrics reported include:
Current PCI and condition rating
Age since last construction or major rehabilitation
Design life and years remaining based on model projection
Recommended treatment and optimal timing window
Budget requirement for recommended treatment
Risk level (high, medium, low) of premature failure
This information feeds directly into the airport’s capital improvement plan (CIP), allowing pavement rehabilitation to be programmed 3–7 years in advance. The integration of design life concepts with regular inspection data transforms pavement management from a reactive process (repairing when failures occur) to a proactive process (intervening before failure to maximize life and minimize cost).
Summary of Key Design Life Principles
Pavement design life is a foundational concept that connects structural design, construction quality, maintenance strategy, and management decision-making. The key principles to remember are:
Design life is a planning target: It guides structural design and thickness selection but does not guarantee a specific service life
Terminal condition defines end of life: The threshold at which rehabilitation is triggered is defined by PCI, PSI, or distress-specific criteria
Actual service life varies: Traffic, climate, construction quality, and maintenance determine whether a pavement meets, exceeds, or falls short of its design life
Preventive maintenance extends life: Timely treatments applied within the preservation window can add 5–15 years beyond the design life
Inspection tracks life consumption: PCI surveys, FWD testing, and other nondestructive evaluation methods provide the data needed to estimate remaining life
Life cycle cost analysis optimizes design life selection: Longer design lives are economically justified where traffic is high and closure costs are significant
Pavement management integrates design life: PMS databases, deterioration models, and budget optimization tools use design life as a core parameter
For airport pavement engineers, managers, and operators, understanding design life is essential for making informed decisions about pavement investment, maintenance timing, and capital planning that ensure safe, efficient, and cost-effective airfield operations over the long term.
Frequently Asked Questions
Pavement design life is the planned period — typically 20 years for flexible and 30-40 years for rigid airport pavements — that a pavement is engineered to serve before needing major rehabilitation or reconstruction. It is a design target, not a guaranteed lifespan. The actual service life may be shorter or longer depending on traffic loads, climate conditions, material quality, and maintenance practices.
Design life is the time a new pavement is engineered to last before major rehabilitation. Analysis period is the total time horizon used in life cycle cost analysis (typically 30-50 years), which may include multiple rehabilitation cycles. Performance period is the time between successive rehabilitation activities (e.g., between an overlay and the next major treatment).
Remaining life is estimated using visual condition surveys (Pavement Condition Index or PCI), nondestructive testing (Falling Weight Deflectometer or FWD), and structural evaluation. PCI assesses surface distress, while FWD measures structural capacity. These data are compared to terminal condition thresholds and deterioration models to estimate how many years of service remain before rehabilitation is required.
Key factors include: traffic loading (number and weight of aircraft operations exceeding design assumptions), climate and environmental conditions (freeze-thaw cycles, temperature extremes, precipitation), subgrade quality and drainage, construction quality, material properties, and the type and timing of preventive maintenance. Overload aircraft operations can significantly shorten service life.
The FAA's Extended Airport Pavement Life (EAPL) program aims to double runway pavement life at large hub airports from 20 to 40 years through improved design methodologies, advanced materials, and optimized construction and maintenance practices. This shifts the design paradigm from a 20-year replacement cycle to a longer-term investment approach for critical airfield pavements.
Terminal condition is the predefined threshold of pavement deterioration that triggers the need for rehabilitation or reconstruction. For airport pavements, a PCI of 40-55 (out of 100) typically indicates the end of design life. For highways using AASHTO methods, terminal serviceability index (pt) values of 1.5 to 3.0 are used depending on road classification.
Life Cycle Cost Analysis (LCCA) compares the total costs of different pavement design alternatives over a common analysis period (typically 30-50 years). Alternatives with longer design lives may have higher initial costs but lower rehabilitation costs over the analysis period. LCCA allows agencies to select the most cost-effective strategy considering initial construction, future maintenance, rehabilitation, and user delay costs.
Pavement management systems use design life as a reference point for deterioration modeling, budget forecasting, and rehabilitation prioritization. By knowing the original design life and tracking actual condition through periodic inspections, PMS tools can project when a pavement will reach terminal condition, schedule interventions, and optimize maintenance and capital spending across a pavement network.
Optimize Your Pavement Lifecycle Management
Extend the service life of your airport pavements with data-driven inspection, condition assessment, and lifecycle planning. Our solutions help you track remaining life and optimize rehabilitation timing. Consult our experts today.
Pavement thickness design determines the layer thicknesses required to support traffic loads over the design life. Methods include empirical (AASHTO 1993; FAA C...
Airport pavement is the engineered surface for aircraft operations—runways, taxiways, aprons—designed to withstand heavy loads, ensure safety, and support airpo...
Understand the difference between design life, expected useful lifetime, service life, and related terms in engineering and asset management. Learn how these co...
5 min read
Engineering
Asset Management
+3
Cookie Consent We use cookies to enhance your browsing experience and analyze our traffic. See our privacy policy.