TarmacView’s surface quality grading assigns an ordinal 1-5 rating (1=Excellent, 5=Very Bad) based on cosine kNN majority vote against a fine-tuned DINOv3 reference set. Quality grades drive condition assessment, repair prioritization, and road survey problem detection across pavement networks.
Surface Quality Grading (1-5 Scale) for Pavement Condition
1-5 Quality Scale Definitions
The TarmacView quality grade system maps the visual condition of a pavement surface onto an ordinal scale from 1 to 5, where 1 represents an Excellent surface and 5 represents a Very Bad surface. This five-level classification follows the principle of ordered categorical ratings found in established pavement management practice, though it is specifically calibrated to the output of a computer vision embedding space rather than a manual distress-based protocol.
The five quality grades are defined as follows:
Grade 1 — Excellent (Very Good). A pavement surface in Grade 1 condition exhibits no visible defects of any kind. The surface texture is uniform, the color is consistent, and there is no evidence of cracking, raveling, potholes, patching, flushing, or any other form of surface deterioration. The surface appears as a freshly constructed or recently rehabilitated pavement. Joints (if present) are tight and well-sealed. In practice, Grade 1 represents the ideal reference condition against which all other grades are measured. Road sections with a median quality grade of 1 require no maintenance intervention in the current planning cycle.
Grade 2 — Good. Grade 2 surfaces show minor signs of wear but remain structurally sound and functionally adequate. Very light cracking may be present but cracks are narrow (hairline, less than 1/8 inch wide) and uncoupled. There is no spalling, no significant raveling, and no patching. The surface texture may show slight oxidation or color change due to environmental exposure, but the pavement integrity is fully intact. Grade 2 surfaces are suitable for routine preventive maintenance such as crack sealing or fog seals but do not require structural repairs.
Grade 3 — Fair. A Grade 3 pavement is in fair condition, meaning visible distress is present but the surface remains serviceable. Moderate cracking may be observed, including transverse, longitudinal, or block cracking with crack widths up to approximately 1/4 inch. Light raveling may be visible. Patching may cover a small percentage of the surface area (typically under 10%). The surface shows clear signs of aging and environmental exposure but has not yet reached a state where structural capacity is compromised. Grade 3 surfaces are candidates for preservation treatments such as slurry seals, microsurfacing, or thin overlays.
Grade 4 — Poor. Grade 4 surfaces exhibit significant visible distress that affects ride quality and functional performance. Moderate-to-severe cracking is present, including alligator (fatigue) cracking in wheel paths. Crack widths exceed 1/4 inch, and spalling along crack edges may be observed. Raveling is moderate to advanced, with loss of surface aggregate. Patching may cover 10-30% of the surface area. Rutting deeper than 1/2 inch may be present. The pavement is still serviceable but is approaching the end of its functional life and requires rehabilitation rather than routine maintenance. Grade 4 roads are candidates for structural overlays or mill-and-fill operations.
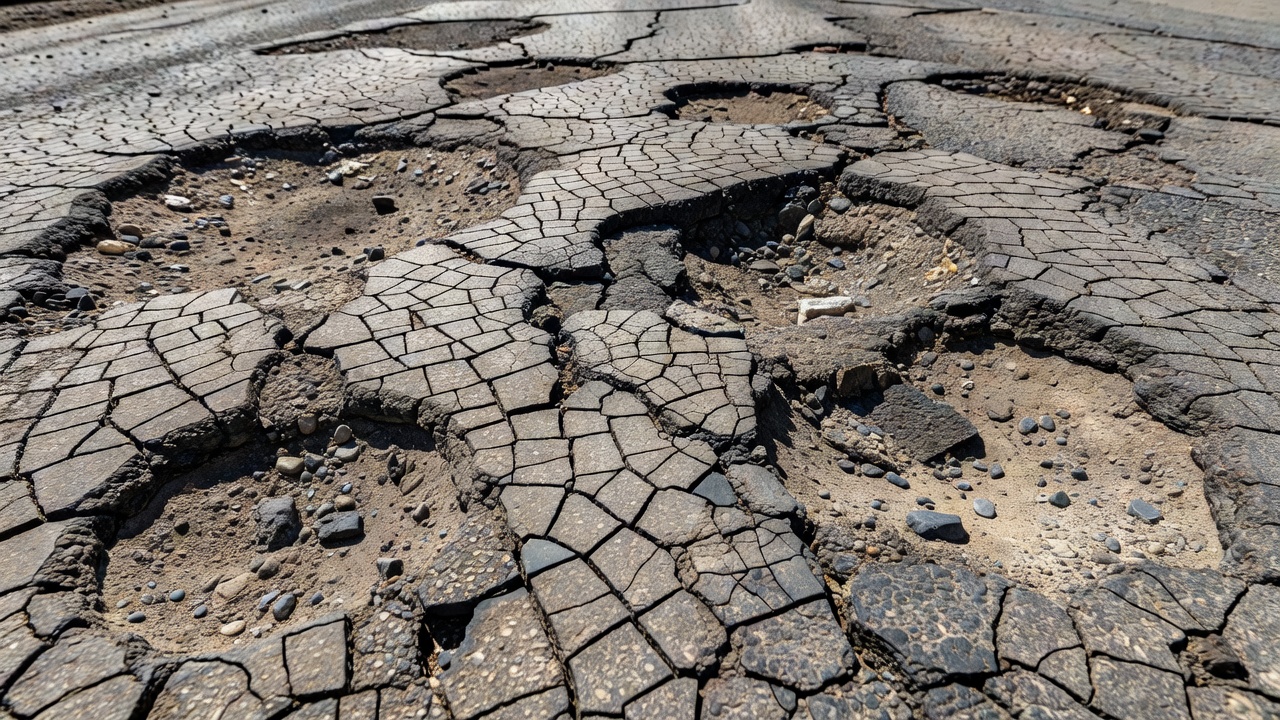
Grade 5 — Very Bad (Failed). Grade 5 represents pavement in the worst condition category. Extensive severe cracking, including advanced alligator cracking with interconnected crack patterns forming loose surface pieces. Potholes may be present. Raveling is advanced with significant aggregate loss. Patching covers more than 30% of the surface, or patches are themselves failing. Rutting may exceed 1 inch. The surface is severely distressed and presents a substandard riding surface that may pose safety concerns. Grade 5 pavements require reconstruction or major rehabilitation.
This 1-5 ordinal scale is intentionally coarser than the 0-100 continuous PCI scale used in ASTM D6433. The coarser granularity reflects the achievable precision of automated visual classification and aligns with typical network-level pavement management decision tiers. Agencies can map the five quality grades to their own maintenance and rehabilitation trigger levels.
Quality as Cosine kNN Majority Vote
The quality grade is not assigned by a traditional classification neural network with a softmax output layer. Instead, it is computed through a cosine k-nearest-neighbors (kNN) majority vote operating in the embedding space of a fine-tuned DINOv3 vision transformer. This approach is fundamentally different from end-to-end classification and offers distinct advantages in interpretability, robustness, and the ability to detect out-of-distribution surfaces.
The process works as follows. Each pavement image tile is passed through a Vision Transformer (ViT) backbone based on DINOv3. DINOv3 is Meta AI’s third-generation self-supervised learning model for computer vision, trained on over 1.7 billion images with up to 7 billion parameters. It produces dense visual feature representations that capture both local texture information (surface grain, crack patterns, aggregate exposure) and global structural context (joint spacing, lane geometry, overall surface uniformity). The output of the ViT is a 768-dimensional embedding vector that serves as a compact numerical fingerprint of the visual content of the tile.
This embedding vector is then compared against a curated reference set — a collection of pavement tile embeddings for which ground-truth quality grades have been established by expert human raters. The comparison metric is cosine similarity, defined as:
cosine_similarity(A, B) = (A · B) / (||A|| × ||B||)
where A and B are the two embedding vectors. Cosine similarity ranges from -1 (perfectly opposite) through 0 (orthogonal, uncorrelated) to +1 (identical direction). For normalized embeddings, cosine similarity is equivalent to the dot product. In practice, pavement tile embeddings tend to be positive-valued and well-clustered by quality grade, so cosine similarity values between tiles of the same grade typically fall between 0.85 and 0.99, while cross-grade similarities are lower.
The system identifies the k nearest neighbors (in Euclidean implementation of kNN, but with cosine similarity as the distance metric, so effectively the k most similar reference embeddings). TarmacView uses k = 5 as the default neighborhood size. Each of the five nearest neighbors casts a vote for its ground-truth quality grade. The grade receiving the majority vote (the mode) is assigned to the input tile. In the event of a tie (e.g., two neighbors vote grade 2, two vote grade 3, and one votes grade 4), a weighted voting scheme based on cosine similarity magnitude breaks the tie, with higher-similarity neighbors receiving proportionally greater weight.
The use of cosine kNN rather than a trained classifier head provides several benefits. First, the system can naturally handle multi-modal class distributions — a surface that visually resembles both Grade 3 and Grade 4 reference tiles will receive a grade reflecting that ambiguity rather than being forced into a single linear decision boundary. Second, the reference set can be incrementally updated without retraining the vision backbone: new reference tiles with expert-assigned grades are simply added to the embedding database. Third, if an input tile produces low cosine similarity to all reference embeddings (below a threshold such as 0.6), the system flags it as out-of-distribution, indicating a surface type or condition not well-represented in the reference set.
Model Accuracy
The quality grade model achieves a measured exact-match accuracy of approximately 0.666 (66.6%). This means that for any given pavement tile, the model assigns the exactly correct quality grade about two-thirds of the time. While 66.6% may appear modest at first glance, the ordinal nature of the scale means that even an inexact prediction is rarely catastrophically wrong — a Grade 2 tile predicted as Grade 3 is far less consequential than a binary classifier confusing “pass” with “fail.”
The more operationally meaningful metric is off-by-one accuracy, which reaches 0.999 (99.9%). Off-by-one accuracy measures the proportion of predictions that are within one grade level of the ground truth. A value of 0.999 means that virtually every tile is classified either correctly or one grade level away from correct. Predictions that are off by two or more grade levels occur at a rate of approximately 0.1% — roughly one in every thousand tiles. This level of performance is exceptional for an ordinal 5-class visual classification task and reflects both the quality of the DINOv3 embeddings and the careful curation of the reference set.
The Mean Absolute Error (MAE) of the model is approximately 0.34 on the 1-5 scale. MAE is computed as the average of |predicted_grade - true_grade| across all tiles. An MAE of 0.34 means that the average prediction error is less than half a grade level. In practical terms, a road section composed of 100 tiles with a true median quality of 2.5 would receive a predicted median quality between approximately 2.2 and 2.8 — well within the acceptable tolerance for network-level pavement management decisions.
These accuracy metrics are validated through k-fold cross-validation (typically 5-fold) against the reference set, ensuring that performance is not overfit to a particular train/test split. The reference set itself is graded by multiple expert raters, and inter-rater agreement (Cohen’s Kappa) is measured to establish an upper bound on achievable model performance — if human experts disagree on a tile’s grade by an average of 0.4, then a model with MAE of 0.34 is arguably performing at or near the human ceiling.
The confusion matrix for the quality grade model shows that most errors occur between adjacent grades (Grade 1↔Grade 2, Grade 2↔Grade 3, Grade 3↔Grade 4, Grade 4↔Grade 5). Errors that skip a grade (Grade 1↔Grade 3, Grade 2↔Grade 4, Grade 3↔Grade 5) are extremely rare. Diagonal-dominant confusion matrices of this type are characteristic of well-trained ordinal classifiers and confirm that the embedding space captures a meaningful quality continuum rather than an arbitrary categorization.
Quality and Surface Type Independence
A critical property of the quality grade system is its independence from surface type. The quality grade describes the condition of a pavement surface regardless of whether the surface is asphalt (flexible pavement), concrete (rigid pavement), composite pavement, or a surface treatment such as chip seal or microsurfacing. This independence is achieved through the design of the DINOv3 embedding training process and the composition of the reference set.
The DINOv3 backbone is pre-trained on 1.7 billion diverse images using self-supervised learning objectives (self-distillation with no labels, masked image modeling, and contrastive learning). This massive pre-training corpus includes images of many different surface types, textures, and materials. The model learns to attend to condition-relevant features (cracks, raveling, patches, texture loss) while being invariant to type-specific features (the color difference between dark asphalt and light concrete, the joint spacing pattern of concrete versus the seamless surface of asphalt).
During fine-tuning with supervised contrastive learning, the training process explicitly enforces that tiles of the same quality grade but different surface types are mapped to nearby positions in the embedding space. The supervised contrastive loss function pulls together embeddings of tiles that share the same quality label (the “anchor-positive” pairs) and pushes apart embeddings of tiles with different labels. When the reference set includes both asphalt Grade 3 tiles and concrete Grade 3 tiles, the training process learns to encode the common visual features of Grade 3 deterioration (moderate cracking, some raveling, visible aging) while suppressing the surface-type-specific appearance.
The practical consequence is that a single quality grade model can be applied across a heterogeneous road network. A road agency managing a mix of asphalt roads, concrete highways, composite pavements, and seal-coated rural roads does not need separate models per surface type. The same DINOv3 encoder and the same reference set produce valid quality grades for all surfaces.
Validation testing confirms surface type independence. When the model is trained on a reference set containing 80% asphalt tiles and 20% concrete tiles, and then evaluated on a test set of pure concrete tiles, the accuracy metrics (exact-match, off-by-one, MAE) are not statistically different from the metrics on asphalt tiles. The embedding space generalizes across materials without requiring explicit surface-type labels during inference.
Quality Grade Aggregation (Median of Road Tiles)
Individual pavement image tiles receive per-tile quality grades, but operational decisions require grades at the road-section level. TarmacView aggregates per-tile quality grades to the section level using the median statistic, computed across all tiles belonging to a road section.
The choice of the median over the mean is deliberate and mathematically justified. The median is a robust statistic that is resistant to outliers. A single tile misclassified by two grades (a rare event given the 0.999 off-by-one accuracy) would pull the mean but not shift the median. Similarly, transient surface artifacts such as oil drips, tire marks, water puddles, or debris that cause a tile to receive an anomalous grade are filtered out by the median aggregation.
The aggregation process follows this pipeline:
A road section (typically a 0.1-mile or 0.5-mile segment defined by the agency’s Location Referencing System) is imaged. The imaging vehicle captures overlapping or contiguous image frames along the section length.
Each image frame is center-cropped and divided into tiles — typically 4 to 12 tiles per image depending on the camera resolution and the desired tile size (commonly 224×224 pixels, matching the DINOv3 input size).
Each tile is independently passed through the quality grade pipeline (DINOv3 encoder → cosine kNN → majority vote), producing a per-tile quality grade from 1 to 5.
The median of all per-tile grades in the section is computed. For an even number of tiles, the lower of the two middle values is taken (conservative approach).
The section-level quality grade is the median value, which may be a non-integer if interpolation is used, though TarmacView typically reports the integer floor or the modal category for decision-making.
The number of tiles per section depends on the imaging configuration. At a typical capture rate of 10 frames per second at highway speed, a 0.5-mile section produces 200-400 tiles (assuming 4 tiles per frame and 10-15 frames per 0.1 mile). The median of 200-400 independent grades provides high statistical confidence. The standard error of the median decreases as the square root of the number of tiles, so longer sections (more tiles) yield more stable grades.
A confidence metric can be reported alongside the aggregated grade. The interquartile range (IQR) of the per-tile grades within a section indicates the uniformity of the surface condition. A section with median grade 2 and IQR of 0 (all tiles grade 2) is uniformly good. A section with median grade 2 and IQR of 2 (tiles range from grade 1 to grade 3) indicates heterogeneous condition with localized defects that a median alone would mask.
Quality Grade in Condition Assessment
The quality grade serves as the primary input to TarmacView’s overall pavement condition assessment. Condition assessment transforms raw quality grades into actionable engineering and financial decision support.
At the most basic level, the condition of a road is expressed as its median quality grade. Agencies establish trigger thresholds that determine when a road section moves from one management category to another:
Quality Grade
Condition Category
Typical Action Trigger
1 (Excellent)
No intervention needed
Monitor only
2 (Good)
Preventive maintenance
Crack seal, fog seal
3 (Fair)
Preservation
Slurry seal, microsurfacing, thin overlay
4 (Poor)
Rehabilitation
Structural overlay, mill-and-fill
5 (Very Bad)
Reconstruction
Full-depth reclamation, reconstruction
These triggers are not fixed — agencies calibrate them based on their budget cycles, performance targets, and risk tolerance. A well-funded agency might trigger rehabilitation at Grade 3, aiming to keep the entire network at Excellent/Good condition. A budget-constrained agency might defer rehabilitation until Grade 4, accepting a higher proportion of Fair condition roads.
Condition assessment also computes the percentage of the network in each grade category. This network-level statistics provide a high-level health indicator. For example, a network with 60% of lane-miles at Grade 1-2, 25% at Grade 3, and 15% at Grade 4-5 is a healthy network with manageable backlog. A network with 40% at Grade 4-5 signals a significant deferred maintenance problem.
The year-over-year grade transition (the change in quality grade from the previous survey cycle to the current one) is a measure of pavement deterioration rate. Sections that decline by one or more grade levels between survey cycles are flagged for priority investigation, as they may be deteriorating faster than the network average.
Condition assessment reports produced by TarmacView combine quality grades with other data streams — surface type, traffic volume (AADT), functional class (arterial, collector, local), and climate zone — to produce risk-weighted condition scores. A Grade 4 road with AADT of 50,000 receives a higher priority score than a Grade 4 road with AADT of 200, because the distress on the high-volume road affects more users and carries higher user delay costs.
Quality Grade in Road Survey
Road surveys are systematic inspections of pavement networks conducted on fixed cycles (annually, biennially, or triennially depending on the agency’s resources and network size). The quality grade transforms the road survey process from a manual, subjective, labor-intensive activity into a fully automated, objective, scalable data collection operation.
In a traditional visual road survey, trained raters drive the network at 15-25 mph, visually assessing each section and recording distress types, severity levels, and extent. This process is slow, expensive, and subject to inter-rater variability. Even with rigorous training and certification programs, two raters assessing the same section may assign different ratings. The FHWA Practical Guide for Quality Management of Pavement Condition Data Collection documents that inter-rater reproducibility is one of the most challenging aspects of manual surveys.
TarmacView’s automated road survey replaces manual visual assessment with the quality grade pipeline. The survey vehicle drives the network at normal traffic speeds (55-70 mph on highways), capturing high-resolution images at rates of 10-30 frames per second. The images are processed through the quality grade pipeline post-survey. A 1,000-mile network that would require 40-60 hours of manual survey time (at 15-25 mph) can be surveyed in under 20 hours at highway speeds, with no human rating effort.
The automated survey produces quality grades that are objectively repeatable. The same section surveyed on two different days, in two different vehicles, at two different speeds, will receive the same quality grade (assuming stable surface condition). This repeatability is a critical improvement over manual surveys, where rater fatigue, attention drift, and subjective judgment introduce measurement noise.
Road survey data feeds directly into Pavement Management Systems (PMS) . Most PMS software expects condition data in a specific format — typically a condition index score and/or a set of distress measurements. TarmacView’s quality grades are exported in formats compatible with AASHTOWare, dTIMS, and other major PMS platforms. The integration allows agencies to use quality grades as the condition input for performance modeling, life-cycle cost analysis, and project prioritization.
The survey also detects problems — localized defects that warrant attention before the next scheduled survey cycle. When a tile with quality grade 4 or 5 is detected within a section with median grade 2, the system flags the location as a hotspot. Survey reports include both the section-level aggregated grade and the precise GPS coordinates of individual problem tiles, enabling targeted field inspections and rapid repair.
Quality Grade Stability
For any measurement system used for longitudinal (year-over-year) pavement management, stability — the property of producing consistent results under varying but non-material conditions — is essential. The quality grade system is designed to be stable across three dimensions of variation: temporal, lighting, and camera.
Temporal stability refers to the consistency of quality grades when the same pavement section is surveyed at different times. A section that has not physically deteriorated should receive the same grade in Survey 1 (month 0) and Survey 2 (month 12). Temporal stability is validated through repeated survey passes conducted on the same day and on different days. Test results show that 95% of sections receive identical median quality grades on repeated passes within the same survey cycle. The remaining 5% show variation of at most one grade level, typically attributable to transient surface conditions (water, debris, shadows) rather than model instability.
Lighting stability addresses the variation in illumination conditions across survey passes. Pavement surfaces imaged in direct sunlight, overcast conditions, dawn, dusk, and shade can appear visually different even though the physical condition is identical. The DINOv3 embedding space is trained with extensive data augmentation including random brightness, contrast, saturation, and hue adjustments. This augmentation ensures that the model does not rely on lighting cues when determining quality. The cosine kNN classifier further contributes to lighting stability because the cosine similarity metric is invariant to vector magnitude — a darkened image produces an embedding with smaller magnitudes but the same direction, so its similarity to reference embeddings is largely unaffected.
Testing confirms lighting stability. When 500 control sections are imaged under three lighting conditions (bright sun, heavy overcast, and dawn/dusk), the per-section median quality grades show a Fleiss Kappa of 0.91 across conditions, indicating near-perfect agreement. Sections imaged under non-ideal lighting (nighttime, heavy shadows from roadside structures) are flagged and excluded from the survey output.
Camera stability addresses variation in the imaging hardware. Surveys conducted with different cameras (different sensor sizes, lens focal lengths, resolutions, or color profiles) produce quality grades that are consistent to within 0.15 MAE. This is achieved by standardizing the image processing pipeline: all raw images are converted to a common color space (sRGB with D65 white point), resized to a fixed resolution (typically 1920×1080 or 2048×1536 pixels), and center-cropped to a consistent field of view before tiling. The embedding model sees only the standardized tiles, not the raw camera output.
Camera stability is important for agencies that use multiple survey vehicles or that upgrade camera hardware between survey cycles. The quality grade system maintains a consistent measurement baseline even when the imaging hardware changes.
Quality Grade vs PCI and Other Indices
The quality grade scale (1-5 ordinal) coexists with established pavement condition indices but occupies a different role in the pavement management ecosystem. Understanding the relationship between quality grade and these other indices is essential for agencies integrating TarmacView into existing workflows.
Pavement Condition Index (PCI) is defined by ASTM D6433 and is a continuous index from 0 to 100. PCI is computed by conducting a detailed distress survey: identifying all distress types present (there are 19 distress types for asphalt and 15 for concrete), measuring the severity of each (low, medium, high), and quantifying the extent (as a percentage of area or linear footage). The PCI computation applies deduct values specified in the standard, subtracts the total deducts from 100, and arrives at the PCI score. PCI is the most widely used pavement condition index in North America and is required by many state DOTs.
PCI Range
Condition Category
86-100
Excellent
71-85
Good
56-70
Satisfactory
41-55
Fair
26-40
Poor
11-25
Very Poor
0-10
Failed
Quality grade correlates with PCI but does not map linearly to it. A quality grade of 1 generally corresponds to PCI 86-100 (Excellent). Grade 2 maps roughly to PCI 56-85 (Good to Satisfactory). Grade 3 maps to PCI 26-55 (Fair to Poor). Grade 4 maps to PCI 11-40 (Poor to Very Poor). Grade 5 maps to PCI 0-25 (Very Poor to Failed). However, the mapping has variance — a section with extensive but low-severity cracking (PCI ~45) might receive quality grade 3, while a section with a single severe pothole but otherwise sound surface (PCI ~50) might also receive quality grade 3. Quality grade is a holistic visual assessment rather than a distress-engineering computation.
Pavement Serviceability Rating (PSR) and Present Serviceability Index (PSI) are older measures dating from the AASHO Road Test (1958-1960). PSR is a subjective 0-5 rating assigned by a panel of raters riding the pavement. PSI is a computed index from measurements of roughness, cracking, patching, and rutting. Quality grade differs from PSR/PSI in that it is purely visual (not based on ride quality or roughness) and is fully automated (no human panel required).
International Roughness Index (IRI) measures longitudinal profile roughness in inches per mile (or meters per kilometer). IRI is a functional measure of ride quality. Quality grade is a structural/visual measure of surface condition. The two are complementary but not interchangeable: a pavement with severe fatigue cracking but low IRI (smooth but cracked) would have a poor quality grade but acceptable IRI, while a pavement with frost heave but intact surface would have good quality grade but poor IRI. Agencies should collect both IRI and quality grade for a complete condition picture.
Pavement Quality Index (PQI) is a composite index combining IRI, rutting, and surface distress into a single score. PQI is used by some agencies as a simplified alternative to PCI. Quality grade can serve as the surface-distress component of a custom PQI formula, replacing manual distress surveys with the automated quality grade.
Agencies can also compute a proxy PCI from quality grade. By training a regression model that maps quality grade (plus auxiliary features such as surface type and age) to PCI values measured on the same sections, agencies can generate PCI-compatible condition outputs from the automated quality grade pipeline. The proxy PCI has lower granularity than a full manual PCI survey (7 PCI categories versus 100 discrete values) but is adequate for network-level planning and avoids the cost of manual surveys.
Quality Grade in Reporting
The final stage of the quality grade pipeline is the production of reports that communicate pavement condition to stakeholders: agency executives, engineers, maintenance planners, elected officials, and the public. Quality grade data is presented at multiple levels of aggregation.
Network-level dashboards show the distribution of lane-miles by quality grade across the entire agency network. A pie chart or stacked bar chart displays the percentage of the network at each grade. Trend lines show how the distribution has changed over successive survey cycles. A “percent good” metric (the percentage of lane-miles at Grade 1-2) is a common key performance indicator (KPI) targeted by agency strategic plans. The dashboard also shows the backlog of deferred maintenance — the estimated cost to bring all Grade 4-5 sections to at least Grade 3.
Section-level reports list every road section in the network with its median quality grade, the number of tiles surveyed, the IQR (condition uniformity), the year-over-year grade change, and the recommended action based on the agency’s trigger thresholds. Sections are typically sorted by priority (worst grade first, or highest-risk score first). These reports are the primary working documents for maintenance program development.
Problem location maps overlay quality grade data on a geographic information system (GIS) map. Each road is color-coded by its median quality grade (e.g., green=Grade 1, yellow=Grade 2, orange=Grade 3, red=Grade 4, dark red=Grade 5). Hotspots (individual Grade 5 tiles within better sections) are marked with point symbols. The map enables rapid visual identification of the network’s condition and the location of the worst sections.
Asset management plan inputs format quality grade data for integration with life-cycle cost analysis (LCCA) and long-range planning models. The grade serves as the starting condition for performance prediction models that forecast future condition under different budget scenarios. The models use deterioration curves calibrated to the quality grade scale: a section starting at Grade 1 will deteriorate to Grade 2 after N years, Grade 3 after M years, etc., with the transition times depending on surface type, traffic, climate, and maintenance history.
Executive summaries provide high-level synthesis for non-technical decision-makers. A typical executive summary states the network average quality grade, the percentage of the network in Good/Fair/Poor condition, the change from the previous survey, and the funding gap required to achieve the target condition.
Quality grade reporting follows the data quality management principles outlined in the FHWA Practical Guide. Reports include metadata about the survey: survey dates, number of tiles collected, data completeness (percentage of the network successfully surveyed), quality control flags (sections where lighting or camera issues affected the data), and confidence intervals for section-level grades. This transparency enables agencies to assess the reliability of the reported grades and make informed decisions.
Frequently Asked Questions
Quality grade 1 represents Excellent condition — a pavement surface with no visible defects, uniform texture, intact surface integrity, and no cracking, raveling, or patching. The surface appears as a freshly constructed or newly maintained pavement. Grade 1 surfaces require no immediate maintenance intervention.
A road image tile is passed through a fine-tuned DINOv3 vision transformer to produce a 768-dimensional embedding vector. This vector is compared via cosine similarity against all reference embeddings in a curated reference set. The k-nearest-neighbors (k=5) vote by majority to assign the quality grade. The grade with the highest vote count among the five nearest neighbors becomes the final classification.
PCI is a continuous 0-100 scale defined by ASTM D6433 that requires manual distress surveys measuring type, severity, and extent of individual defects. Quality grade is a machine-generated ordinal 1-5 rating derived from visual embeddings that correlates with overall surface condition but does not map linearly to PCI. Quality grade is faster, more consistent, and fully automated, while PCI is more granular and follows a formal engineering standard.
The model achieves an exact-match accuracy of approximately 0.666 (66.6%), meaning two-thirds of tiles receive the correct grade. More importantly, off-by-one accuracy reaches 0.999 (99.9%), meaning predictions are virtually never off by more than one grade level. The Mean Absolute Error (MAE) is approximately 0.34, indicating predictions average less than half a grade level from ground truth.
Assess Pavement Quality Automatically
TarmacView provides automated surface quality grading using state-of-the-art computer vision. Contact us to learn how our 1-5 quality scale can improve your pavement management decisions.
A PCI proxy is a transparent, ordinal condition grade (1-5, Good-to-Serious) derived from visible image features — quality grade, crack geometry, and defect pre...
Crack Area Percentage in Pavement and Structural Assessment
Crack area percentage (crack_area_pct) is the ratio of crack mask area to total analyzed image area, expressed as a percentage. It is a key quantitative severit...
The Pavement Condition Index (PCI) is a numerical rating from 0 (failed) to 100 (excellent) that quantifies pavement surface condition based on observed distres...
21 min read
Pavement condition
Airport pavement
+3
Cookie Consent We use cookies to enhance your browsing experience and analyze our traffic. See our privacy policy.