Resilient Modulus (Mr) is the dynamic elastic modulus of subgrade soil or unbound pavement materials under repeated (cyclic) loading, measuring recoverable strain. It is the primary material property input for the AASHTO mechanistic-empirical pavement design method. Covers laboratory determination (AASHTO T307), stress dependency, correlations with CBR, and field measurement via FWD back-calculation.
Resilient Modulus — Definition and Fundamental Concept
Resilient Modulus (Mr) is the dynamic elastic modulus of unbound pavement materials — subgrade soils, granular base courses, and subbase layers — measured under repeated (cyclic) loading conditions that simulate the stress pulses imposed by moving traffic. It is defined as the ratio of the cyclic deviator stress to the recoverable (resilient) axial strain:
Mr = σd / εr
Where σd is the repeated deviator stress (the difference between the total axial stress and the confining pressure) and εr is the resilient (recoverable) axial strain after each load cycle. The permanent (plastic) component of deformation is excluded from the calculation; only the elastic rebound that occurs upon unloading is used. This distinction is critical: resilient modulus represents the stiffness of the material under millions of repeated load applications, not its strength under a single monotonic load to failure.
The concept of resilient modulus was first formalized by Seed and colleagues at the University of California, Berkeley in the 1960s, who recognized that subgrade soils subjected to repeated traffic loading exhibit a predominantly elastic response after initial conditioning cycles, with the resilient response stabilizing after 50 to 200 load repetitions. The American Association of State Highway and Transportation Officials (AASHTO) adopted Mr as the standard material property for pavement design in the 1986 AASHTO Guide for Design of Pavement Structures, replacing the California Bearing Ratio (CBR) and the subgrade modulus of reaction (k-value) used in earlier empirical methods.
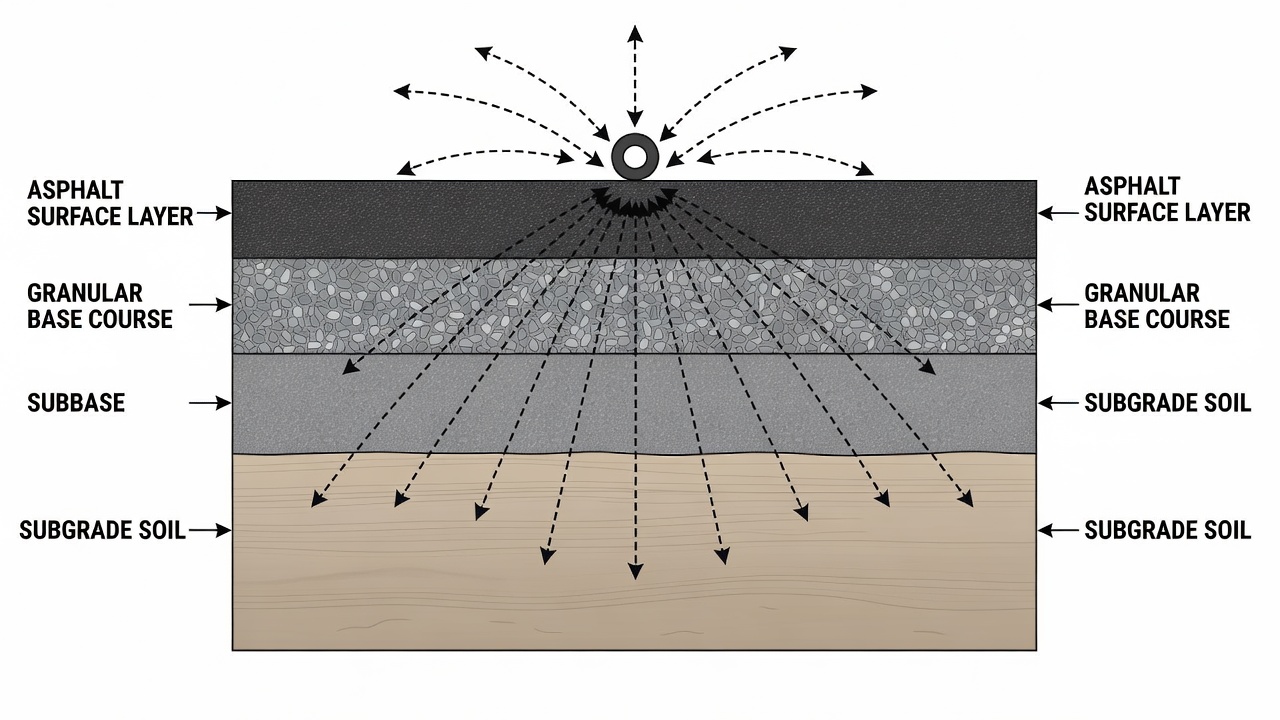
Mr is the primary material property input for unbound materials in the Mechanistic-Empirical Pavement Design Guide (MEPDG), developed under NCHRP Project 1-37A and adopted by AASHTO as the national standard for pavement design. The MEPDG uses Mr in layered elastic analysis (LEA) to compute the critical pavement responses: the horizontal tensile strain at the bottom of bound layers (controlling fatigue cracking in asphalt and concrete) and the vertical compressive strain at the top of the subgrade (controlling permanent deformation and rutting). The relative stiffness of each pavement layer — quantified by Mr — dictates the distribution of these stresses and strains within the pavement structure.
The Federal Highway Administration (FHWA) characterizes Mr as the single most important mechanical property of unbound pavement materials. The FHWA Geotechnical Aspects of Pavements Reference Manual (NHI-05-037) states: “Stiffness is the most important mechanical characteristic of unbound materials in pavements. The relative stiffnesses of the various layers dictate the distribution of stresses and strains within the pavement system.” Unlike strength, which governs failure under a single load application, stiffness governs the accumulation of damage over millions of load repetitions — the fatigue cracking and rutting that define pavement service life.
Stress-Dependency of Resilient Modulus
The defining characteristic of resilient modulus in unbound materials is its stress dependency — the modulus is not a constant value but varies with the stress state within the pavement layer. This behavior fundamentally distinguishes unbound pavement materials from linear elastic materials like steel or concrete. The stress dependency follows two distinct patterns based on material type:
For granular materials (base and subbase aggregates), Mr exhibits stress-hardening behavior: the modulus increases as the confining pressure (bulk stress) increases. This occurs because higher confinement forces aggregate particles into tighter contact, increasing the interparticle contact area and the stiffness of the granular skeleton. A granular base directly beneath the wheel load — where confining stresses are highest — exhibits a higher modulus than the same material at the bottom of the base layer or at the pavement edge where confinement is lower. This behavior is captured by the bulk stress model (k-θ model): Mr = k1 × θ^k2, where θ (bulk stress) is the sum of the three principal stresses (σ1 + σ2 + σ3), and k1 and k2 are regression constants determined from laboratory testing. For granular materials, k2 is positive, typically ranging from 0.3 to 0.8.
For fine-grained subgrade soils (clays and silts), Mr exhibits stress-softening behavior: the modulus decreases as the deviator stress increases. This occurs because higher deviator stresses approach the shear strength of the soil, causing increased particle rearrangement and larger resilient strains relative to the applied stress. A subgrade layer subjected to heavy traffic loads will exhibit a lower modulus under the wheel path than at the pavement edge. This behavior is captured by the deviator stress model: Mr = k1 × σd^k2, where k2 is negative for stress-softening materials — typically ranging from -0.1 to -0.6.
The combined effect is modeled through the universal constitutive model recommended by NCHRP Project 1-28A:
Mr = k1 × Pa × (θ/Pa)^k2 × (τoct/Pa)^k3
Where Pa is atmospheric pressure (used for normalization), τoct is the octahedral shear stress, and k1, k2, k3 are regression constants. The strength of this model is its ability to capture both stress-hardening (through θ/Pa) and stress-softening (through τoct/Pa) effects in a single equation applicable to all unbound material types.
Repeated Load Triaxial Test — AASHTO T307
The standard laboratory test for determining resilient modulus is AASHTO T307 — Standard Method of Test for Determining the Resilient Modulus of Soils and Aggregate Materials. This test method specifies the equipment, specimen preparation, loading sequences, data collection, and analysis procedures for measuring Mr under controlled laboratory conditions.
Test Equipment
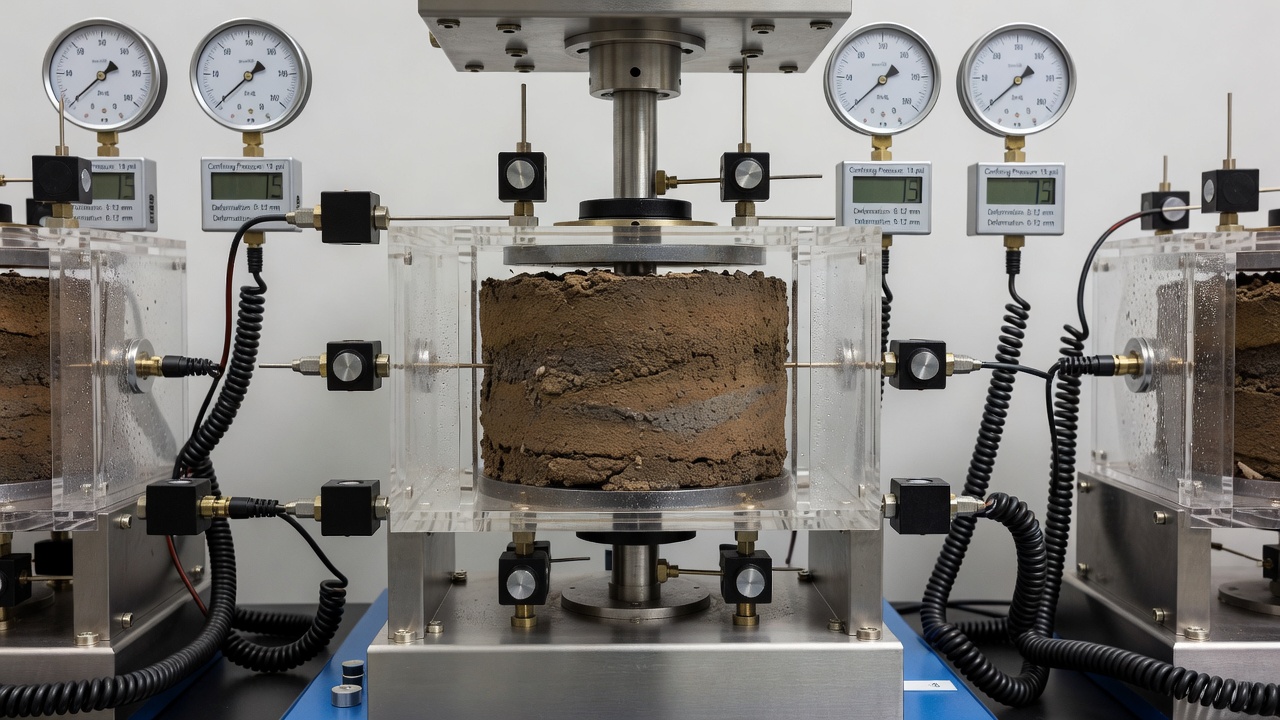
The test apparatus consists of a repeated load triaxial (RLT) system comprising: a triaxial cell chamber capable of maintaining constant confining pressure (using air or water); a loading frame and actuator (pneumatic, hydraulic, or electromechanical) capable of applying cyclic loads with a haversine waveform at frequencies of 0.5 to 1.0 Hz (typical pulse duration 0.1 seconds with 0.9 seconds rest); a load cell for measuring applied axial force with accuracy of ±0.5% of full scale; axial deformation measurement devices — typically two or more linear variable differential transformers (LVDTs) or linear encoders mounted at the specimen mid-height on diametrically opposite sides, measuring over a 100 to 150 mm gauge length with resolution of 0.0025 mm (0.0001 inch); a confining pressure system with pressure regulator and gauge capable of maintaining pressure within ±0.5 psi; and a data acquisition system sampling at a minimum of 50 Hz per channel.
A 2007 survey by the FHWA Long-Term Pavement Performance (LTPP) program found that approximately 54% of state transportation departments use resilient modulus testing for routine pavement design. However, many agencies rely on correlations due to the specialized equipment and personnel required. The LTPP program maintains a centralized database of over 4,000 Mr test results for subgrade and base materials from across North America.
Specimen Preparation
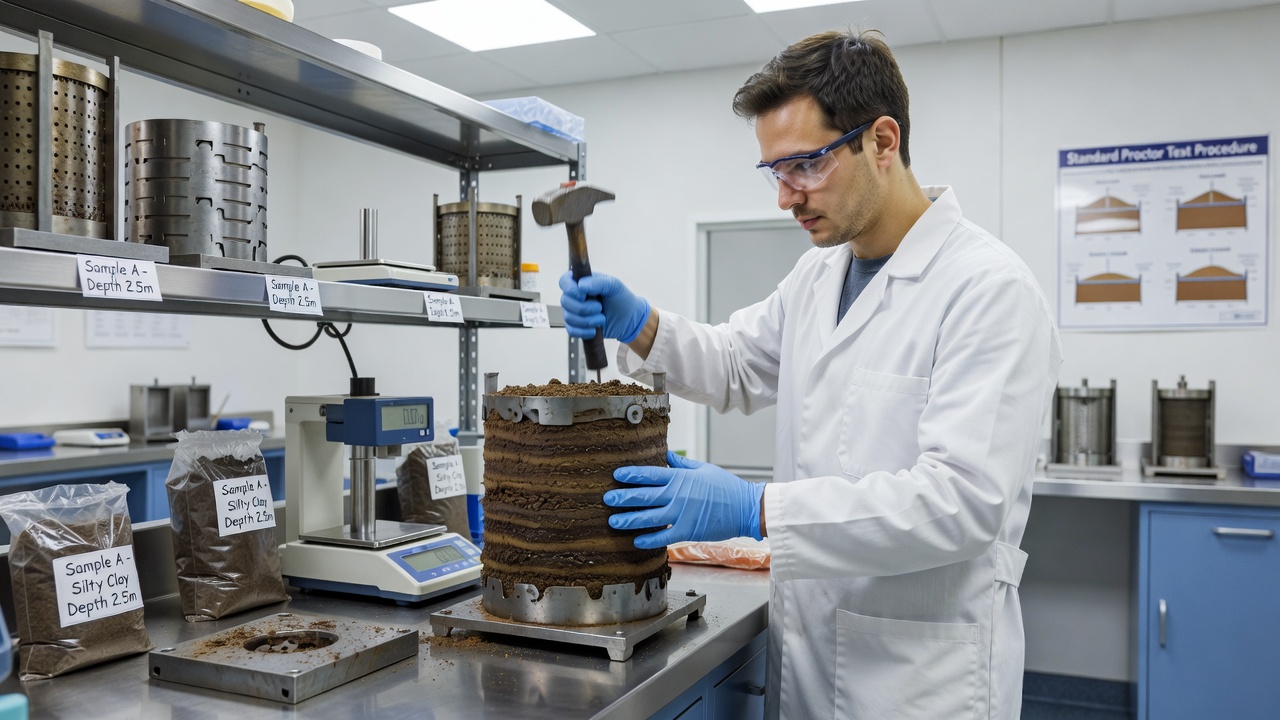
Specimen size depends on material type. For fine-grained soils (maximum particle size ≤ No. 4 sieve, 4.75 mm), specimens are 71 mm (2.8 inches) in diameter and 142 mm (5.6 inches) in height — a 2:1 height-to-diameter ratio. Specimens may be: undisturbed (trimmed from thin-wall tube samples obtained from field exploration); recompacted (compacted in 6 to 8 lifts to match field density and moisture content using Standard Proctor energy); or reconstituted (prepared at a target density and moisture content for design testing).
For granular base and subbase materials (maximum particle size up to 19 mm or 3/4 inch), specimens are 152 mm (6 inches) in diameter and 305 mm (12 inches) in height. These are compacted in 6 to 10 lifts using a vibratory compactor or manual tamping, targeting 95% to 100% of maximum dry density at optimum moisture content as determined by ASTM D698 (Standard Proctor) or ASTM D1557 (Modified Proctor).
Specimens are encased in a rubber membrane (0.3 to 0.6 mm thick) and sealed to the top cap and base platen using O-rings to prevent confining fluid entry. A vacuum of 15 to 35 kPa (2 to 5 psi) is applied during chamber assembly to maintain specimen stability.
Test Procedure
The RLT test follows a prescribed sequence of stress states that simulate the range of stresses experienced within a pavement structure. For subgrade soils, AASHTO T307 specifies 15 stress state combinations organized in 3 sequences of 5 confining pressures each:
Sequence
Confining Pressure (σ3)
Deviator Stress (σd)
Contact Stress (σcontact)
1
41.4 kPa (6 psi)
13.8-55.2 kPa (2-8 psi)
2.8 kPa (0.4 psi)
2
27.6 kPa (4 psi)
13.8-55.2 kPa (2-8 psi)
2.8 kPa (0.4 psi)
3
13.8 kPa (2 psi)
13.8-55.2 kPa (2-8 psi)
2.8 kPa (0.4 psi)
For base and subbase materials, 30 stress state combinations are specified across 5 confining pressures (103.5, 68.9, 34.5, 13.8, 6.9 kPa / 15, 10, 5, 2, 1 psi) with 6 deviator stress levels each.
Each stress state involves 100 cycles of loading, with the resilient strain recorded over the final 10 cycles (cycles 91 to 100) to ensure a stabilized response. The stress state sequence is applied from highest to lowest confining pressure to minimize the number of cycles required for stabilization. The total test duration is 3 to 6 hours for subgrade soils and 6 to 10 hours for granular materials.
Mr Calculation and Reporting
For each stress state, the resilient modulus is calculated as the average of the final 10 cycles:
Mr = (σd)avg / (εr)avg
Where (σd)avg is the average cyclic deviator stress and (εr)avg is the average resilient (recoverable) axial strain over the final 10 cycles. The reported test results include: the Mr value for each stress state combination; the regression constants k1, k2, and k3 from the constitutive model fitting; the specimen moisture content before and after testing; the specimen dry density; and a plot of Mr versus bulk stress (for granular) or deviator stress (for fine-grained soils).
Bulk Stress Model — The k-θ Model
The k-θ model (also called the bulk stress model) is the most widely used constitutive model for characterizing the stress-dependent resilient modulus of granular base and subbase materials. The model was originally proposed by researchers at the University of California, Berkeley and refined through data from the AASHO Road Test and the LTPP program.
The fundamental equation is: Mr = k1 × θ^k2 (Equation 1)
Where:
Mr = Resilient Modulus (psi or MPa)
θ = Bulk stress = σ1 + σ2 + σ3 (sum of principal stresses)
For triaxial conditions, σ1 = σ3 + σd (major principal stress), σ2 = σ3 (intermediate = minor), so θ = 3σ3 + σd
k1 and k2 = regression constants determined from laboratory test data
A normalized version using atmospheric pressure (Pa = 101.4 kPa / 14.7 psi) is also commonly used:
Mr = k1 × Pa × (θ/Pa)^k2 (Equation 2)
The normalization by Pa makes k1 dimensionless and allows comparison across different unit systems.
Interpretation of Regression Constants
k1 represents the modulus at unit bulk stress (θ = 1 unit, typically 1 psi or 1 kPa). It reflects the intrinsic stiffness of the aggregate material — its density, particle angularity, gradation quality, and mineral hardness. Higher quality aggregates (crushed, angular, well-graded) produce higher k1 values. Typical ranges for granular base materials: k1 = 4,000-12,000 psi (28-83 MPa) for the non-normalized model; k1 = 600-1,200 for the normalized model.
k2 represents the stress-hardening exponent — the rate at which Mr increases with increasing bulk stress. For granular materials, k2 is always positive, typically ranging from 0.3 to 0.8. Materials with higher k2 values exhibit greater modulus increase under confinement; these are typically clean, angular aggregates without excessive fines. Softer or more rounded aggregates (crusher run, natural gravels) show lower k2 values (0.3 to 0.5), while high-quality crushed stone shows higher values (0.5 to 0.8).
Application in Pavement Design
The k-θ model is used in finite element pavement analysis programs such as ILLI-PAVE, MICH-PAVE, and GT-PAVE, which assign different modulus values to each element within a pavement layer based on the computed stress state at that element. The iterative analysis process is:
Initialize all elements in the granular layer with an assumed modulus (e.g., k1 at θ = 1 unit)
Compute stresses in each element using the assumed modulus distribution
Calculate new modulus for each element using the bulk stress computed in step 2 and the k-θ model
Update the modulus distribution and re-compute stresses
Iterate until the modulus distribution converges (typically 4-8 iterations)
This iterative approach produces a realistic modulus gradient within the granular base — highest modulus directly beneath the wheel load at the top of the base, decreasing progressively with depth and lateral distance from the load.
Universal Model — NCHRP 1-28A
The universal constitutive model developed under NCHRP Project 1-28A extends the k-θ model to capture both stress-hardening and stress-softening effects in a single equation:
Mr = k1 × Pa × (θ/Pa)^k2 × (τoct/Pa + 1)^k3
Where τoct is the octahedral shear stress (a function of deviator stress). For granular materials, k3 is typically positive (though small), reflecting the modulus increasing with shear stress at constant bulk stress. For fine-grained subgrade soils, k3 is negative, capturing the stress-softening effect where Mr decreases as deviator stress increases at constant confining pressure. The model improves upon the simple k-θ model by accounting for the shear stress contribution, which is significant in pavement stress states where the ratio of deviator stress to confining pressure is high.
The LTPP program adopted the NCHRP 1-28A model for its resilient modulus database, standardizing the reporting of k1, k2, and k3 regression constants for over 4,000 Mr test results. These data are available through the LTPP InfoPave web portal.
Resilient Modulus vs Elastic Modulus vs Subgrade Reaction
Three related but distinct stiffness parameters are used in pavement engineering, and understanding their differences is critical for correct application.
Resilient Modulus (Mr)
Mr is measured under dynamic cyclic loading — a haversine pulse of 0.1 seconds duration (simulating the wheel load passing at highway speed) followed by a 0.9-second rest period (simulating the gap between successive wheel loads). Only the recoverable (resilient) strain is used; the permanent (plastic) strain accumulated during the load cycle is excluded. The test specimen undergoes preconditioning (50-200 cycles) until the resilient response stabilizes, after which Mr = σd / εr is calculated over the final 10 cycles of each stress state. This parameter specifically represents the elastic behavior of unbound materials under traffic conditions.
Elastic Modulus (Young’s Modulus, E)
E is measured under static or monotonic loading — typically loading the specimen to failure at a constant strain rate (0.5% to 2% per minute). Both elastic and plastic components of deformation are included in the stress-strain curve. For linear elastic materials (steel, intact concrete), Mr and E are numerically identical because the material exhibits purely elastic behavior. For geomaterials, the static E is typically 2 to 5 times lower than Mr because: (1) static loading allows more time for visco-plastic deformation to accumulate, (2) cyclic preconditioning in the Mr test stabilizes the specimen and aligns particles, and (3) the rapid Mr loading rate produces a stiffer response due to soil’s inherent rate-dependency.
Property
Resilient Modulus (Mr)
Elastic Modulus (E)
Subgrade Reaction (k)
Loading type
Dynamic cyclic (0.1 sec)
Static/monotonic
Static (plate bearing)
Strain component
Recoverable only
Total (elastic + plastic)
Total deflection
Units
Stress (psi, MPa)
Stress (psi, MPa)
Stress/length (pci, MN/m³)
Typical subgrade value
5,000-15,000 psi
2,000-6,000 psi
50-200 pci
Purpose
Pavement design (MEPDG)
Structural analysis
Rigid pavement design
Modulus of Subgrade Reaction (k-value)
The k-value (modulus of subgrade reaction) is a composite parameter used in rigid (concrete) pavement design per the 1993 AASHTO Guide. It is determined by the plate bearing test (AASHTO T222) , where a 30-inch (762 mm) diameter plate is loaded and the pressure-to-deflection ratio is measured. The k-value is not a fundamental material property — it depends on the subgrade Mr, the thickness and stiffness of base/subbase layers above the subgrade, and the plate size. The AASHTO Guide provides conversion: k = Mr / 19.4 (for k in pci and Mr in psi) for a 30-inch plate on subgrade with no base layer. With a granular base, the composite k-value is higher than that of the subgrade alone, reflecting the base’s stiffening contribution.
The MEPDG eliminates the k-value entirely for design, using Mr directly for all pavement types — flexible, rigid, and composite. The Enhanced Integrated Climatic Model (EICM) within the MEPDG adjusts Mr for seasonal moisture and temperature variations.
Mr Correlations with CBR and R-Value
While direct laboratory Mr testing per AASHTO T307 is preferred for Level 1 MEPDG design, most transportation agencies rely on correlations for Level 2 and Level 3 designs due to the cost, time, and expertise required for RLT testing. The primary correlations relate Mr to the California Bearing Ratio (CBR) and the Stabilometer R-Value.
CBR Correlation
The most widely used Mr-CBR correlation originates from the AASHO Road Test (1958-1960) in Ottawa, Illinois, where subgrade CBR values of 2-10 and corresponding Mr values were back-calculated from pavement performance data. The classic equation is:
This equation is provided in the 1993 AASHTO Guide for Design of Pavement Structures and remains the most commonly used correlation worldwide. However, it was derived for the specific subgrade conditions at the AASHO Road Test site (A-6 lean clay, CBR 2-4, Mr approximately 3,000-6,000 psi) and may not be applicable to all soil types.
Subsequent research has produced refined correlations:
TRB Circular 295 (Garber et al.): Mr = 2,555 × CBR^0.64 — developed from a database of 140 soils, applicable to a wider range of CBR (2-100) and soil types
South African (Theyse et al.): Mr = 3,500 × ln(CBR) + 3,000 — developed for granular materials (CBR 20-100)
Louisiana DOTD: Mr = 1,082 × CBR + 733 — developed for Louisiana silty clays and clayey silts
CBR Value
Mr from 1500×CBR
Mr from 2555×CBR^0.64
Typical Soil Type
2
3,000 psi (20.7 MPa)
3,882 psi (26.8 MPa)
Fat clay (CH)
5
7,500 psi (51.7 MPa)
7,160 psi (49.4 MPa)
Lean clay (CL)
10
15,000 psi (103 MPa)
11,206 psi (77.3 MPa)
Sandy clay / silt
20
30,000 psi (207 MPa)
17,539 psi (121 MPa)
Silty sand
50
75,000 psi (517 MPa)
31,260 psi (216 MPa)
Clean sand / gravel
100
150,000 psi (1,034 MPa)
49,810 psi (343 MPa)
Crushed stone base
Important limitation: The 1500×CBR correlation has a coefficient of determination (R²) of approximately 0.30 to 0.50 — meaning only 30-50% of the variation in Mr is explained by CBR alone. The 95% confidence interval is approximately ±100% of the predicted value. For Level 1 design, direct Mr testing is required.
R-Value Correlation
The Stabilometer R-Value (ASTM D2844 / AASHTO T190) measures the resistance of a compacted soil specimen to lateral displacement under vertical load. The correlation with Mr is:
This correlation was developed by the California Department of Transportation (Caltrans) based on testing of California subgrade soils. For R-values of 5 (poor subgrade) to 85 (excellent base material), Mr ranges from approximately 3,775 psi to 48,175 psi. The AASHTO MEPDG provides this correlation for Level 2 design inputs when R-value data are available.
DCP Correlation
The Dynamic Cone Penetrometer (DCP) — ASTM D6951 — measures the penetration rate (mm per blow) of a cone-tipped rod driven by an 8 kg (17.6 lb) hammer. DCP penetration rate (PR) correlates with CBR through: log₁₀(CBR) = 2.48 - 1.06 × log₁₀(PR). The Mr is then estimated from CBR using the correlations above. The DCP provides a low-cost, rapid method for field estimation of Mr, widely used for pavement construction quality assurance and existing pavement evaluation.
Resilient Modulus in MEPDG
The Mechanistic-Empirical Pavement Design Guide (MEPDG), released in 2004 under NCHRP Project 1-37A and adopted by AASHTO in 2008, uses Mr as the primary material property for all unbound pavement layers — subgrade, base, and subbase. The MEPDG provides three hierarchical design levels for Mr input, reflecting increasing accuracy and testing effort:
Level 1 — Direct Laboratory Testing
Requires actual Mr test data from the RLT test (AASHTO T307) on undisturbed or recompacted specimens at in-situ moisture and density conditions. The test yields the stress-dependent Mr response expressed through the k1, k2, k3 regression constants of the NCHRP 1-28A universal model. Level 1 provides the highest reliability and is recommended for: projects with annual average daily truck traffic (AADTT) exceeding 10,000; critical pavement sections (airport runways, interstate highways); and sites with unusual or problematic subgrade conditions (expansive clays, very low CBR, high water table).
Level 2 — Correlations
Uses Mr values estimated from correlations with CBR, R-Value, DCP, or soil index properties (plasticity index, gradation, Atterberg limits). Correlations are selected from agency-specific databases or the LTPP database. Level 2 provides intermediate reliability and is appropriate for: projects with AADTT between 1,000 and 10,000; routine pavement design where direct testing is not cost-justified; and preliminary design studies.
Level 3 — Default Values
Uses typical Mr values based on AASHTO or USCS soil classification, selected from tables in the MEPDG or agency catalogs. Level 3 provides the lowest reliability and is used for: low-volume roads (AADTT < 1,000); network-level planning and programming; and sensitivity studies where absolute accuracy is not required.
MEPDG Level 3 Default Mr Values by AASHTO Soil Classification:
AASHTO Classification
USCS Equivalent
Mr Range (psi)
Typical Mr (psi)
Description
A-1-a
GW, GP
30,000-45,000
38,000
Well-graded gravels
A-1-b
SW, SP
25,000-40,000
33,000
Coarse sands
A-2-4
SM, SC
25,000-40,000
32,000
Silty/Clayey gravels
A-2-6
SC, GC
15,000-30,000
22,000
Clayey sands/gravels
A-3
SP
20,000-35,000
28,000
Fine sands
A-4
ML, CL-ML
8,000-18,000
13,000
Silts
A-5
MH
8,000-18,000
13,000
Elastic silts
A-6
CL
5,000-12,000
8,500
Lean clays
A-7-5
MH, CH
4,000-10,000
7,000
Fat clays (high PI)
A-7-6
CH, CL
3,000-8,000
5,500
Fat clays (medium PI)
Enhanced Integrated Climatic Model (EICM)
The MEPDG uses the Enhanced Integrated Climatic Model (EICM) — developed under NCHRP Project 1-23 — to adjust Mr for seasonal variations in temperature and moisture content throughout the pavement’s design life. The EICM models: temperature profile — heat transfer through the pavement and subgrade on an hourly basis; moisture content — infiltration, evaporation, drainage, and capillary rise in unbound layers; and frost penetration — depth of freezing, thawing, and ice lens formation in seasonal frost areas.
The Mr adjustment follows a resilient modulus adjustment factor (Fm) based on the degree of saturation:
Fm = Mr(adjusted) / Mr(optimum) = (S - S_opt) / (S_max - S_opt)
Where S is the current degree of saturation, S_opt is the saturation at optimum moisture content (typically 70-85%), and S_max is the maximum saturation (typically 100%). As saturation increases above optimum, Mr decreases by 40-60% for fine-grained soils and 20-40% for granular materials. The EICM predicts month-by-month Mr values for the entire design period (typically 20-40 years), allowing the MEPDG to compute cumulative damage considering seasonal weakening.
FWD Back-Calculation of Layer Moduli
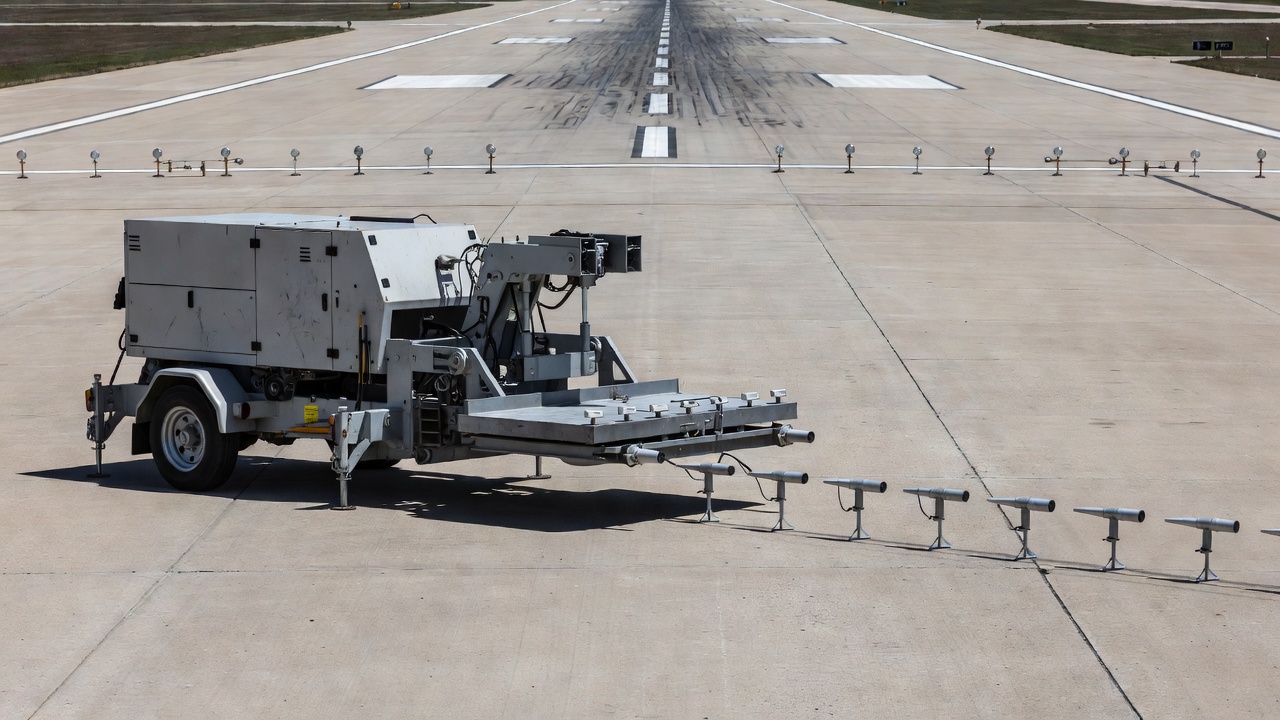
Falling Weight Deflectometer (FWD) testing is the primary non-destructive method for determining in-situ resilient modulus of existing pavement layers. The Heavy Weight Deflectometer (HWD) — capable of loads up to 320 kN (72,000 lbf) — is used for airport pavements per FAA and ICAO standards. The FWD applies a controlled impulse load (20-40 ms duration) through a 300 mm diameter segmented loading plate, and the resulting surface deflections are measured by 7-9 geophone sensors at radial distances from the load center.
Back-Calculation Process
Back-calculation is an iterative mathematical process that determines the elastic moduli of pavement layers from the measured deflection basin. The process:
Input the pavement cross-section (layer thicknesses from construction records, coring, or GPR), applied load magnitude, and measured deflections at each sensor position
Assume initial moduli for each layer (seed moduli based on material type and typical values)
Compute theoretical deflections at each sensor position using layered elastic theory (LET) or finite element analysis
Compare computed vs measured deflections, calculating the root mean square (RMS) error
Adjust layer moduli iteratively (using modified Newton-Raphson, genetic algorithms, or database optimization) to minimize RMS error
Converge when RMS error falls below 1-3% and moduli stabilize
Common back-calculation software includes ELMOD (Dynatest), EVERCALC (Washington State DOT), MODCOMP (Cornell University), MODULUS (Texas A&M), BAKFAA (FAA), and PCASE (US Army Corps of Engineers).
AASHTO 1993 Subgrade Modulus Estimation
The 1993 AASHTO Guide provides a direct equation for estimating subgrade resilient modulus from FWD deflections at far-field sensors (where the deflection is predominantly due to subgrade deformation):
MR = 0.00743 × (P / D3) (for MR in psi, P in pounds, D3 in inches)
Where P is the applied load and D3 is the deflection measured at 36 inches (914 mm) from the load center. This equation assumes: the subgrade is a linear elastic half-space; Poisson’s ratio = 0.40; the stress bulb from the applied load has spread sufficiently at 36 inches that the deflection is due only to the subgrade; and the overlying pavement layers have negligible influence at this distance.
For airport pavements, the ICAO ACR/PCR rating system uses HWD deflection data analyzed through layered elastic analysis to determine the Pavement Classification Rating (PCR) , which replaced the legacy PCN system in November 2024.
Seasonal Modulus Variation
In-situ Mr varies significantly with seasonal changes. The FHWA LTPP program has documented that subgrade modulus can vary by a factor of 2 to 5 over the year:
Spring (thaw): Mr = 0.3-0.5 times summer values (excess pore water pressure, reduced confinement)
Summer (dry): Mr = base values (optimum or below-optimum moisture)
Fall (wet): Mr = 0.6-0.8 times summer values (increased moisture from rainfall)
The MEPDG recommends FWD testing in at least two seasons (spring and summer/fall) to capture the range. Testing during the spring thaw recovery period provides the most conservative (shortest) remaining life estimate.
Resilient Modulus by Pavement Layer
Subgrade Mr
The subgrade is the foundation of the pavement structure, and its Mr value is the single most influential input for pavement design. Subgrade Mr is determined by: soil type — clay soils (A-6, A-7) have Mr of 3,000-12,000 psi (21-83 MPa); silt soils (A-4, A-5) have Mr of 8,000-18,000 psi (55-124 MPa); sand soils (A-3) have Mr of 20,000-35,000 psi (138-241 MPa); density — a 5% increase in relative compaction can increase Mr by 20-40%; moisture content — as saturation increases from 70% to 100%, Mr decreases by 40-60% for cohesive soils; stress state — subgrade Mr is stress-softening (decreases with increasing deviator stress), which means the Mr under the wheel path is lower than at the pavement edge; and suction — unsaturated fine-grained soils have higher Mr due to matric suction (negative pore water pressure) which adds effective confinement.
Granular Base Mr
The base course distributes wheel loads to the subgrade and provides the primary structural capacity of flexible pavements. Mr values: unbound granular base — 25,000-55,000 psi (172-379 MPa), depending on aggregate quality, gradation, density, and confinement; cement-treated base (CTB) — 600,000-1,000,000 psi (4,100-6,900 MPa), 10-20 times stiffer than unbound; asphalt-treated base (ATB) — 200,000-500,000 psi (1,380-3,450 MPa); lean concrete base — 1,000,000-3,000,000 psi (6,900-20,700 MPa).
Granular base Mr is stress-hardening (increases with confinement). A well-compacted crushed stone base may have Mr of 25,000 psi at low confinement (bottom of layer, between wheel loads) and 55,000 psi at high confinement (directly beneath the wheel load).
Subbase Mr
The subbase is an optional layer between the base and subgrade, providing additional load distribution, drainage, and frost protection. Mr values are intermediate between base and subgrade: granular subbase — 15,000-35,000 psi (103-241 MPa); stabilized subbase — 100,000-500,000 psi (690-3,450 MPa). The subbase Mr has a smaller effect on pavement performance than the base or subgrade Mr, but it contributes to the composite modulus of the pavement structure.
Typical Mr Values Table
The following table summarizes typical resilient modulus values for common pavement materials at optimum moisture content and standard density. These values are appropriate for Level 3 MEPDG design and preliminary estimates:
Material Type
AASHTO Class
Typical Mr (psi)
Typical Mr (MPa)
Stress Behavior
Crushed stone base
A-1-a
30,000-55,000
207-379
Stress-hardening
Sand-gravel base
A-1-b
25,000-45,000
172-310
Stress-hardening
Silty sand subbase
A-2-4
20,000-35,000
138-241
Stress-hardening
Clayey sand subbase
A-2-6
15,000-30,000
103-207
Mixed
Fine sand
A-3
20,000-35,000
138-241
Stress-hardening
Silt
A-4
8,000-18,000
55-124
Stress-softening
Lean clay
A-6
5,000-12,000
34-83
Stress-softening
Fat clay
A-7-6
3,000-8,000
21-55
Stress-softening
Cement-treated base (7d)
—
600,000-1,000,000
4,100-6,900
Linear elastic
Asphalt-treated base
—
200,000-500,000
1,380-3,450
Temperature-dependent
Lean concrete base
—
1,000,000-3,000,000
6,900-20,700
Linear elastic
Bedrock (limestone)
—
1,000,000-3,000,000
6,900-20,700
Linear elastic
Resilient Modulus in Airport Pavement Design
The International Civil Aviation Organization (ICAO) and the Federal Aviation Administration (FAA) specify resilient modulus as the primary mechanical property for airport pavement structural design and evaluation. The FAA’s FAARFIELD (FAA Rigid and Flexible Iterative Elastic Layered Design) software uses layered elastic analysis with Mr as the material input for all unbound layers.
FAA Design Inputs
The FAA Advisory Circular AC 150/5320-6G (Airport Pavement Design and Evaluation) specifies Mr values for airport pavement design based on subgrade CBR, with the following correlations:
Mr (psi) = 1,500 × CBR — for CBR values ≤ 10 (same as AASHTO)
Mr (psi) = 4,000 + 900 × CBR — for CBR values > 10 (modified for higher-strength subgrades)
For aircraft traffic areas, the FAA defines: Traffic Area A — gates, hangars, and aircraft turning areas (highest stress, requires highest quality base); Traffic Area B — runways, taxiways, and aprons (standard design); and Traffic Area C — shoulders and low-traffic areas (reduced structural requirements). The Mr of the subgrade in Traffic Area A is adjusted downward by 33% to account for higher shear stresses during aircraft turning and parking operations.
ICAO ACR/PCR System
The Aircraft Classification Rating / Pavement Classification Rating (ACR/PCR) system — approved by ICAO in 2019 and mandated from November 2024 — uses Mr as the fundamental input for airport pavement strength rating. The PCR is calculated from FWD/HWD deflection data through layered elastic analysis using the FAARFIELD methodology. The procedure: field testing — HWD testing at 25-50 m intervals on runways and taxiways, with 4 load drops per test point; back-calculation — determination of Mr for each pavement layer using BAKFAA or equivalent software; critical strain computation — calculation of horizontal tensile strain at the bottom of bound layers and vertical compressive strain at the top of the subgrade for each aircraft in the design traffic mix; and PCR determination — the maximum allowable pavement load rating based on the computed strains.
FAA P-208 and P-209 Base Materials
The FAA specifications for aggregate base courses directly reference Mr for quality assurance. FAA Item P-208 (Aggregate Base Course) is limited to aircraft gross loads ≤ 60,000 lbs (27,200 kg) and requires Mr ≥ 20,000 psi (138 MPa) at optimum moisture. FAA Item P-209 (Crushed Aggregate Base Course) is for loads > 60,000 lbs and requires Mr ≥ 25,000 psi (172 MPa) at optimum moisture. These minimum Mr values are verified through: laboratory RLT testing per AASHTO T307 on samples obtained during construction; FWD/HWD testing on completed base layers before surface placement; and DCP testing as a rapid field quality control tool.
Summary
Resilient Modulus (Mr) is the fundamental mechanical property that quantifies the elastic stiffness of subgrade soils, granular bases, and subbase materials under cyclic traffic loading. Its stress-dependent nature — stress-hardening in granular materials and stress-softening in cohesive soils — requires sophisticated characterization through the repeated load triaxial test (AASHTO T307). The bulk stress (k-θ) model and the universal NCHRP 1-28A constitutive model capture this stress dependency mathematically through regression constants k1, k2, and k3.
Mr is the primary material input for the AASHTO MEPDG, used in layered elastic analysis to compute the critical tensile and compressive strains that control pavement fatigue cracking and rutting. The MEPDG provides three hierarchical design levels: Level 1 (direct Mr testing), Level 2 (correlations with CBR, R-Value, DCP), and Level 3 (default values by soil classification).
Field estimation of Mr through FWD/HWD back-calculation enables structural evaluation of existing pavements, seasonal modulus monitoring, and determination of the ICAO ACR/PCR airport pavement strength rating. Correlations with CBR (Mr = 1500 × CBR) and R-Value (Mr = 1000 + 555 × R) provide backward compatibility with legacy design methods and allow Mr estimation from commonly available soil test data.
The accurate determination and application of Mr values directly affect pavement thickness design, construction costs, and long-term performance. As pavement design transitions from empirical to mechanistic-empirical methods worldwide, resilient modulus has become the central material property linking laboratory characterization, field evaluation, and structural design of pavement systems.
Frequently Asked Questions
Resilient Modulus (Mr) is the dynamic elastic stiffness of subgrade soils and unbound pavement materials under cyclic loading, defined as the ratio of cyclic deviator stress to recoverable (resilient) axial strain. It is the primary material property input for mechanistic-empirical pavement design (MEPDG) as specified in AASHTO and NCHRP 1-37A. Mr replaces the California Bearing Ratio (CBR) and subgrade modulus of reaction (k-value) used in earlier empirical design methods. It is important because it directly controls stress distribution and critical pavement responses — horizontal tensile strain at the bottom of bound layers (fatigue cracking) and vertical compressive strain at the top of the subgrade (rutting). Accurate Mr values enable designers to optimize layer thicknesses, reducing both construction costs and long-term maintenance needs.
Resilient Modulus is determined through the repeated load triaxial test per AASHTO T307. A cylindrical soil specimen (typically 71 mm diameter for fine-grained, 152 mm for granular) is placed in a triaxial chamber and subjected to a constant confining pressure while a cyclic deviator stress (haversine pulse, 0.1 sec load, 0.9 sec rest) is applied. The test sequence includes 15 stress state combinations for subgrade soils and 30 combinations for base/subbase materials, with confining pressures from 2 to 6 psi and deviator stresses from 2 to 20 psi. The resilient (recoverable) axial strain is measured over the final 10 cycles of each sequence, and Mr is calculated as σd / εr. External LVDTs or internal on-specimen sensors mounted at mid-height measure the axial deformation. The test yields the nonlinear stress-dependent Mr response, and regression constants (k1, k2, k3) are computed for use in constitutive models.
The k-θ or bulk stress model describes the stress-dependent behavior of granular materials. The model expresses Mr = k1 × θ^k2, where θ (theta) is the bulk stress (sum of principal stresses = σ1 + σ2 + σ3 = σd + 3×σ3 for triaxial conditions), k1 and k2 are regression constants determined from laboratory test data, and Pa is atmospheric pressure (used for normalization). For granular materials, k2 is positive (typically 0.4 to 0.8), reflecting stress-hardening behavior — the modulus increases as confining stress increases. For fine-grained subgrade soils, the model is modified to account for stress-softening: Mr = k1 × (σd)^k2 with negative k2. The universal NCHRP 1-28A model combined both: Mr = k1 × Pa × (θ/Pa)^k2 × (τoct/Pa)^k3, capturing both bulk stress and shear stress effects.
For subgrade soils, resilient modulus correlates empirically with California Bearing Ratio (CBR) and Stabilometer R-value, allowing estimation of Mr from these more common tests. The primary AASHTO correlation is Mr (psi) = 1500 × CBR for fine-grained soils with CBR ≤ 10 (based on the AASHO Road Test). More refined equations include: Mr = 2555 × CBR^0.64 (Transportation Research Record), and Mr = 3500 × ln(CBR) + 3000 for granular materials. For R-value, the correlation is Mr = 1000 + 555 × R-value. The MEPDG provides Level 2 and Level 3 inputs using CBR, R-value, and soil classification defaults. However, these correlations have wide confidence intervals (±50-100%) and should be used only for preliminary design or low-volume roads. Level 1 design requires direct Mr testing per AASHTO T307.
Resilient Modulus in existing pavements is determined through Falling Weight Deflectometer (FWD) or Heavy Weight Deflectometer (HWD) testing followed by back-calculation. The FWD applies an impulse load (typically 40 kN for highways, up to 320 kN for airfields) and measures surface deflections at 7-9 sensor positions forming a deflection basin. Back-calculation software (ELMOD, EVERCALC, MODCOMP) uses layered elastic theory to iteratively determine layer moduli that produce the measured deflection basin. The subgrade resilient modulus is estimated from far-field deflections where the stress bulb is confined to the subgrade. The 1993 AASHTO Guide provides: MR = 0.00743 × (P/D3) where P is load and D3 is deflection at 3 feet from load center. Seasonal testing (spring, summer, fall) captures moisture and freeze-thaw effects on in-situ Mr.
Typical Mr values vary by material type and stress state. Subgrade soils: A-1-a (well-graded gravel) Mr = 30,000-45,000 psi (207-310 MPa); A-2-4 (silty gravel) Mr = 25,000-40,000 psi (172-276 MPa); A-3 (fine sand) Mr = 20,000-35,000 psi (138-241 MPa); A-4 (silty soil) Mr = 8,000-18,000 psi (55-124 MPa); A-6 (lean clay) Mr = 5,000-12,000 psi (34-83 MPa); A-7-6 (fat clay) Mr = 3,000-8,000 psi (21-55 MPa). Granular base materials: well-graded crushed aggregate Mr = 25,000-55,000 psi (172-379 MPa); cement-treated base Mr = 600,000-1,000,000 psi (4,100-6,900 MPa); asphalt-treated base Mr = 200,000-500,000 psi (1,380-3,450 MPa). These values depend on density, moisture content, and degree of saturation, with saturated materials showing 40-60% lower Mr than at optimum moisture content.
Resilient Modulus (Mr) and Elastic Modulus (E) both represent stress-to-strain ratios, but they differ fundamentally. Mr is measured under dynamic cyclic loading with a haversine pulse (0.1 seconds) and a rest period (0.9 seconds), simulating moving traffic loads, and only the recoverable (resilient) strain is used — the permanent (plastic) strain is excluded. Elastic Modulus (Young's Modulus, E) is measured under static or monotonic loading to failure, incorporating both elastic and plastic components. For linear elastic materials, Mr and E are identical. For pavement geomaterials, Mr is typically 2 to 5 times higher than the static elastic modulus because the rapid loading allows less time for visco-plastic deformation, and the cyclic preconditioning stabilizes the specimen. Poisson's ratio (ν) for unbound materials ranges from 0.30 (granular, dense) to 0.45 (subgrade, saturated).
Improve Your Pavement Structural Evaluation
Accurate resilient modulus data is the foundation of sound pavement design and structural evaluation. Our drone-based pavement inspection and testing services complement traditional FWD and laboratory testing approaches. Contact us to learn how integrated assessment methods can optimize your pavement management program.
California Bearing Ratio (CBR) for Pavement Foundation Design
The California Bearing Ratio (CBR) is a penetration test that measures the strength of subgrade soil, subbase, and base materials relative to a standard crushed...
Fatigue testing evaluates a material's resistance to repeated loading, measuring the number of cycles to failure at various stress/strain levels. For asphalt, t...
The Structural Number (SN) is an abstract index value expressing the structural capacity of a flexible pavement required to carry a given traffic loading, compu...
25 min read
Pavement Design
AASHTO
+2
Cookie Consent We use cookies to enhance your browsing experience and analyze our traffic. See our privacy policy.