Friction Testing
Friction testing is a critical airport maintenance process that measures the interaction between aircraft tires and runway pavement surfaces. This ensures safe ...
6 min read
Airport Maintenance
Runway Safety
+2
Runway friction testing measures the frictional characteristics of runway pavement surfaces using Continuous Friction Measuring Equipment (CFME) at specified speeds and water depths. ICAO mandates regular friction surveys for runways; results are reported as Mu values. Covers CFME types, test procedures, ICAO friction categories, relationship to runway surface condition, and complementarity with visual inspection for texture assessment.
Runway friction testing is the systematic process of measuring the coefficient of friction — denoted by the Greek letter Mu (μ) — between a standard test tire and the runway pavement surface under controlled wet conditions. The testing is performed using Continuous Friction Measuring Equipment (CFME), which are specialized devices that produce a continuous record of friction values along the full length and width of the runway pavement. The results are expressed as dimensionless friction coefficient values on a scale from 0.00 to 1.00, where higher values indicate greater skid resistance.
The fundamental purpose of runway friction testing is safety assurance. Aircraft braking performance and directional control during landing and rejected takeoff are directly dependent on the friction characteristics of the runway pavement surface. When a runway is wet, the presence of water between the tire and the pavement creates a potential for hydroplaning — a condition where the tire rides on a film of water rather than making direct contact with the pavement surface. The coefficient of friction can drop by 50% or more on wet versus dry pavement, and the risk increases dramatically with water depth, reduced texture, and higher aircraft speeds.
ICAO Annex 14 — Aerodromes, Volume I, Chapter 10, establishes mandatory requirements for the measurement and maintenance of runway friction characteristics. Section 10.2.3 states that the surface of a paved runway shall be maintained in a condition that provides good surface friction characteristics and low rolling resistance for aircraft. To comply, aerodrome operators must conduct periodic friction measurements using approved CFME, maintain records of those measurements, and take corrective maintenance action when friction levels fall below established thresholds.
The International Civil Aviation Organization has been studying runway friction issues since the 1950s, with dedicated study groups established in 1965 (Snow, Slush, Ice and Water on Aerodromes), 1974 (Braking Action), and 1979 (Runway Surface Conditions). In 2008, the ICAO Friction Task Force was formally convened to develop updated SARPs and guidance materials on runway surface condition assessment, measurement, and reporting, culminating in ICAO Circular 329 (Cir 329 AN/191) — Runway Surface Condition Assessment, Measurement and Reporting, which provides the most comprehensive treatment of friction issues in aviation.
Runway friction testing serves multiple distinct functions within an airport maintenance programme. First, it provides trend analysis data over time to detect gradual friction deterioration due to aggregate polishing, rubber accumulation, surface wear, and environmental aging. Second, it identifies localized friction deficits such as those caused by rubber deposits in touchdown zones or fuel/oil spill contamination. Third, it validates the effectiveness of corrective maintenance actions such as rubber removal, retexturing, grooving, or resurfacing. Fourth, it supports compliance verification with national aviation authority requirements for friction levels.
An important distinction must be understood: runway friction testing is not a direct measure of aircraft braking performance. ICAO has consistently determined that no reliable, consistent correlation exists between CFME Mu values and actual aircraft stopping distances on wet runways. The friction measuring device provides a system response that depends on the device’s specific tire, slip ratio, water depth, speed, and measuring principle — none of which replicate the complex dynamics of an aircraft landing with multiple wheels, anti-skid braking systems, and varying tire loads. Therefore, CFME friction measurements are used for maintenance management purposes — detecting deterioration, scheduling corrective work, and verifying restoration — not for operational dissemination as braking action reports.
ICAO recognizes five primary types of Continuous Friction Measuring Equipment for regulatory compliance purposes, each operating on different measurement principles. All CFME must comply with the basic technical specifications outlined in ICAO Doc 9137 — Airport Services Manual, Part 2, Chapter 5, and Appendix 1.
Regardless of the specific device type, ICAO requires all CFME to meet the following minimum technical specifications:
| Parameter | Specification |
|---|---|
| Friction coefficient range | 0 to at least 1.0 |
| Confidence level | 95.5% within ±6 μ (two standard deviations) |
| Speed range | 40 to at least 130 km/h |
| Water depth capability | Self-wetting to at least 1 mm controlled depth |
| Averaging increments | First 100 m, each 150 m increment, each one-third segment |
| Record type | Permanent continuous graphic trace with date/time stamps |
| Tire for side-force (yaw) devices | Smooth tread, 4.00-8 (16x4.0, 6 ply RL2), inflation pressure 70 kPa |
| Tire for fixed-slip devices | Smooth tread, 4.00-8 (16x4.0, 6 ply RL2), inflation pressure 120-210 kPa |
| GripTester tire | Smooth tread, 10x4.5-5, inflation pressure 140 kPa |
The Mu-Meter is a side-force (yaw) friction measuring device pioneered by the UK Transport Research Laboratory. It operates on a fundamentally different principle from braking-slip devices. The Mu-Meter is a three-wheeled trailer with two measuring wheels mounted on stub axles angled outward from the direction of travel at 7.5 degrees (the yaw angle). As the trailer is towed along the runway, these angled wheels generate a side force proportional to the friction between the tire and the pavement surface.
The side-force measurement principle simulates the cornering forces experienced by aircraft tires during directional control maneuvers on wet runways. The measuring wheels use smooth tread tires inflated to 70 kPa — significantly lower than braking-slip devices. The Mu-Meter reports friction values as Mu values that are proportional to the ratio of the measured side force to the vertical wheel loading.
The Mu-Meter is towed at speeds up to 130 km/h by a suitable vehicle equipped with a self-wetting system that delivers a uniform water film of 1 mm in front of both measuring wheels. The standard unit provides continuous data output with averaging for every 150-meter segment of the runway. The Mu-Meter configuration includes a keyboard option that allows the operator to record observations, commands, and notes during the friction survey.
The Skiddometer BV11, manufactured by Moventor (Finland), is a fixed-slip braking friction measuring device with over 50 years of operational history. First launched in 1968, the Skiddometer has become one of the most widely used CFME types in the world and is recognized by both ICAO and the FAA. It is the device against which newer CFME types are typically comparison-tested for certification purposes.
The Skiddometer BV11 operates as a two-wheeled trailer towed behind any suitable vehicle. The measuring principle uses a 17% slip ratio — the measuring wheel is braked to rotate at 17% slower than the free-rolling speed, while the actual friction force at the tire-pavement interface is continuously measured. The friction value is computed as the ratio of the longitudinal friction force to the vertical wheel load.
The Skiddometer uses a smooth tread tire of size 4.00-8 (16x4.0, 6 ply RL2) inflated to 120 kPa. The device is capable of testing speeds from 40 to 130 km/h. It features a self-wetting system that can maintain a consistent 1 mm water depth in front of the measuring tire. The self-wetting system is available in two configurations: Water OnBoard (pump mounted on the Skiddometer trailer, water tank in the towing vehicle) and WMS Water Measurement System (separate water trailer providing up to 15 km of continuous testing per fill).
The Skiddometer BV11 features a unique design with measuring and reference wheels mounted in line rather than side-by-side. The reference wheel’s rotational power is mechanically redirected to the measuring wheel, providing reduced drag and improved stability. The system includes automatic self-zero adjustment and one-button calibration verification. The electronics package provides cloud-based analysis tools for trend monitoring.
The GripTester (manufactured by Findlay Irvine/Argon-X) is a fixed-slip friction measuring device operating at a slip ratio between 15% and 17%. It differs from other CFME types in several key specifications. The GripTester uses a smaller smooth tread tire of size 10x4.5-5 inflated to 140 kPa, making it unique among the recognized CFME types.
The GripTester is a compact trailer unit that can be towed by a standard airport vehicle. The measuring tire is braked at the fixed slip ratio while the friction force is measured continuously. The device includes an integrated self-wetting system that delivers a controlled water film ahead of the test tire. Testing speeds range from 40 to 130 km/h.
The GripTester is widely used in both airport and highway applications. Its compact size and lower weight make it particularly suitable for airports where equipment handling and storage are constrained. The GripTester provides continuous friction data recorded at intervals that can be configured for 150 m or other segment lengths.
The Runway Friction Tester (RFT) is a fifth-wheel friction measuring device mounted directly on a vehicle rather than configured as a towed trailer. The measuring wheel is deployed from the vehicle body and uses a fixed-slip braking principle. The RFT uses a smooth tread tire of size 4.00-8 inflated to 120 kPa.
The Surface Friction Tester (SFT) is functionally similar to the RFT, also employing a fifth-wheel configuration with fixed-slip braking and the same tire specifications (4.00-8, 120 kPa). Both devices can be integrated into a dedicated friction testing vehicle or installed as a removable system.
Both the RFT and SFT provide the standard output parameters: continuous friction trace, 150 m segment averages, and one-third segment averages. They are equipped with self-wetting systems calibrated for 1 mm water depth at all test speeds. An optional keyboard system allows the operator to annotate the friction record with observations and notes during the survey.
Because different CFME types use different measurement principles, tire sizes, tire pressures, and slip ratios, the raw Mu values produced by each device are not directly comparable. A Mu value of 0.50 measured by a Mu-Meter is not equivalent to 0.50 measured by a GripTester or Skiddometer. ICAO, FAA, and other authorities have developed correlation tables and conversion equations that allow friction values from different CFME types to be compared on a common basis.
| CFME Type | Measurement Principle | Tire Pressure | Tire Size | Typical MFL (65 km/h) |
|---|---|---|---|---|
| Mu-Meter | Side force (7.5° yaw) | 70 kPa | 4.00-8 | 0.38 |
| Skiddometer BV11 | Fixed slip (17%) | 120 kPa | 4.00-8 | 0.42 |
| GripTester | Fixed slip (15-17%) | 140 kPa | 10x4.5-5 | 0.40 |
| Runway Friction Tester | Fixed slip | 120 kPa | 4.00-8 | 0.42 |
| Surface Friction Tester | Fixed slip | 120 kPa | 4.00-8 | 0.42 |
The aerodrome operator must ensure that friction measurements are consistently obtained using the same CFME calibrated to the same specifications, or that proper correlation procedures are applied when switching between different CFME types.
Runway friction testing must be conducted according to standardized procedures that ensure repeatability, reproducibility, and comparability of results over time. ICAO Doc 9137 Part 2 provides detailed procedural requirements.
Before each friction survey, the CFME must be verified for proper operation and calibration. The equipment must have been serviced and maintained according to the manufacturer’s requirements and be in full working order. The friction measuring system and all components must have been calibrated within the manufacturer’s specified tolerances. For self-wetting systems, the water flow rate must be verified to produce the correct water depth of 1 mm consistently and evenly across the speed range.
A recommended procedure is to check the CFME on a defined test strip of pavement not used for aircraft operations before and after each friction survey. Comparison of the test strip readings with previous results provides an immediate verification of consistent CFME performance. Any significant deviation from established baseline values should trigger recalibration and investigation.
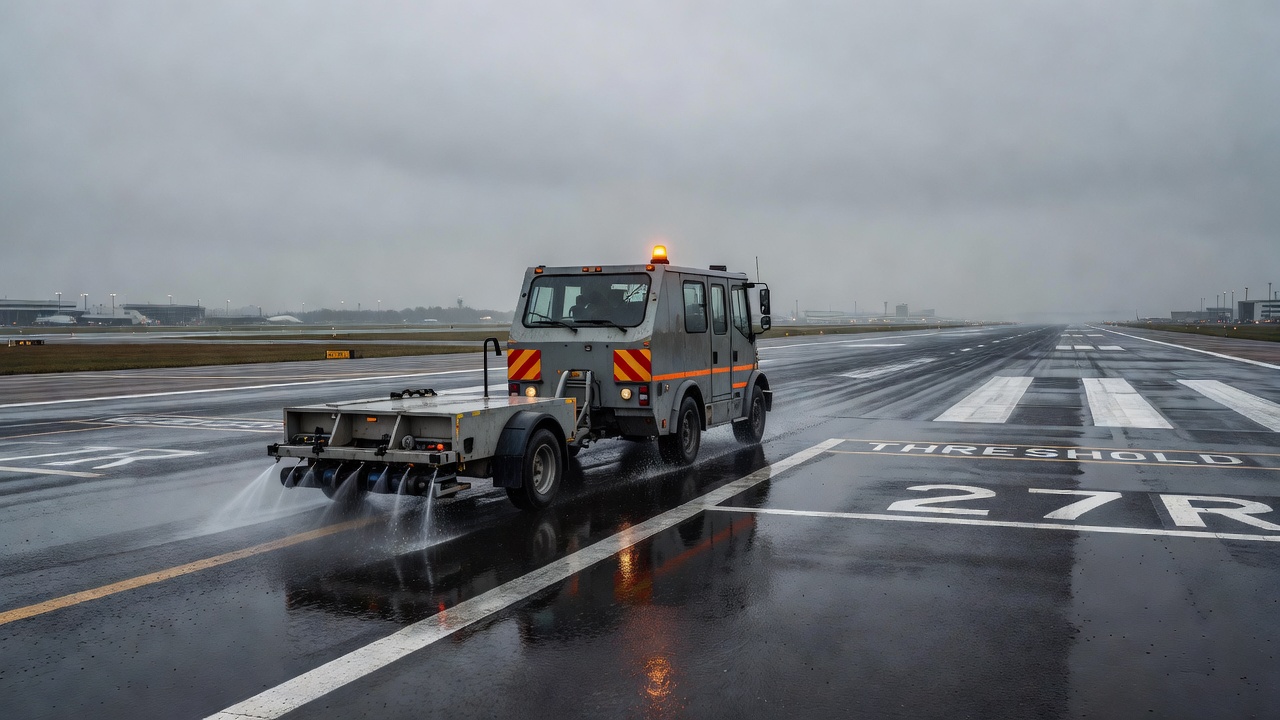
The water delivery system must be tested and calibrated. The water pump must deliver sufficient flow to maintain the specified 1 mm water depth at the maximum test speed. The flow rate required depends on the test width (wetted width in front of the measuring tire) and the vehicle speed. For a typical 25 mm wetted width at 95 km/h, the required flow rate is approximately 0.66 liters per minute per millimeter of width. The nozzle system must distribute the water uniformly across the full width of the test tire contact patch.
Friction testing is conducted at specified speeds that reflect the operational speeds of aircraft using the runway. ICAO requires testing at speeds of 40 to 130 km/h. The standard test speed for maintenance planning purposes is 95 km/h (approximately 51 knots) for runways serving jet aircraft. Testing at 65 km/h (approximately 35 knots) may also be conducted for correlation with legacy data or for runways serving primarily turboprop traffic.
The test speed directly affects the measured friction value. For most CFME types, friction values decrease with increasing speed on wet pavement — a phenomenon known as the speed gradient. A surface that produces a Mu value of 0.60 at 65 km/h may produce only 0.40 at 130 km/h. This speed dependency is a critical consideration when evaluating friction data for safety purposes. Aircraft touch down at speeds significantly higher than 95 km/h — large transport category aircraft may touch down at 120-160 knots (222-296 km/h) — meaning the friction at operational speeds is lower than the friction measured at standard test speeds.
The speed gradient is steeper on surfaces with inadequate macrotexture, because the water cannot drain from beneath the tire contact patch quickly enough at higher speeds. The relationship between texture, speed, and friction is the fundamental reason why macrotexture requirements exist alongside friction requirements.
All friction testing for maintenance purposes is conducted with a controlled water depth of 1 mm applied immediately in front of the friction measuring tire. This simulates wet runway conditions and produces the most meaningful friction values for determining whether corrective maintenance actions are required.
The 1 mm water depth is maintained by precise control of the water flow rate as a function of vehicle speed. The CFME’s electronic control system automatically adjusts the pump output to maintain the target water depth regardless of acceleration, deceleration, or constant-speed operation. The self-wetting system typically draws water from a tank of 1,000 liters or more, providing approximately 15 km of uninterrupted testing at 1 mm depth.
Testing may also be conducted on naturally wet runways during or immediately after rainfall when standing water conditions meet the 1 mm depth requirement. However, natural wetting introduces variability in water depth due to rainfall intensity variations, drainage patterns, and wind effects. Self-wetting is strongly preferred for consistent, repeatable results.
Friction testing must cover the full operational length of the runway in defined lanes. ICAO requires friction measurements to be taken along three longitudinal lines on the runway: the center of the runway (centerline), the left wheel track (approximately 3 meters from the centerline), and the right wheel track (approximately 3 meters from the centerline on the opposite side). For runways where aircraft typically operate in a specific direction, the wheel track lanes should correspond to the main landing gear paths of the predominant aircraft types.
Each lane must be tested in both directions to identify any directional variation in friction characteristics. The friction values for each 150-meter segment of each lane are reported separately. The one-third segment averages (touchdown zone, mid-section, and rollout/stopway section for each runway end) are also calculated and reported.
The friction testing vehicle must coordinate with Air Traffic Control to schedule the survey during periods of minimal traffic impact. The CFME operator must maintain two-way radio communications with ATC at all times and be prepared to immediately vacate the runway if required.
Each friction test produces a permanent record that includes: the continuous graphic trace of friction values along the runway length, the average friction value for the first 100 meters of each lane, average values for each 150-meter segment, average values for each one-third segment, the date and time of the test, the CFME type and configuration used, the test speed, water depth, tire pressure, ambient temperature, pavement temperature, and any observations or annotations made by the operator during the survey. These records must be retained for the duration specified by the national aviation authority, typically a minimum of five years.

ICAO defines three distinct friction level thresholds that establish the framework for runway friction management within a pavement maintenance programme. These thresholds are the Design Objective Level (DOL), the Maintenance Planning Level (MPL), and the Minimum Friction Level (MFL).
The Design Objective Level is the friction value to be achieved or exceeded on a new or resurfaced runway pavement before it is opened for service. The DOL represents the friction performance target for newly constructed surfaces and provides the initial baseline from which friction deterioration will be measured over time. New pavements must demonstrate friction values at or above the DOL through acceptance testing before the runway is released for operational use.
The DOL values for different CFME types vary. A typical DOL for the Mu-Meter at 65 km/h is 0.52, while for the Skiddometer at 95 km/h the DOL is approximately 0.60. The specific DOL for a given airport should be established by the national aviation authority based on the CFME type, test speed, and local conditions.
The Maintenance Planning Level is the friction value below which the aerodrome operator should initiate planning for corrective maintenance action. When friction measurements show values consistently at or below the MPL, the operator should begin scheduling rubber removal, retexturing, or other restorative work. The objective of setting the MPL above the MFL is to allow sufficient time for maintenance planning and execution before friction deteriorates to the minimum acceptable level.
The MPL provides a safety buffer between the planning threshold and the minimum acceptable level. Once friction reaches the MPL, the operator should have a maintenance plan in place and resources allocated to restore friction before the MFL is reached. The typical MPL for the Mu-Meter at 65 km/h is 0.44, compared to the MFL of 0.38.
The Minimum Friction Level is the friction value below which corrective maintenance action must be taken and below which the runway may be considered potentially slippery when wet. If friction measurements at any point along the runway fall below the MFL, the aerodrome operator must take immediate corrective action and notify the aeronautical information services through NOTAM that the runway may be slippery when wet.
The MFL represents the minimum acceptable friction for safe aircraft operations under wet conditions. A runway with friction below the MFL on a significant portion of its surface should be considered for operational restrictions or closure until corrective action can restore friction to acceptable levels.
In addition to the three quantitative thresholds, ICAO historically used five qualitative friction categories for reporting purposes. While these are being phased out in favor of the Global Reporting Format (GRF) and RCAM system, they remain relevant for maintenance management:
| Friction Category | Description | Relationship to Threshold |
|---|---|---|
| Good | Above MPL | Friction values are acceptable, no immediate action required |
| Medium/Good | At or near MPL | Trend should be monitored |
| Medium | Between MPL and MFL | Maintenance planning should be initiated |
| Medium/Poor | At or near MFL | Corrective action should be planned urgently |
| Poor | Below MFL | Immediate corrective action required |
The newer RCAM-based reporting under the ICAO Global Reporting Format uses Runway Condition Codes (RWYCC) from 0 to 6 instead of these friction-based categories. However, for maintenance management purposes — which is the primary application of CFME friction testing — the three-threshold system (DOL, MPL, MFL) remains in widespread use.
ICAO Annex 14, Volume I, Chapter 10, Section 10.2 — Pavements, establishes the regulatory framework for runway friction measurement. The requirements apply to all hard-surfaced runways serving turbojet aircraft, with recommended application to runways serving heavy turboprop aircraft (maximum certified takeoff weight of 15,000 kg or greater).
The frequency of friction testing is determined by the annual volume of aircraft movements on the runway. ICAO provides recommended minimum frequencies:
| Average Turbojet Movements Per Day | Minimum Friction Testing Frequency | Rubber Removal Frequency |
|---|---|---|
| Less than 15 | Annually | Every 2 years |
| 16 to 30 | Every 6 months | Annually |
| 31 to 90 | Every 3 months | Every 6 months |
| 91 to 150 | Monthly | Every 4 months |
| 151 to 210 | Every 2 weeks | Every 3 months |
| Greater than 210 | Weekly | Every 2 months |
For turboprop operations with MCTOW of 15,000 kg or greater: less than 15 operations per day — testing every 5 years; 16 to 30 operations per day — testing every 3 years; 31 to 90 operations per day — testing annually. For runways serving turboprops below this weight, testing at least once every 3 years is recommended.
The aerodrome operator may adjust the testing frequency based on historical trend data. If friction deterioration is occurring faster than expected, the frequency should be increased. If friction levels remain stable well above the MPL, the operator may consider extending the interval provided adequate justification is documented.
Friction testing must be conducted after any significant maintenance activity on the runway surface, even if the activity was not intended to affect friction characteristics. This includes rubber removal, grooving, retexturing, crack sealing, asphalt patching, overlay, surface dressing, and chemical spill remediation. Testing should be conducted before the runway is returned to service whenever possible, or as soon as practicable thereafter.
If the post-maintenance friction testing reveals values below acceptable levels, additional testing should be performed over time to determine whether friction values improve (as new surfaces sometimes require a break-in period), remain stable, or require additional corrective work.
When pilots report poor braking action on a runway that is dry or damp (not contaminated), friction testing should be conducted to verify the condition. Pilot reports of braking action — classified as GOOD, GOOD-TO-MEDIUM, MEDIUM, MEDIUM-TO-POOR, POOR, or NIL — provide an operational indication of braking performance that may identify surface friction deficiencies not apparent from visual inspection. Persistent poor braking action reports warrant immediate friction testing even if the runway appears visually acceptable.
New runway surfaces and rehabilitated surfaces (overlays, grooving, PFC application) must undergo acceptance friction testing before being opened for operational use. The surface must meet or exceed the Design Objective Level (DOL) through testing conducted under controlled wet conditions at the appropriate speed. Testing should be performed on a clean surface (free of curing compounds, dust, or construction debris) after any required curing period.
For grooved runways, acceptance friction testing verifies that both the groove geometry (depth, width, spacing) and the surface friction between grooves meet specification requirements. For Porous Friction Course (PFC) surfaces, testing verifies that the friction values meet DOL and that the permeability characteristics are adequate for water drainage through the pavement structure.
The Runway Condition Assessment Matrix (RCAM) is a standardized classification tool developed by ICAO as part of the Global Reporting Format (GRF) that took effect internationally in November 2021. The RCAM establishes a direct relationship between observed runway surface conditions — including contaminant type and depth — and the expected braking performance of an aircraft.
The RCAM assigns a Runway Condition Code (RWYCC) from 0 to 6 to each segment of the runway based on the surface condition assessment:
| RWYCC | Runway Surface Description | Expected Braking Action |
|---|---|---|
| 6 | Dry | N/A — braking deceleration normal |
| 5 | Damp, Wet (up to 3 mm), Frost | Good |
| 4 | Compacted Snow at -15°C or colder | Good to Medium |
| 3 | Slippery Wet (ICAO), Snow over Compacted Snow, Dry/Wet Snow >3 mm, Compacted Snow warmer than -15°C | Medium |
| 2 | Water >3 mm, Slush >3 mm | Medium to Poor |
| 1 | Ice | Poor |
| 0 | Wet Ice, Water over Compacted Snow, Snow over Ice | Less than Poor / Nil |
The RCAM applies to contaminated and wet runway conditions for operational reporting purposes. It does not replace CFME friction testing, which remains the tool for maintenance management on dry and wet runways. However, for operational dissemination of runway condition information, the RCAM has replaced the practice of reporting Mu values directly to flight crews.
ICAO has determined that no consistent correlation exists between CFME Mu values and aircraft braking action on contaminated surfaces. The RCAM is designed to provide flight crews with a better indication of expected braking performance based on contaminant type, depth, and temperature rather than on friction measurement values.
Runway friction is fundamentally controlled by the surface texture of the pavement at two distinct scales: microtexture and macrotexture. Both scales must be adequate for the runway to provide acceptable friction performance under wet conditions.
Microtexture refers to the sub-millimeter surface roughness of individual aggregate particles exposed on the pavement surface. This fine-scale texture is determined by the mineralogical composition of the aggregates used in the pavement surface course. Microtexture provides the molecular-level adhesion between the tire rubber and the pavement surface — the mechanism that generates friction on both dry and wet surfaces.
Microtexture is measured in the laboratory through the Polished Stone Value (PSV) test (EN 1097-8, BS 812, ASTM D3319). Aggregates with higher PSV — typically those with hard, angular mineral components such as quartz, feldspar, and other silicate minerals — retain their microtexture longer under the polishing action of traffic. Limestone aggregates, by contrast, have low PSV and can become polished smooth within months of exposure to traffic.
When aircraft tires repeatedly pass over the same surface, the aggregate particles undergo polishing — the microtexture is worn down by the mechanical action of rubber sliding over the stone surface. This polishing is most severe in the touchdown zones where aircraft first contact the runway with tires not yet spinning up to speed, generating significant sliding friction and heat. The result is a progressive reduction in microtexture and a corresponding reduction in friction, particularly on wet surfaces.
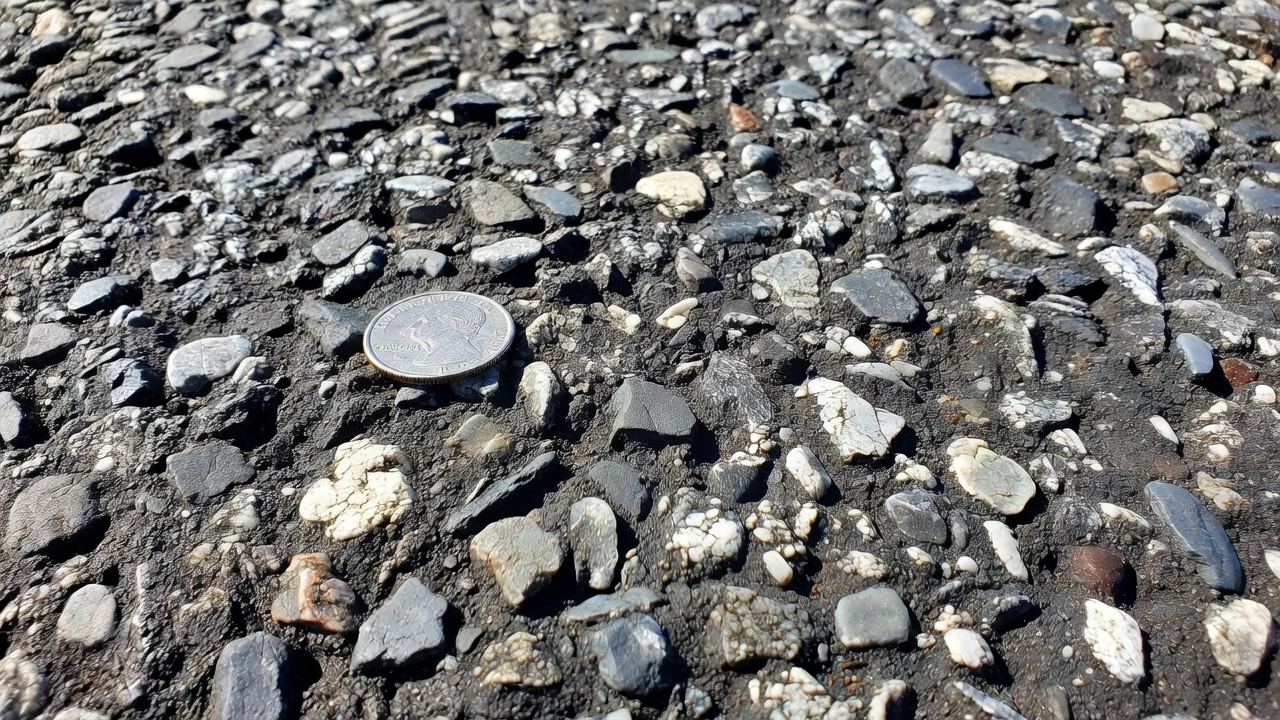
Macrotexture refers to the larger-scale surface irregularities with wavelengths from 0.5 mm to 50 mm. Macrotexture is the surface characteristic that provides drainage pathways for water to escape from beneath the tire contact patch during wet operations. Without adequate macrotexture, a film of water remains trapped between the tire and the pavement, leading to hydroplaning — the complete loss of tire-pavement contact.
Macrotexture is measured by several methods. The volumetric patch test (sand patch method) (ASTM E965, EN 13036-1) measures Mean Texture Depth (MTD) by spreading a known volume of sand or glass beads over the surface and measuring the area covered. The laser profilometer measures Mean Profile Depth (MPD) by scanning the surface with a laser to create a two-dimensional profile of the texture. The outflow meter measures the time required for water to drain from a sealed cylinder placed on the pavement surface.
ICAO recommends a minimum MTD of 1.0 mm for new runways and 0.8 mm for existing runways. When MTD falls below 0.4 mm, the runway is at significantly increased risk of hydroplaning during wet conditions. Below 0.25 mm, the surface is considered polished and corrective action is required. The relationship between macrotexture and friction is nonlinear — small increases in texture depth at the low end of the range produce disproportionately large improvements in wet friction.
Transverse grooving is specifically designed to provide macrotexture on runway pavements. Grooves are cut into the hardened pavement surface at regular intervals perpendicular to the direction of travel. Typical groove dimensions are 4 to 6 mm depth, 4 to 8 mm width, and 25 to 38 mm center-to-center spacing. Grooving provides drainage channels that allow water to escape laterally from beneath the tire footprint.
FAA Advisory Circular AC 150/5320-12C provides standards for runway grooving. On asphalt pavements, grooves are cut by a concrete saw with multiple diamond blades mounted on a single arbor. On concrete pavements, grooves are either cut into the hardened surface (retrofit grooving) or formed in the plastic concrete during construction (timed grooving). Grooving has been shown to reduce wet runway accidents by up to 80% in some studies.
Porous Friction Course (PFC) is an asphalt surface course designed with open-graded aggregate gradation that creates interconnected air voids (typically 15-22% air void content) throughout the pavement layer thickness. Water on the runway surface drains vertically through the PFC layer and then laterally within the layer to the pavement edge or underlying impermeable layer.
PFC provides superior friction performance on wet runways because water is removed from the tire-pavement interface almost instantly — there is no need for water to escape laterally through macrotexture grooves. This makes PFC surfaces particularly effective for runways in high-rainfall areas. The PFC layer is typically 25 to 50 mm thick, placed over an underlying dense-graded asphalt layer with a polymer-modified binder to improve durability.
PFC surfaces have some limitations. The open pore structure can become clogged with rubber deposits and debris over time, requiring periodic cleaning through high-pressure water flushing. PFC may have a shorter service life than dense-graded surfaces due to oxidation of the thin binder films coating the aggregate particles. In cold climates, PFC may experience freeze-thaw damage if the pores become saturated with water that subsequently freezes.

Rubber accumulation on runway pavements is the single most common cause of friction deterioration on airport runways. Every aircraft landing deposits a thin layer of rubber from the tires onto the pavement surface, primarily in the touchdown zone — the area extending approximately 300 to 500 meters from the runway threshold where the majority of landings occur. Over thousands of operations, this rubber builds up into a dense, compacted layer that fills the macrotexture valleys and covers the aggregate microtexture, dramatically reducing the surface’s ability to provide friction under wet conditions.
When an aircraft touches down, its main tires are not rotating at the speed required for the aircraft’s ground speed — they are spun up to the appropriate rotational speed by the friction between the tire and runway surface during the first few rotations. This spin-up process generates significant heat and deposits a layer of vaporized and partially melted rubber on the pavement surface. Successive landings compress and build this layer, creating a dense, dark film that can reach thicknesses of 0.5 to 3 mm in heavily used touchdown zones.
The physical mechanism by which rubber reduces friction involves both microtexture and macrotexture effects. The rubber film covers the sharp microtexture of aggregate particles, preventing tire rubber from making direct contact with the stone surface and reducing the adhesive component of friction. Simultaneously, the rubber fills the macrotexture valleys, reducing the pavement’s ability to drain water from beneath the tire contact patch and increasing hydroplaning risk. A runway with significant rubber accumulation may show friction reductions of 30-50% compared to a clean surface of the same pavement type.
The most widely used and effective method for rubber removal is ultra-high pressure water blasting (UHPW). This process uses water pressures of 8,000 to 14,500 psi (550 to 1,000 bar) delivered through specialized nozzles mounted on a vehicle that traverses the runway at controlled speed. The water jet is directed at the pavement surface at an angle optimized to shear the rubber layer off the pavement without damaging the underlying aggregate or binder.
UHPW systems typically operate at flow rates of 20 to 30 gallons per minute per nozzle, with multiple nozzles arranged across the width of the cleaning vehicle. The cleaning rate is approximately 278 m² per hour per unit. For a typical runway touchdown zone of 500 meters by 30 meters (15,000 m²), a single unit would require approximately 54 hours of cleaning time. Multiple units operating in parallel can reduce the time proportionally.
Alternative rubber removal methods include:
Chemical removal using biodegradable solvents that soften and emulsify the rubber layer, which is then washed away with water. Chemical methods are slower than UHPW and raise environmental concerns about runoff into drainage systems. They are typically used only when UHPW is not available or for light rubber deposits.
Mechanical removal using abrasive blasting or shot-blasting equipment. These methods physically abrade the rubber layer from the pavement surface but also remove a thin layer of the pavement itself, potentially reducing the service life of the surface course. Mechanical removal is generally not recommended for critical runway surfaces.
High-pressure water with heated water — some systems heat the water to 80-90°C (176-194°F) to soften the rubber layer before high-pressure removal. The heated water improves removal efficiency for heavy, aged rubber deposits that have become hard and brittle over time.
After rubber removal, friction testing must be conducted to verify that friction values have been restored to acceptable levels. The post-removal friction values should be at or above the Maintenance Planning Level (MPL) for the CFME type and speed in use. If friction values remain below the MPL after rubber removal, additional cleaning passes or alternative restoration methods may be required.
The post-removal friction testing also serves to establish a new trend baseline for the cleaned surface. The friction values immediately after cleaning represent the maximum friction attainable from the pavement’s existing microtexture and macrotexture. If this maximum value is below the DOL, it indicates that the pavement itself has deteriorated beyond what rubber removal alone can restore, and surface retexturing or resurfacing may be required.
When rubber removal alone is insufficient to restore friction to acceptable levels, surface retexturing may be required. Retexturing methods include:
Shot-blasting — propelling steel shot at the pavement surface to remove a thin layer of binder and expose fresh aggregate. This process creates new microtexture on the exposed aggregate surfaces.
Diamond grinding — using diamond-tipped cutting heads to remove a thin layer of the pavement surface, creating a uniform texture with controlled macrotexture depth. This method is commonly used on concrete pavements.
Milling — using a rotating drum with carbide cutting teeth to remove the upper layer of the pavement and create a textured surface. Milling removes 10-25 mm of the surface course and is typically used when the surface is extensively polished or damaged.
Cape seal — application of a chip seal (aggregate embedded in an asphalt binder layer) covered by a slurry seal, providing both renewed microtexture and macrotexture.
A critical distinction exists between visual surface condition inspection and quantitative friction testing. These two assessment methods serve complementary but fundamentally different roles within airport pavement maintenance management.
Visual inspection — performed using systems such as TarmacView or through manual inspection by trained personnel — provides an assessment of surface condition that includes: identification and classification of surface distresses (cracking, raveling, rutting, bleeding, shoving), evaluation of rubber deposit extent and thickness, assessment of aggregate polishing (loss of microtexture), measurement of macrotexture depth, detection of fuel/oil spill contamination, identification of drainage deficiencies and standing water locations, and structural condition evaluation.
Friction testing — performed using CFME — provides: quantitative coefficient of friction (Mu) values along the entire runway length, segment-specific friction averages identifying localized deficits, speed-dependent friction characteristics (speed gradient), trends in friction deterioration over time, verification of rubber removal effectiveness, and certification of new surfaces meeting design objectives.
The coefficient of friction cannot be estimated from visual appearance. A pavement surface that appears rough and textured may have insufficient microtexture to provide adhesion when wet. Conversely, a surface that appears smooth may have excellent macrotexture that provides adequate wet friction. The relationship between visual appearance and actual friction performance is complex and nonlinear, influenced by factors that cannot be assessed visually: the mineralogical composition of aggregates (determining microtexture retention), the binder film thickness covering aggregate particles, the presence of invisible contaminants (microscopic rubber films, oil residues), and the actual drainage capacity of macrotexture at operational speeds.
ICAO specifications require both methods. Annex 14 Chapter 10 requires regular inspections for the purpose of identifying surface condition changes AND periodic friction measurements for quantitative assessment. The inspection programme must address both structural and functional pavement deterioration. Friction measurement addresses functional performance, while visual inspection addresses both structural and functional condition.
TarmacView provides a visual surface quality assessment that complements CFME friction testing. The TarmacView system captures high-resolution imagery of the runway pavement surface, processes the images using advanced computer vision and machine learning algorithms, and produces quantitative assessments of surface condition including: rubber deposit mapping showing the extent and severity of rubber accumulation across the entire runway surface, macrotexture assessment based on image texture analysis, aggregate polishing detection identifying areas where microtexture has been lost, surface distress classification and mapping, and deterioration trend analysis from repeat surveys.
The TarmacView system can identify areas where friction testing should be prioritized — for example, zones with heavy rubber accumulation, visible aggregate polishing, or standing water drainage issues. It also provides a means of monitoring the effectiveness of rubber removal and other corrective maintenance actions between friction testing cycles.
The recommended approach is a combined assessment programme: regular visual inspections (daily, weekly) using TarmacView for surface condition monitoring and trend analysis, periodic friction testing (monthly to annually based on traffic volume) for quantitative Mu value measurement, and targeted friction testing following visual identification of specific surface deterioration or after corrective maintenance actions.
Acceptance friction testing is a critical requirement for new runway construction and rehabilitation projects. The testing verifies that the completed surface meets the Design Objective Level (DOL) before the runway is released for aircraft operations.
Acceptance friction testing should be conducted after all construction work is complete and the pavement has achieved adequate cure time. For asphalt pavements, this typically means waiting at least 30 days after placement to allow the binder to fully cure and any surface oils or construction residues to be removed by traffic or cleaning. For concrete pavements, the cure time depends on the concrete mix design and ambient conditions but is typically 28 days minimum.
The surface must be thoroughly cleaned before acceptance testing. All construction debris, dust, curing compounds, and loose material must be removed. The testing should be conducted on a dry surface with the CFME self-wetting system providing the controlled 1 mm water depth. Testing may be conducted on a naturally wet surface if rainfall provides consistent water coverage across the entire runway, but self-wetting is preferred for consistency.
New runway surfaces must demonstrate friction values at or above the DOL across the full length and width of the pavement. The specific DOL is determined by the national aviation authority based on the CFME type and test speed. For example:
| CFME Type | Test Speed | Typical DOL | Typical MPL | Typical MFL |
|---|---|---|---|---|
| Mu-Meter | 65 km/h | 0.52 | 0.44 | 0.38 |
| Mu-Meter | 95 km/h | 0.46 | 0.38 | 0.32 |
| Skiddometer | 95 km/h | 0.60 | 0.50 | 0.42 |
| GripTester | 95 km/h | 0.55 | 0.45 | 0.40 |
If any 150-meter segment of the new runway fails to meet the DOL, the cause must be investigated. Possible causes include: inadequate compaction or binder content in asphalt pavements, insufficient grooving depth or improper groove spacing, aggregate polishing during construction traffic or early operations, contamination from construction materials or equipment, or the presence of surface moisture, curing compounds, or binder films.
For rehabilitated surfaces (overlays, grooving, PFC applications), the acceptance requirement is typically that friction values meet or exceed the DOL. However, for surfaces where the pavement structure is not being replaced — such as rubber removal followed by retexturing — the acceptance criterion is that friction values are restored above the MPL. The DOL may not be achievable on an aged pavement where the aggregate microtexture has been permanently lost through polishing, even after rubber removal and retexturing.
Runway friction testing is a mandatory safety-critical component of airport pavement maintenance programmes worldwide. The testing provides quantitative measurement of the coefficient of friction between a standard test tire and the runway pavement surface under controlled wet conditions, enabling aerodrome operators to detect deterioration, plan maintenance, verify restoration, and comply with ICAO Annex 14 requirements.
The key elements of a comprehensive runway friction management programme include: selection and maintenance of approved CFME appropriate for the airport’s operational requirements, establishment of testing frequencies based on aircraft movement volumes, consistent application of standardized test procedures (95 km/h, 1 mm water depth, three longitudinal lanes), monitoring of friction trends against established thresholds (DOL, MPL, MFL), correlation of friction data with visual surface condition assessments, scheduling and verification of rubber removal and retexturing, and documentation and retention of all friction test records.
The complementarity of visual inspection — such as that provided by TarmacView’s advanced imaging and analysis platform — with quantitative CFME friction testing provides the most complete approach to runway surface safety management, ensuring that both the observable condition and the functional friction performance of the runway are maintained at acceptable levels throughout the pavement service life. +++
Our team provides comprehensive runway friction testing and surface condition assessment services using certified CFME equipment. We help airports comply with ICAO Annex 14 friction testing requirements and develop maintenance planning strategies.
Friction testing is a critical airport maintenance process that measures the interaction between aircraft tires and runway pavement surfaces. This ensures safe ...
Skid resistance is the frictional force resisting tire sliding on a pavement surface, critical for safe braking and vehicle control — especially on wet runways....
Runway Condition Assessment uses the Global Reporting Format (GRF) and Runway Condition Assessment Matrix (RCAM) to evaluate and report runway surface condition...