Rutting is a permanent longitudinal depression in the wheel paths of asphalt pavements caused by densification, shear deformation, or subgrade failure under repeated traffic loading. In airport runways, rutting is especially critical due to heavy aircraft loads and can create water-ponding and hydroplaning hazards. Covers rutting mechanisms, TxDOT shallow/deep/severe scale, measurement methods, and AI-based visual detection from drone imagery.
Rutting in Asphalt and Flexible Pavements
Definition and Fundamental Mechanisms
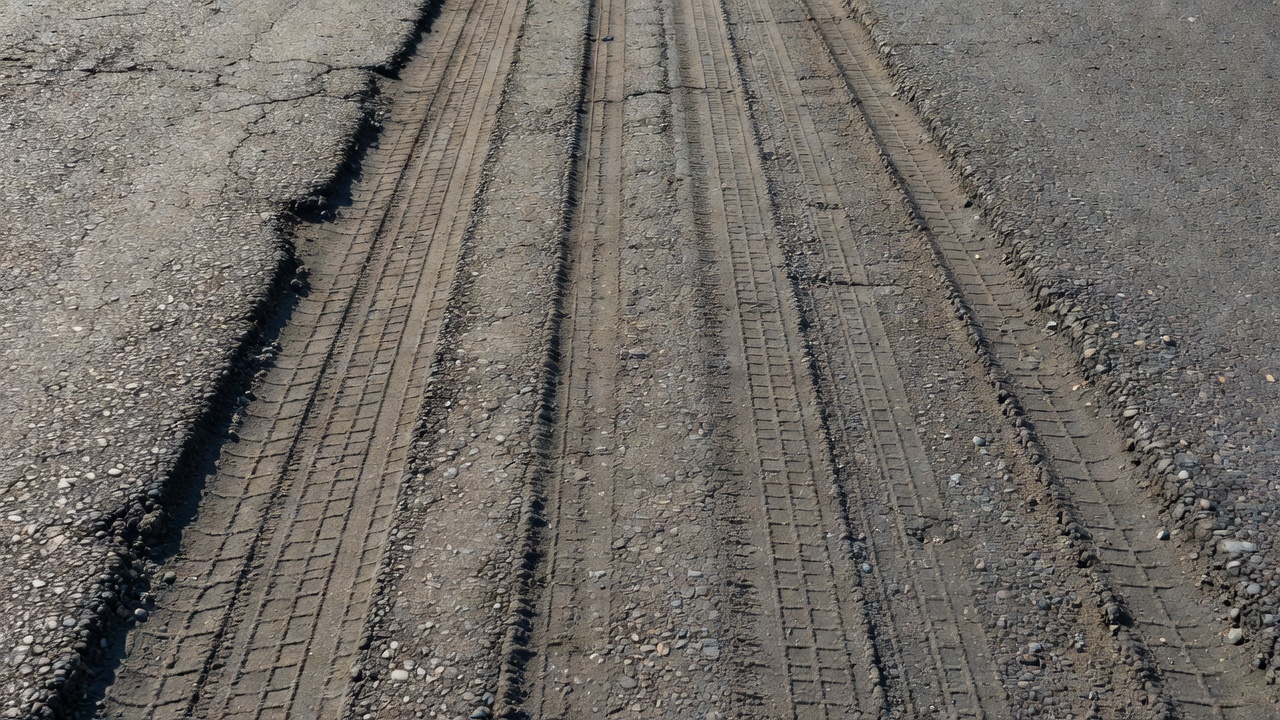
Rutting is a permanent, longitudinal surface depression that develops in the wheel paths of flexible asphalt pavements under repeated traffic loading. It is one of the most consequential load-associated distresses affecting both highway and airfield pavements worldwide. The distress manifests as channelized grooves running parallel to the direction of travel, typically accompanied — depending on the mechanism — by lateral upheaval or plastic deformation of the asphalt material along the edges of the depression. Ruts become particularly visible after rainfall events, when water fills the depressions and highlights their extent and severity against the surrounding pavement surface.
From a structural mechanics perspective, rutting represents the accumulation of irrecoverable (plastic) strain in one or more layers of the pavement system. Each wheel pass contributes an incrementally small permanent deformation — typically on the order of 10⁻⁶ to 10⁻⁸ strain per load cycle — that over hundreds of thousands or millions of load repetitions aggregates into a measurable surface depression. The Federal Highway Administration’s Long-Term Pavement Performance (LTPP) program has documented that rutting accumulation in flexible pavements follows a nonlinear rate: an initial rapid consolidation phase during the first year of service, followed by a steady-state creep phase, and eventually a tertiary phase where rut depth accelerates due to the combined effects of material degradation and increased stress concentrations in the deformed profile.
Densification Rutting
Densification rutting, also termed post-construction consolidation, occurs when the hot-mix asphalt surface course or underlying granular layers continue to compact under traffic loading beyond the density achieved during construction. This mechanism is predominant during the early service life of a pavement and is directly linked to inadequate compaction during the paving operation. When in-place air void content exceeds approximately 8% in dense-graded HMA mixtures, the material retains significant additional compaction potential. Each heavy vehicle pass reduces the air void volume marginally, and these micro-reductions accumulate into measurable surface depressions.
The volumetric relationship governing densification rutting is straightforward: a reduction in air void content of 1% within a 150 mm (6 in) thick asphalt layer translates into approximately 1.5 mm of surface rut depth if the compaction occurs uniformly. In practice, densification is rarely uniform — it concentrates in the wheel paths where contact stresses are highest, producing the characteristic longitudinal groove pattern. Laboratory studies conducted under the Strategic Highway Research Program (SHRP) demonstrated that HMA specimens compacted to 7% air voids can densify by an additional 1.5–2.5% air void reduction under 10,000 cycles of repeated loading at 40°C, generating rut depths of 3–5 mm in 100 mm thick samples. Densification rutting is distinguished from other types by the absence of lateral upheaval — the wearing course material simply moves downward rather than flowing sideways.
Shear-Flow Rutting (Mix Rutting)
Shear-flow rutting is the most severe and structurally dangerous form of pavement rutting. In this mechanism, the hot-mix asphalt material undergoes plastic flow — it is pushed downward under the tire contact patch and displaced laterally outward, creating the classic rut profile with a distinctive raised ridge or upheaval along both edges of the wheel-path depression. Unlike densification, shear-flow involves volume-conserving plastic deformation where the material displaced from beneath the tire migrates to adjacent areas without significant change in overall density.
The propensity for shear-flow rutting is governed primarily by the shear resistance of the HMA mixture, which depends on aggregate interlock (internal friction angle), binder stiffness (cohesion), and the effective confining stress within the pavement layer. When ambient pavement temperatures reach 50–65°C (122–149°F) — common in summer conditions in many regions — the asphalt binder viscosity decreases by orders of magnitude, reducing the mixture’s resistance to shear deformation. The Superpave mix design system directly addresses this mechanism through the use of performance-graded (PG) binders selected for the local climate; a PG 76-22 binder, for example, is designed to provide adequate shear resistance up to a 7-day maximum pavement temperature of 76°C. The Asphalt Mixture Performance Tester (AMPT) and the Hamburg wheel-tracking test are standard laboratory procedures for evaluating a mixture’s rutting susceptibility before field placement.
Mix rutting is confined to the asphalt-bound layers. A trench section cut through a shear-flow rut in the field typically reveals that the total thickness of HMA directly under the wheel path remains approximately equal to the original design thickness — the material has simply redistributed rather than lost volume. This has important implications for repair strategy: a thin overlay placed over shear-flow ruts without addressing the underlying unstable mix will often result in rapid recurrence of the distress, as the old unstable mix continues to deform under the new surface.
Subgrade Rutting (Structural Rutting)
Subgrade rutting represents the most fundamental structural failure mode of flexible pavements. In this mechanism, the wheel loads transmitted through the pavement layers exceed the bearing capacity of the underlying subgrade soil or unbound granular base, causing progressive permanent deformation in these foundation layers. The entire pavement structure then deflects downward to conform to the subgrade depression, producing surface ruts that typically lack the lateral upheaval characteristic of shear-flow rutting. Instead, the cross-section shows a broad, basin-shaped depression with cracking of the asphalt surface as it flexes to accommodate the subgrade deformation.
The mechanistic basis for subgrade rutting lies in the vertical compressive strain at the top of the subgrade (εᵥ). The Asphalt Institute and Shell pavement design methods both use limiting subgrade strain criteria to prevent this distress: for a design traffic loading of 10 million equivalent single axle loads (ESALs), the allowable vertical subgrade strain is typically limited to approximately 200 microstrain. When actual strains exceed this threshold — due to inadequate pavement thickness, weakened subgrade conditions from moisture infiltration, or traffic loading beyond design assumptions — permanent deformation accumulates in the subgrade with each load cycle. The Asphalt Institute’s model relates allowable load repetitions (N) to subgrade strain through the relationship N = 1.365 × 10⁻⁹ × (1/εᵥ)⁴·⁴⁷⁷, underscoring the exponential sensitivity of subgrade rutting life to even small increases in strain.
Investigation of subgrade rutting requires forensic trenching or coring through the full pavement depth. A telltale diagnostic feature is the presence of the rut profile in the subgrade surface when the overlying pavement layers are removed. Ground-penetrating radar (GPR) can also help identify subgrade rutting by detecting layer thickness variations and moisture anomalies. Repair of subgrade rutting is the most invasive category of rutting remediation, typically requiring full-depth reconstruction of the affected pavement section including subgrade stabilization with lime, cement, or geosynthetic reinforcement.
Causes and Contributing Factors
Rutting does not result from a single cause but from the interaction of multiple factors spanning materials, structural design, construction quality, traffic loading, and environmental conditions. Understanding these causal relationships is essential for both preventing rutting in new pavements and diagnosing the root cause in distressed pavements to inform appropriate rehabilitation strategies.
Heavy Traffic Loading and Tire Pressures
The single most dominant driver of rutting is the magnitude and repetition of wheel loads. Modern highway truck tire pressures typically range from 690 to 830 kPa (100–120 psi), while aircraft tire pressures are substantially higher at 1,240–1,520 kPa (180–220 psi) for commercial jet aircraft. These high contact pressures generate complex three-dimensional stress states within the pavement layers. Directly beneath the tire center, vertical compressive stresses can reach 700–900 kPa in the upper asphalt layer. Critically, significant shear stresses develop at the edges of the tire contact patch — finite element analyses routinely show maximum shear stresses of 200–400 kPa occurring at depths of 40–80 mm below the surface during warm conditions when the binder is softened. These shear stresses drive the lateral plastic flow mechanism of mix rutting.
The equivalency between different axle loads and rutting damage is captured by the fourth-power law: the relative damage caused by an axle load is approximately proportional to the fourth power of the load ratio. A 20,000 lb single axle causes roughly 16 times the rutting damage of a 10,000 lb single axle. This nonlinear relationship explains why overloaded trucks and heavy aircraft gear configurations disproportionately accelerate rutting. On airport pavements, the aircraft classification number (ACN) system quantifies this effect — a Boeing 777-300ER at maximum takeoff weight imposes an ACN of approximately 85–95 on a medium-strength subgrade (CBR 10), compared to an ACN of 25–35 for a Boeing 737-800, representing an order-of-magnitude difference in pavement loading intensity.
High Pavement Temperatures
Temperature exerts a first-order control on asphalt mixture stiffness and rutting susceptibility. Asphalt binder is a viscoelastic material whose complex shear modulus (G*) decreases by three to four orders of magnitude between winter temperatures of −10°C and summer pavement temperatures of 60°C. At the high end of this range, the binder contribution to mixture shear resistance becomes minimal, and the aggregate skeleton bears nearly all of the load. If the aggregate structure is inadequately interlocked or the binder content is excessive, rapid shear-flow rutting can occur during sustained hot weather.
The Superpave performance grading system addresses this temperature sensitivity by specifying the high-temperature PG grade based on the 7-day average maximum pavement temperature at 20 mm depth for the project location, calculated using the Long-Term Pavement Performance (LTPP) climatic models. For example, Phoenix, Arizona requires PG 70-10 or PG 76-16 binders, while Minneapolis, Minnesota may use PG 58-28. The dynamic shear rheometer (DSR) test at the high PG temperature — measuring G*/sin δ at 10 rad/s — must show a minimum value of 1.0 kPa for unaged binder and 2.2 kPa for rolling thin-film oven (RTFO) aged binder to ensure adequate rutting resistance.
Mix Design and Volumetric Issues
Improper asphalt mix design is a common contributing factor to premature rutting. Excess binder content — whether from deliberate mix design choices or from plant production variability — fills the voids in the mineral aggregate (VMA) beyond optimal levels and lubricates aggregate contacts, reducing internal friction. Conversely, insufficient VMA (below approximately 13–14% for 12.5 mm nominal maximum aggregate size mixtures) starves the mixture of the void space needed to accommodate the asphalt binder, leading to binder-rich mortar between aggregate particles that is prone to shear deformation.
The role of aggregate properties cannot be overstated. Angular, crushed aggregates with rough surface textures develop substantially higher internal friction angles (typically 40–45°) compared to rounded natural gravels (30–35°). The Superpave consensus aggregate properties — coarse aggregate angularity, fine aggregate angularity, flat and elongated particles, and sand equivalent — are directly targeted at ensuring adequate aggregate interlock for rutting resistance. Gradation also matters: mixtures with gap-graded or excessively fine gradations can lack the stone-on-stone contact needed to develop a load-bearing aggregate skeleton. Stone matrix asphalt (SMA), which uses a high coarse aggregate content (70–80%) with a rich mortar binder, has demonstrated exceptional rutting resistance in European and American applications precisely because its coarse aggregate skeleton provides a mechanically stable framework.
Construction Compaction Deficiencies
Inadequate compaction during construction is the primary cause of densification rutting. The standard specification for HMA compaction requires achieving 92–96% of the maximum theoretical density (or equivalently, air voids in the range of 4–8%, with 4% being the typical design target). When in-place density falls below 92% — corresponding to air voids above 8% — the pavement retains significant additional compaction potential. A pavement segment placed at 90% density (10% air voids) can densify to 94% density (6% air voids) under traffic, producing approximately 4–6 mm of rut depth in a 150 mm thick lift solely from post-construction consolidation.
Critical compaction factors include mix temperature at the time of rolling (the “tender zone” between approximately 93–115°C must be avoided for most mixes), roller pattern and coverage, mat thickness relative to nominal maximum aggregate size (a minimum ratio of 3:1 is recommended), and underlying layer support. Breakdown rolling must be completed before the mix temperature drops below the cessation temperature (typically 79–85°C for dense-graded mixes). Intelligent compaction (IC) technologies, which use instrumented rollers with GPS and onboard accelerometers to measure and map stiffness in real time, are increasingly deployed on major projects to ensure uniform compaction and prevent the localized weak zones that develop into individual ruts.
Rutting Severity Classification
Standardized severity classification is essential for consistent pavement condition assessment, maintenance prioritization, and performance prediction. Different agencies worldwide have developed rutting severity scales suited to their specific operational contexts, but the TxDOT classification system is among the most widely referenced and forms the basis for many automated pavement condition survey protocols.
TxDOT Shallow, Deep, Severe, and Failure Classification
The Texas Department of Transportation (TxDOT) Pavement Management Information System (PMIS) classifies flexible pavement rutting into four severity levels based on measured rut depth:
Severity Level
Rut Depth (inches)
Rut Depth (mm)
Typical Characteristics
Shallow
0.25 – 0.49
6.4 – 12.4
Visible depressions in wheel paths; water may pond slightly after rain; no significant ride quality impact; densification mechanism dominant
Deep
0.50 – 0.99
12.5 – 25.1
Clearly visible ruts; water ponding evident; some lateral displacement possible; ride quality begins to degrade; triggers maintenance planning
Severe
1.00 – 1.99
25.4 – 50.5
Major wheel-path depressions; significant water accumulation; risk of hydroplaning at highway speeds; lateral upheaval common; structural assessment required
Failure
≥ 2.00
≥ 50.8
Extreme distress; pavement structurally compromised; high hydroplaning risk; may require immediate closure or speed restriction; full reconstruction typically needed
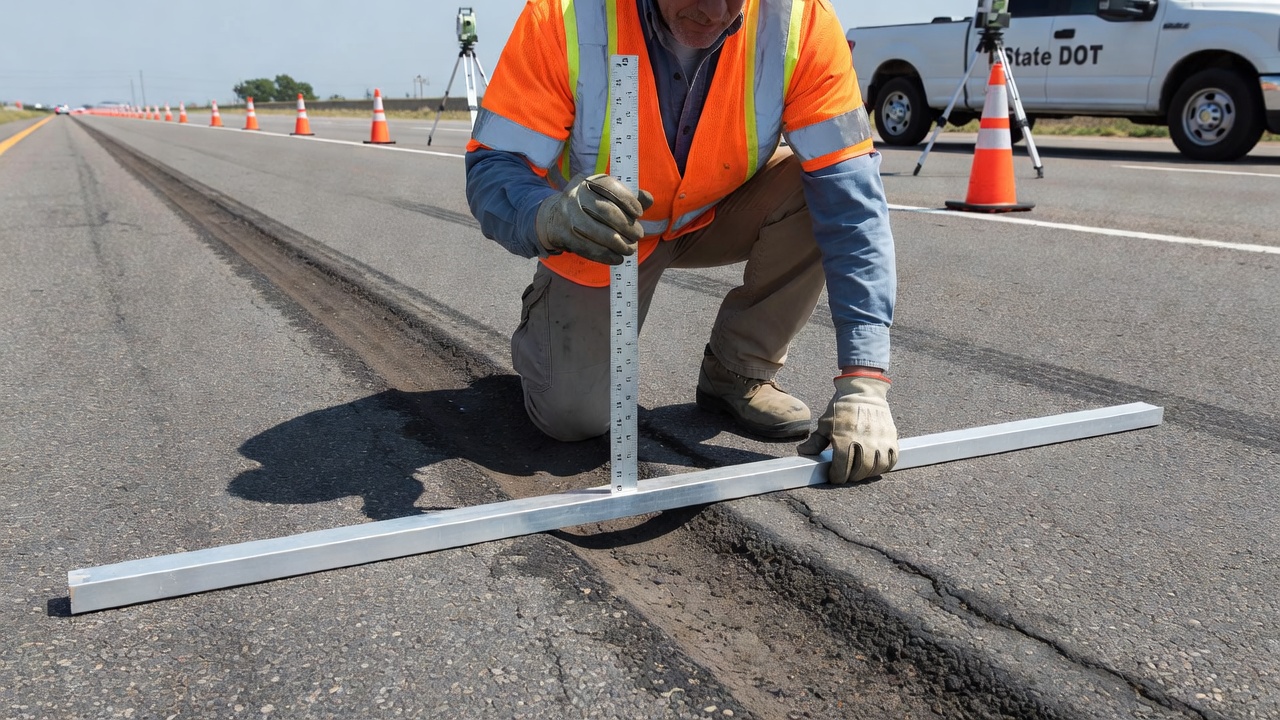
The TxDOT methodology rates rutting by both severity and extent: the area affected is measured as a percentage of the total wheel-path area within the rated pavement section. For network-level surveys, automated rut-measuring systems on inertial profiler vehicles capture continuous transverse profiles. At the project level, manual measurements using a 6.0-ft (1.83 m) straightedge and steel ruler remain the reference method, particularly for failure-level rutting where automated sensors may bottom out or saturate. The straightedge must fully span the width of the rut to capture the true maximum depth — a straightedge that is too short will bridge between the rut shoulder and edge, underreporting the actual depression depth.
ASTM D6433 PCI Rutting Severity
The ASTM D6433 Standard Practice for Roads and Parking Lots Pavement Condition Index (PCI) Surveys defines a parallel rutting severity classification used in the PAVER pavement management system:
Severity
Mean Rut Depth
Description
Low (L)
6 mm to 13 mm (0.25 to 0.5 in)
Slight rutting; not easily noticed by drivers; minimal water accumulation
Medium (M)
>13 mm to 25 mm (>0.5 to 1.0 in)
Noticeable ruts; water ponding; potential steering difficulty
High (H)
>25 mm (>1.0 in)
Severe ruts; significant water ponding; hydroplaning risk; requires immediate repair
ICAO and Airport-Specific Classification
For airport pavements, ICAO guidance does not prescribe a single universal rutting severity classification but references the inspection regimes outlined in the Aerodrome Design Manual (Doc 9157), Part 3 — Pavements. The FAA’s approach, documented in Advisory Circular AC 150/5380-6C (Guidelines and Procedures for Maintenance of Airport Pavements), uses a Pavement Condition Index (PCI) framework adapted from ASTM D5340 for airfield-specific conditions. In this context, rutting is evaluated as part of the distress survey with particular attention to its interaction with runway grooving, cross-slope drainage, and aircraft gear geometry. A rut depth of 13 mm (0.5 in) is generally considered the threshold for corrective action on primary commercial runways, while 25 mm (1.0 in) typically triggers mandatory repair.
Measurement Methods
Accurate rut depth measurement is fundamental to pavement condition assessment, maintenance programming, and remaining service life prediction. Measurement technologies have evolved from simple manual tools to sophisticated multi-sensor automated systems and, most recently, to drone-based remote sensing platforms.
Manual Straightedge Method
The manual straightedge method remains the reference standard for rut depth measurement due to its simplicity, low cost, and direct physical interpretation. The procedure involves placing a rigid straightedge — typically 1.8 m to 3.0 m (6 to 10 ft) in length — transversely across the wheel path perpendicular to the direction of travel. A calibrated ruler or wedge gauge is then used to measure the maximum vertical distance between the bottom edge of the straightedge and the lowest point of the pavement surface within the rut.
Key considerations for accurate manual measurement include: the straightedge must be of sufficient length to span beyond both edges of the rut (a 1.2 m / 4 ft straightedge is generally inadequate for wide truck ruts); measurements should be taken at multiple longitudinal positions within each rated section (typically at 15–30 m / 50–100 ft intervals); and the location must be referenced to enable repeat measurements over time. TxDOT specifies a 6.0-ft straightedge as the minimum acceptable for failure-level rutting. ASTM E1703 provides the standard test method for measuring rut-depth data from pavement transverse profiles, including the straightedge simulation algorithm that digitally replicates the physical straightedge measurement from a high-density transverse profile.
High-Speed Inertial Profilometers
Network-level rutting surveys are predominantly conducted using high-speed inertial profilers operating at highway speeds of 80–100 km/h (50–65 mph). These vehicles are equipped with an array of laser sensors — typically 3 to 30 sensors spaced 100–300 mm apart across a measurement width of 2.5–3.5 m — that sample pavement elevation at intervals of 25–150 mm along the direction of travel. An inertial reference system combining accelerometers and distance measurement instruments removes the vehicle body motion from the raw laser measurements to recover the true pavement profile.
Modern profilers achieve vertical accuracy of ±0.5 mm and transverse resolution sufficient to resolve rut profiles with fidelity approaching that of manual straightedge measurements. The collected transverse profiles are processed through a virtual straightedge algorithm that simulates the placement of a 1.8 m straightedge at multiple lateral positions along the transverse profile and records the maximum gap. The left and right wheel-path rut depths are reported separately, along with the cross-section location. The most widely used profiler certification protocols — AASHTO R 56 (Standard Practice for Certification of Inertial Profiling Systems) and the Texas Department of Transportation’s profiler validation procedure — specify cross-correlation requirements between profiler-measured and ground-truth rut depths with a maximum allowable error of ±1.5 mm for network-level surveys.
3D Laser Scanning and Mobile LiDAR
Mobile LiDAR (Light Detection and Ranging) systems mounted on survey vehicles collect dense three-dimensional point clouds of the pavement surface at rates exceeding one million points per second. These systems use a rotating or oscillating mirror to scan a laser beam across the pavement in a line perpendicular to travel, while the vehicle’s GPS/IMU positioning system provides georeferencing with centimeter-level accuracy. The resulting point cloud has a typical point density of 500–2,000 points per square meter, enabling generation of high-resolution digital elevation models (DEMs) with 5–25 mm grid spacing.
From these DEMs, rut depth is extracted by generating cross-sectional profiles at specified longitudinal intervals (commonly 0.1–5.0 m) and applying the virtual straightedge algorithm. The density of LiDAR data also permits analysis of rut geometry beyond simple maximum depth — including rut width, cross-sectional area, and asymmetry between left and right wheel paths — which provides additional diagnostic information for distinguishing between densification, shear-flow, and subgrade rutting mechanisms. Research published in the MDPI ISPRS International Journal of Geo-Information demonstrated that mobile LiDAR achieved rut depth measurement accuracy of ±2.1 mm (RMSE) compared to manual reference measurements across a test section with rut depths ranging from 5 to 35 mm.
Drone-Based Photogrammetry
Uncrewed aerial vehicles (UAVs or drones) equipped with high-resolution RGB cameras represent the fastest-evolving technology for pavement rutting survey. A drone flying at 30–50 m above ground level with a 20–24 megapixel camera can capture imagery with a ground sampling distance (GSD) of 3–7 mm per pixel. Structure-from-Motion (SfM) photogrammetry software processes the overlapping aerial images to reconstruct a dense 3D point cloud and orthomosaic of the pavement surface.
Key advantages of drone-based rutting survey include: elimination of traffic control requirements and lane closures; capture of full-lane-width data rather than just sensor-track-width data; simultaneous documentation of other distress types (cracking, raveling, patching) from the same imagery; and rapid deployment for emergency inspections after extreme weather events. The primary limitation is that SfM-derived elevation models typically achieve vertical accuracy in the range of 5–15 mm for pavement surfaces, which is coarser than LiDAR but adequate for classifying rut severity into the TxDOT categories of shallow, deep, severe, and failure. Research from Zhang et al. (2025) demonstrated that UAV photogrammetry combined with deep learning-based rut detection achieved 92% accuracy in classifying rut severity at the TxDOT category level on highway test sections.
Rutting in Airport Runways
Airport runway pavements present a uniquely demanding environment for rutting performance due to the combination of exceptionally high tire pressures, concentrated wheel-path loading, and the critical safety consequences of pavement surface deformation. The geometry of aircraft landing gear concentrates loads into narrow wheel paths that align with remarkable consistency across thousands of operations, accelerating rut development relative to highway pavements where traffic wander distributes loading across a wider area.
ACN-PCN Framework and Load Intensity
The Aircraft Classification Number (ACN) and Pavement Classification Number (PCN) system, standardized by ICAO and detailed in FAA AC 150/5335-5C, provides the framework for evaluating whether a given pavement can support a particular aircraft without experiencing structural distress including rutting. The ACN expresses the relative structural effect of an aircraft on a pavement for a specified standard subgrade strength category: high (CBR 15), medium (CBR 10), low (CBR 6), or ultra-low (CBR 3). The PCN expresses the load-carrying capacity of the pavement for unrestricted operations.
For a pavement to be adequate, the aircraft ACN must not exceed the pavement PCN. Persistent ACN/PCN exceedance — where aircraft heavier than the design aircraft regularly operate on the pavement — leads directly to accelerated rutting through both subgrade overstressing and shear-flow deformation in the asphalt layers. A pavement designed for PCN 50/F/C/X/T (medium subgrade, CBR 10) will experience substantially higher subgrade strains and accelerated rutting if regularly trafficked by an aircraft with ACN 75, because the subgrade vertical compressive strain increases approximately with the square of the load ratio.
A key difference between highway and airport pavement rutting is that aircraft gear configurations apply dual or tandem wheel loads spaced closely enough (typically 0.75–1.5 m between tires on the same gear) that their stress bulbs overlap significantly in the pavement layers. This overlapping stress field creates a wider zone of high shear stress than a single tire, promoting broader rut formation but also distributing the load more effectively to the subgrade. Wide-body aircraft such as the Boeing 777 with its six-wheel dual-tandem main landing gear configuration produce a complex pattern of pavement stresses that must be explicitly modeled using layered elastic or finite element analysis.
Water Ponding and Hydroplaning Hazards
The most immediate safety consequence of runway rutting is water ponding — the accumulation of rainwater or snowmelt in the longitudinal wheel-path depressions. Unlike highway pavements where cross-slope drainage of 1.5–2% can move water laterally off the traveled way, runway cross-slopes are limited by ICAO Annex 14 to a maximum of 1.5% (and typically 1.0–1.25% on primary runways) to avoid lateral control difficulties during crosswind landings. This modest cross-slope, combined with the width of a typical runway (45–60 m), means that water must travel substantial lateral distances to reach edge drains. Rut depressions of even 6–10 mm can trap water within the wheel paths, creating continuous longitudinal water films during rain events.
Hydroplaning occurs when a fluid film between the tire and pavement surface builds sufficient hydrodynamic pressure to lift the tire completely off the pavement. The critical hydroplaning speed for a pneumatic tire is empirically approximated by the well-known Horne formula: Vp = 9 × √P, where Vp is the hydroplaning speed in knots and P is the tire inflation pressure in psi. For a typical commercial aircraft tire inflated to 200 psi, the predicted hydroplaning speed is approximately 127 knots — a speed well within the landing ground speed range of most jet aircraft. Water depths as shallow as 2.5–5.0 mm (0.1–0.2 in) are sufficient to initiate dynamic hydroplaning on smooth pavement surfaces at typical touchdown speeds, and the presence of ruts concentrates water to depths far exceeding the runway’s mean water film thickness, creating localized hydroplaning triggers within otherwise well-drained pavement sections.
There are three recognized forms of hydroplaning relevant to runway operations: dynamic hydroplaning (complete separation of the tire from the pavement by a fluid film), viscous hydroplaning (a thin lubricating film on a smooth surface that prevents direct rubber-to-pavement contact at lower speeds), and reverted rubber hydroplaning (steam generated by friction-heated tires on wet pavement lifts the tire). Rutting contributes primarily to dynamic hydroplaning by increasing the available water depth in the tire path, but can also exacerbate viscous hydroplaning when rubber deposits from repeated landings combine with shallow water in the ruts to create an extremely low-friction interface.
FOD Generation from Rutting
Foreign Object Debris (FOD) generation is a secondary but significant safety consequence of severe runway rutting. When ruts develop to the point where the asphalt surface begins to crack at the edges of the depression — typically at the hinge points where the pavement flexes to accommodate subgrade rutting or at the upheaval ridge of shear-flow ruts — loose aggregate particles and asphalt fragments are liberated by tire scrubbing during aircraft operations. These liberated particles constitute FOD that can be ingested by jet engines, causing compressor blade damage with repair costs frequently exceeding $1 million per engine event, or can penetrate aircraft tires and fuel tanks. The FAA’s FOD prevention program explicitly identifies pavement surface deterioration including rutting as a primary FOD source and requires regular inspection and prompt repair of distressed pavement areas.
Visual and RGB Detection by Artificial Intelligence
Automated visual detection of pavement rutting using artificial intelligence represents a transformative capability for pavement management, particularly when integrated with drone-based inspection platforms. The core technical challenge is that rutting — unlike cracking or potholes — is fundamentally a three-dimensional geometric deformation of the pavement surface rather than a two-dimensional surface feature. Consequently, pure 2D image classification approaches have limited effectiveness for direct rut depth estimation, and the most successful AI-based methods combine visual analysis with 3D reconstruction techniques.
Deep Learning Approaches
Deep convolutional neural networks (CNNs) trained on labeled pavement imagery can detect the visual signatures of rutting: the characteristic parallel shadow lines generated by the rut edges under directional sunlight, the texture differences between compacted wheel-path aggregate and un-trafficked surface, and the presence of standing water or darker moisture staining in the depressed areas. Semantic segmentation models such as U-Net, DeepLabV3+, and transformer-based architectures (SegFormer, Swin Transformer) are applied to classify each pixel in a pavement image into distress categories including rutting, cracking, and patching. These models achieve pixel-level classification accuracies exceeding 90% for rutting detection when trained on sufficient and representative datasets.
For quantitative rut depth measurement, the state of the art combines SfM photogrammetry with deep learning. The drone imagery is processed through SfM pipelines (Agisoft Metashape, Pix4D, or open-source alternatives like COLMAP) to generate dense 3D point clouds. A CNN-based rut detection mask identifies the wheel-path regions in the corresponding orthomosaic, and the 3D point cloud within these masked regions is analyzed using automated straightedge-simulation algorithms to extract rut depth at programmable longitudinal intervals. A research study by Chen et al. (2024) demonstrated this integrated approach on a 5-km highway test segment, achieving a correlation coefficient of R² = 0.91 between AI-derived rut depths and manual straightedge reference measurements, with a mean absolute error of 1.8 mm across rut depths ranging from 3 to 28 mm.
Integration with Pavement Management Systems
AI-detected rutting data is most valuable when integrated into a pavement management system (PMS) that tracks condition over time, predicts future deterioration, and prioritizes maintenance and rehabilitation treatments. The Pavement Condition Index (PCI) framework, per ASTM D6433, assigns deduct values for rutting based on severity and extent that reduce the overall PCI score. Automated rutting surveys feeding directly into the PMS eliminate the subjectivity, inconsistency, and labor cost associated with manual visual surveys. TarmacView’s platform exemplifies this integration, ingesting drone-captured imagery, processing it through rutting detection AI models, classifying the detected ruts by the TxDOT severity scale, and presenting the results in a geospatial dashboard that enables airport and highway operators to track rut development over time and plan interventions based on objective, repeatable measurements.
Repair Strategies
Selection of an appropriate rutting repair strategy requires accurate diagnosis of the rutting mechanism, depth, and affected pavement layers. Applying a surface treatment to a pavement with deep structural rutting results in rapid reoccurrence of the distress and wasted expenditure. The repair hierarchy ranges from minimal intervention for shallow densification rutting to full-depth reconstruction for subgrade rutting.
Milling and Inlay
For shear-flow rutting confined to the upper asphalt layers with depths up to approximately 50 mm (2 in), milling and inlay is the preferred and most economical repair. The process involves cold milling the rutted asphalt to a depth that removes all visibly deformed material — typically 40–75 mm (1.5–3 in) depending on rut depth and HMA lift configuration — and replacing it with new, rut-resistant hot-mix asphalt compacted to specification density. The milling machine’s cutting drum is capable of profiling to remove just the wheel-path ruts while leaving the adjacent untrafficked surface intact, though full-lane-width milling is generally recommended to avoid longitudinal construction joints in the wheel paths.
Critical to the success of a mill-and-inlay repair is the use of a rut-resistant mix design for the inlay material. The replacement HMA should be designed with a PG binder grade one or two grades higher than originally used if temperature-related softening contributed to the rutting, and the aggregate structure should emphasize stone-on-stone contact with a minimum VMA of 14% for 12.5 mm NMAS mixtures. A polymer-modified binder (e.g., PG 76-22 or PG 82-22 with SBS polymer modification) provides substantially enhanced rutting resistance at elevated temperatures compared to unmodified binders. A properly executed tack coat applied at 0.15–0.30 L/m² of residual asphalt between the milled surface and the new inlay is essential for monolithic behavior of the repaired pavement.
Asphalt Overlay
Overlaying involves placing a new asphalt lift (or lifts) over the existing rutted surface to restore both transverse profile and ride quality. Overlays are appropriate when the rutting is moderate (typically 13–25 mm), is confined to the surface course, and the underlying pavement structure remains sound. The existing ruts should be filled and leveled — either through a separate leveling course or through variable-depth placement of the overlay material — to ensure that the finished surface is free of rut reflection. A minimum overlay thickness of 40 mm (1.5 in) for dense-graded HMA is recommended for structural contribution; thinner overlays function primarily as functional wearing courses.
A critical caveat is that overlays do not correct the root cause of shear-flow rutting if the unstable mix is left in place beneath the overlay. Unless the underlying cause (unstable mix, moisture-susceptible base, insufficient thickness) is addressed through milling or reconstruction, the overlay will eventually re-rut. For this reason, mill-and-overlay (milling 25–50 mm followed by overlay placement) rather than overlay-only is the preferred treatment when shear-flow rutting extends beyond the immediate surface. The milled surface also provides an excellent mechanical bond for the overlay, reducing the risk of delamination and reflective distress.
Full-Depth Reconstruction
Full-depth reconstruction is required when rutting results from subgrade failure or when the combined depth of rutting across all pavement layers exceeds approximately 75–100 mm (3–4 in). This treatment involves complete removal of the existing pavement structure — asphalt layers, base course, and in some cases the upper subgrade — and reconstruction with new materials engineered to resist the traffic loading that caused the original failure. Reconstruction provides the opportunity to address the root causes comprehensively: subgrade stabilization with lime, cement, or fly ash to increase bearing capacity; geosynthetic reinforcement (geogrids or geotextiles) at the subgrade-base interface to improve load distribution; increased pavement thickness to reduce subgrade strains; and use of premium rut-resistant HMA in the upper layers.
The cost of full-depth reconstruction ranges from approximately $100 to $300 per square meter ($120–$360 per square yard) for highway pavements and can be substantially higher for airport runways due to stricter material specifications, nighttime construction windows, and security requirements. Despite the high initial cost, reconstruction is cost-effective when compared to repeated mill-and-fill cycles that fail to address subgrade rutting — a pavement section receiving three successive mill-and-fill treatments over 10 years without subgrade remediation may ultimately cost more than a single properly executed reconstruction while delivering inferior long-term performance.
Preventive Strategies and Materials-Based Solutions
Beyond reactive repairs, preventive strategies during pavement design and construction are the most cost-effective means of controlling rutting. Key preventive approaches include:
Use of polymer-modified binders (PMB) — Styrene-butadiene-styrene (SBS) polymer modification at 3–5% by weight of binder increases the high-temperature performance grade by one to two grades (e.g., from PG 64-22 to PG 76-22) and substantially improves rutting resistance. The SBS polymer network provides elastic recovery that enables the binder to resist permanent flow under repeated shear loading. The multiple stress creep recovery (MSCR) test, specified in AASHTO M 332, quantifies this benefit through the non-recoverable creep compliance (Jnr) parameter; Jnr values below 0.5 kPa⁻¹ at the design stress level indicate excellent rutting resistance.
Stone matrix asphalt (SMA) — SMA uses a gap-graded aggregate skeleton with 70–80% coarse aggregate content interlocked through stone-on-stone contact, with voids filled by a rich mastic of asphalt binder, mineral filler, and cellulose or mineral fiber stabilizer. This structure develops high shear resistance through aggregate interlock rather than binder stiffness alone, making it less sensitive to temperature-induced softening. European experience with SMA over 40 years and U.S. experience since the early 1990s has consistently demonstrated rutting performance superior to conventional dense-graded HMA, with typical SMA rut depths of 1–3 mm after 10–15 years of heavy traffic compared to 6–12 mm for dense-graded mixes in side-by-side comparisons.
High-modulus asphalt concrete (HMAC) — Used extensively in France (Enrobés à Module Élevé, EME) and increasingly elsewhere, HMAC achieves high stiffness through a combination of hard paving-grade binders (typically 10/20 or 15/25 penetration grade) and high binder content (5.5–6.0%) that produces very low air void content after compaction. The high modulus reduces the vertical compressive strain transmitted to the subgrade for a given pavement thickness, while the low air void content minimizes post-construction densification. EME base layers have been a standard element of French pavement design for heavily trafficked routes since the 1980s and have a documented record of virtually zero rutting contribution from the EME layer itself.
Summary Table of Rutting Repair Strategies
Repair Strategy
Applicable Rut Type
Typical Rut Depth Range
Expected Service Life Extension
Key Considerations
No action / monitoring
Shallow densification
< 6 mm (< 0.25 in)
Monitor
Acceptable if rutting has stabilized; continue periodic monitoring
Micro-surfacing / thin overlay
Densification, minor mix rutting
6–13 mm (0.25–0.5 in)
5–8 years
Fills ruts; does not address underlying mix instability
Mill and inlay
Shear-flow mix rutting
13–50 mm (0.5–2 in)
8–12 years
Must use rut-resistant replacement mix; tack coat critical
Mill and overlay
Mix rutting, surface distress
13–75 mm (0.5–3 in)
10–15 years
Requires adequate bond; verify base condition before overlay
Properly diagnosing the rutting mechanism before selecting a repair strategy cannot be overemphasized. Trench sections, cores, GPR surveys, and falling weight deflectometer (FWD) testing all contribute diagnostic information. A pavement that is milled, inlaid, and re-rutted within two years has not been properly diagnosed — the money spent on the failed repair would have been better invested in the forensic investigation that should have preceded it.
Frequently Asked Questions
Mix rutting (also called shear-flow rutting) occurs within the asphalt layers themselves when the hot-mix asphalt (HMA) deforms and flows laterally under load, typically producing raised edges alongside the rut depression. Subgrade rutting occurs when the underlying soil or unbound base layers deform under repeated loading, causing the entire pavement structure to settle into the depression — usually without the raised-edge characteristic seen in mix rutting.
According to TxDOT classification, severe rutting begins at 1.00 inches (25.4 mm) depth, and failure is declared at 2.00 inches (50.8 mm) or greater. However, even shallow ruts of 0.25–0.49 inches create measurable hydroplaning risk, especially on airport runways where water can accumulate and reduce friction. Most highway agencies trigger maintenance interventions at depths between 0.5 and 1.0 inches depending on traffic speed and climate.
Airport runway rutting is measured using several methods: manual straightedge and ruler technique (placing a 6-ft or 3-meter straightedge transversely across the wheel path), high-speed inertial profilometers with laser sensors, mobile LiDAR scanning systems that capture full 3D point clouds of the runway surface, and increasingly, drone-based photogrammetry with AI-powered depth extraction algorithms. ICAO guidance in Annex 14 and the Aerodrome Design Manual Part 3 recommends regular pavement condition surveys to monitor rut development.
Rutting on airport runways is more dangerous because aircraft operate at much higher landing speeds (120–180 knots), have higher tire pressures (typically 180–220 psi), and the consequences of hydroplaning or loss of directional control are catastrophic. Water ponding in runway ruts as shallow as 3–5 mm can initiate hydroplaning at typical landing speeds. Unlike highway vehicles, aircraft cannot simply steer around ruts during takeoff and landing rolls, and the single critical path of a runway concentrates all loading into two narrow wheel-path zones.
Yes, modern computer vision and deep learning techniques can detect and quantify rutting from drone-captured RGB imagery. Convolutional neural networks (CNNs) are trained on labeled datasets to identify wheel-path depressions, while structure-from-motion (SfM) photogrammetry generates dense 3D point clouds from which rut depths are algorithmically extracted. These AI systems can classify rut severity according to standard scales (TxDOT, ASTM D6433 PCI) and integrate results into pavement management systems such as TarmacView.
Monitor and manage pavement rutting with TarmacView
Leverage AI-powered drone inspection and automated rutting detection to assess pavement condition across your airfield, highways, and road networks—faster and more accurately than manual surveys.
Raveling of Asphalt and Concrete Pavement Surfaces
Raveling is the progressive dislodgement and loss of aggregate particles from the pavement surface due to binder aging, oxidation, or poor compaction. In airpor...
Longitudinal Cracking in Asphalt and Concrete Pavements
Longitudinal cracks run parallel to the pavement centerline or direction of travel. Causes include poor construction joint bonding, reflective cracking from und...
Runway surface refers to the engineered materials and layered pavement systems forming the load-bearing surface of airport runways, designed to support aircraft...
5 min read
Airport Infrastructure
Pavement Materials
+1
Cookie Consent We use cookies to enhance your browsing experience and analyze our traffic. See our privacy policy.