Riprap
Riprap is a layer of loose, angular stone or concrete blocks placed around bridge piers, abutments, and channel banks to armor the streambed against scour erosi...
21 min read
Bridges
Scour Protection
+2
Scour is the erosion or removal of streambed or bank material around bridge foundations (piers and abutments) due to flowing water, the leading cause of bridge failure in the United States. Covers scour types (general; contraction; local), assessment methods, monitoring instrumentation, countermeasures (riprap; sheet piles; articulated blocks), and inspection during and after flood events.

Bridge scour is the removal of granular bed material — sand, gravel, silt, clay, or other alluvial deposits — from around bridge substructure elements by the erosive action of flowing water. It is the single most common cause of bridge failure in the United States, responsible for over 60% of all bridge collapses according to FHWA statistics compiled since the 1987 Schoharie Creek Bridge failure in New York. Scour undermines bridge foundations by removing the soil mass that provides vertical bearing support and lateral stability, potentially leading to sudden, catastrophic failure with no advance warning.
The scour process begins when the shear stress exerted by flowing water on the streambed exceeds the critical shear stress required to mobilize the bed material particles. This threshold is defined by the Shields parameter, a dimensionless critical shear stress that depends on particle Reynolds number. For cohesionless materials (sand and gravel), the critical shear stress is proportional to particle diameter. For cohesive materials (silt and clay), electrochemical interparticle forces significantly increase erosion resistance, making scour prediction considerably more complex. The rate of scour development follows an asymptotic curve — rapid initial erosion in the first few hours of a flood event decelerating toward an equilibrium depth as the scour hole enlarges and flow velocities within the hole decrease.
The hydraulic conditions that drive scour are defined by the Froude number (Fr = V/√(gy)), where V is mean velocity, g is gravitational acceleration, and y is flow depth. High Froude numbers (supercritical flow, Fr > 1.0) produce significantly greater scour depths than subcritical flow (Fr < 1.0) at equivalent discharges. The approach flow angle — the angle between the pier centerline and the direction of flow — is a critical parameter. An angle of attack exceeding 5 to 10 degrees can increase pier scour depth by 50% or more compared to aligned flow, according to HEC-18 guidance. Flow skewness is often caused by channel meander migration, debris accumulation, or ice jams redirecting flow toward unprotected foundations.
The FHWA Hydraulic Engineering Circular No. 18 (HEC-18) — Evaluating Scour at Bridges, Fifth Edition (FHWA-HIF-12-003) — provides the national standard for evaluating scour. It classifies scour into three primary mechanisms: general scour (long-term degradation of the streambed), contraction scour (removal of material due to flow constriction at the bridge opening), and local scour (erosive action of flow vortices around individual piers and abutments). The total scour depth at any bridge element is the sum of these three components plus any long-term aggradation (deposition) or degradation (erosion) trend determined from historic cross-section surveys. The AASHTO LRFD Bridge Design Specifications (Article 3.7.5) requires that all new bridges over waterways be designed to withstand the 100-year flood without foundation failure and checked for the 500-year superflood without collapse.
General scour, also called long-term degradation, refers to the gradual lowering of the streambed elevation over periods of years to decades due to natural watershed evolution, land use changes, upstream dam construction or removal, channelization, or gravel mining. Unlike contraction and local scour which occur during individual flood events, general scour represents the cumulative effect of multiple flow events over the service life of the bridge. The rate of degradation is determined by comparing historic cross-section surveys at the bridge site — FHWA recommends reviewing a minimum of 10 to 20 years of survey data to establish trend lines. Degradation rates of 0.1 to 0.5 feet per year are common in actively degrading streams.
Long-term degradation is evaluated using sediment transport models such as HEC-6 (Scour and Deposition in Rivers and Reservoirs) or through regression analysis of historic thalweg (deepest channel) elevations. The USACE HEC-RAS sediment transport module can simulate degradation and aggradation over decades, accounting for changes in flow regime and sediment supply. If no survey data exists, regional degradation curves developed by state DOTs from similar watersheds may be used. General scour is algebraically added to the hydraulic scour depth computed for the design flood event.
Contraction scour occurs when a bridge constricts the natural waterway, either through abutment encroachment into the floodplain or by the bridge deck itself during overtopping events. The constriction reduces the cross-sectional flow area, increasing flow velocity and bed shear stress through the bridge opening. The increased sediment transport capacity exceeds the sediment supply from upstream, causing erosion of the streambed within the contracted reach until equilibrium is re-established — or until the flood recedes.
FHWA HEC-18 defines two distinct contraction scour regimes. Live-bed contraction scour occurs when there is active sediment transport from the upstream reach into the bridge contraction. The scour depth is governed by the ratio of flow widths: ys = y₂ — y₁, where y₂ is the equilibrium depth in the contracted section and y₁ is the approach depth, computed using Laursen’s live-bed contraction scour equation. The equation accounts for the critical velocity of the bed material through the ratio V₁/Vc. If V₁ exceeds Vc, live-bed conditions exist. Clear-water contraction scour occurs when the approach flow velocity is below the critical velocity for particle motion, meaning no sediment is transported from the upstream reach. Scour continues in the contracted section until the velocity in the scour hole drops below the critical velocity. Clear-water scour is computed using a different equation based on the critical shear stress and particle size.
The dominant variables in contraction scour analysis include the approach section flow width and depth, the contracted section flow width, the mean particle size (D₅₀) of the bed material, the water temperature (affecting kinematic viscosity and the K₁ velocity distribution coefficient), and the discharge ratio between approach and contracted sections. The HEC-RAS Bridge Scour module automates these computations using the flow distribution method, dividing the cross section into left overbank, main channel, and right overbank subsections — typically 20 subsections in the main channel and 5 in each overbank for adequate resolution.
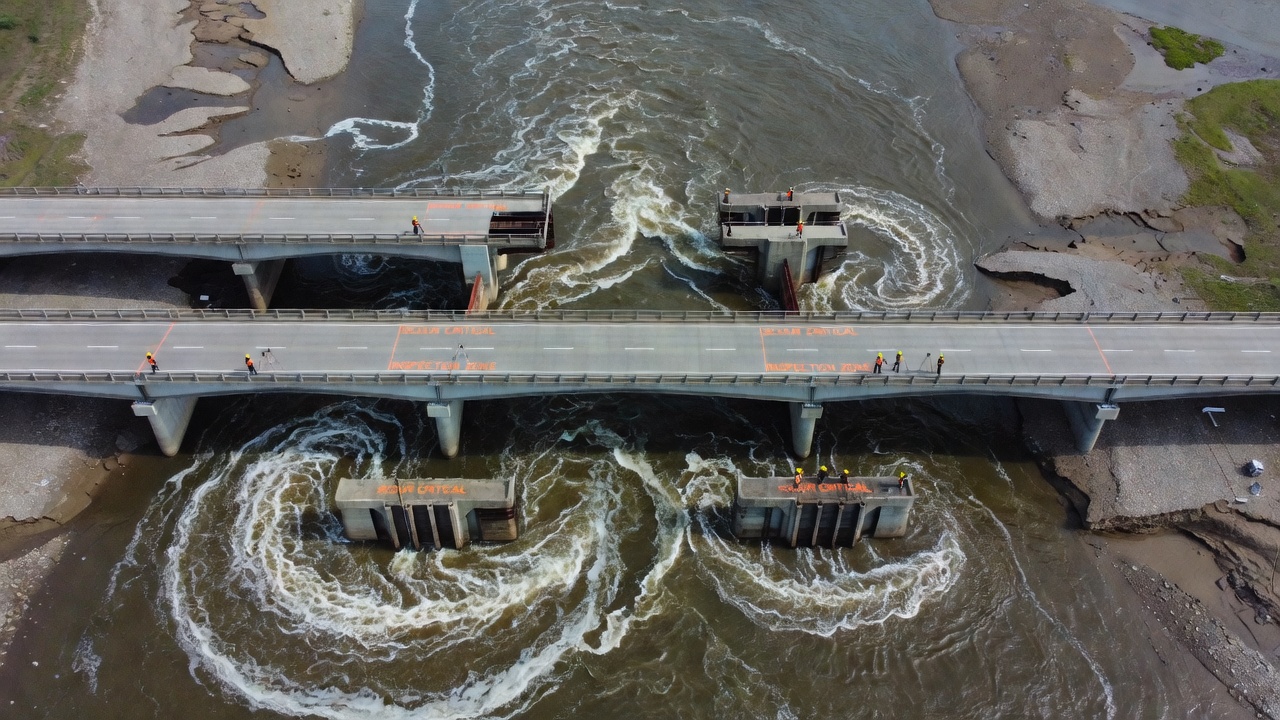
Local pier scour is caused by the three-dimensional flow field that develops around bridge piers. The approaching flow is deflected downward at the upstream face of the pier, creating a down-flow that scours the bed at the base of the pier. This down-flow, combined with flow acceleration around the pier sides, generates a horseshoe vortex system that wraps around the pier — resembling a horseshoe in plan view. The horseshoe vortex is the primary erosive mechanism, removing bed material from the base of the pier and transporting it downstream. A wake vortex system forms downstream of the pier, occasionally transporting additional material.
The maximum pier scour depth is computed using the CSU (Colorado State University) equation, also known as the HEC-18 pier scour equation:
ys/y₁ = 2.0 × K₁ × K₂ × K₃ × K₄ × (a/y₁)^0.65 × Fr₁^0.43
Where ys = scour depth, y₁ = flow depth directly upstream of the pier, a = pier width, Fr₁ = Froude number at the approach section, K₁ = pier nose shape correction factor (1.0 for square nose, 0.9 for round nose, 0.8 for circular cylinder, 0.7 for group of cylinders, 0.55 for sharp nose), K₂ = angle of attack correction factor (increases significantly as skew exceeds 5°), K₃ = bed condition factor (1.1 for clear-water scour, 1.0 for live-bed scour with plane bed, 1.1 to 1.3 for dune bed conditions), and K₄ = armoring factor for bed material size.
The CSU equation applies to piers in coarse-bed materials. For piers in fine-bed materials (silt and clay), the Froehlich equation provides an alternative estimate. Pier scour depth is directly proportional to pier width — a pier 5 feet wide in 15 feet of flow depth will experience roughly 11 feet of scour under typical design conditions (Fr = 0.3). Pile groups, pile caps, and spread footings exposed above the streambed create additional turbulence and scour potential. Pressure flow scour occurs when the bridge deck is submerged and the flow is forced under the deck, creating extremely high velocities and scour potential at the foundation.
Local abutment scour results from flow accelerating around the abutment nose and along the abutment face, combined with the horseshoe vortex generated at the abutment toe. The scour process at abutments is more complex than at piers because abutments interact with the approach embankment, which redirects overbank flow toward the bridge opening. The length of the embankment projecting into the flow (L), the abutment shape (spill-through, vertical, or wing-wall), and the skew angle all influence scour depth.
FHWA HEC-18 provides two primary abutment scour equations. Froehlich’s equation is used for abutments with spill-through slope angles of 90 degrees or less (i.e., vertical to sloping abutments):
ys/y₁ = 2.27 × K₁ × K₂ × (L’/y₁)^0.43 × Fr₁^0.61 + 1
Where K₁ = shape factor (1.0 for vertical abutment, 0.82 for vertical abutment with wing walls, 0.55 for spill-through abutment), K₂ = skew factor, and L’ = effective abutment length projecting into the channel. The HIRE equation applies when the abutment protrudes significantly into the channel (L/y₁ > 25) and was developed from field data at the University of Mississippi.
The newer NCHRP 24-20 abutment scour approach adopts a more physically representative methodology. It first calculates contraction scour depth (Yc) at the left or right overbank area near the abutment using simplified live-bed or clear-water equations, then scales the contraction scour depth by an amplification factor (≥ 1.0) to account for the turbulent flow near abutments. The amplification factor is determined from HEC-18 Figures 8.9 through 8.12 based on the ratio of embankment length to bridge opening width (L/Bf). For skewed embankments, the embankment length is corrected to its projected length perpendicular to the flow. The FHWA Hydraulic Toolbox conveniently implements the NCHRP 24-20 approach. Field comparisons indicate that HIRE equation predictions can be 2 to 4 times larger than NCHRP 24-20 predictions, so engineering judgment is essential in selecting the appropriate methodology.
Scour assessment follows a three-phase methodology defined in FHWA HEC-18. Phase 1 — Screening uses a three-level approach to prioritize bridges for detailed evaluation. Level 1 reviews existing data — structure inventory, hydrology, geotechnical reports, and inspection history. Level 2 conducts a simplified scour analysis using regional regression equations or nomographs. Level 3 requires detailed hydraulic and scour analysis. Bridges are prioritized based on foundation type, channel stability, flood history, and criticality of the route. Bridges with unknown foundations (Item 113 code U) receive highest priority.
Phase 2 — Detailed Scour Analysis uses HEC-RAS, the US Army Corps of Engineers River Analysis System, to perform the hydraulic simulation. The model requires steady flow data for the design discharge (typically the 100-year flood, Q₁₀₀), geometric data including cross sections at the approach section (typically 1 to 2 bridge widths upstream), at the bridge section (immediately upstream and downstream of the bridge), and at the exit section (1 to 2 bridge widths downstream). The model computes water surface elevations, flow depths, velocity distributions across the cross section, and energy grade line slopes. HEC-RAS divides the bridge cross section into left overbank, main channel, and right overbank subsections — typically 20 subsections in the main channel for adequate velocity distribution resolution.
The scour computations within HEC-RAS are performed using the Hydraulic Design Functions — Scour at Bridges module. For contraction scour, the program uses Laursen’s live-bed equation or clear-water equation based on the V₁/Vc ratio automatically computed from the approach section. The D₅₀ mean particle size and water temperature (for the K₁ coefficient) are user-specified inputs. For pier scour, the CSU equation uses the pier width, nose shape, angle of attack, bed condition, and D₉₅ armoring size. The program offers the option to use maximum V₁ and y₁ values across the cross section or values specific to each pier. Abutment scour computations use Froehlich’s equation or the HIRE equation, with the program automatically selecting the appropriate equation based on the L/y₁ ratio. The abutment shape factor (spill-through, vertical, wing-wall) and skew angle are user inputs.
HEC-RAS does not compute long-term aggradation or degradation. The modeler must independently determine the long-term streambed elevation change using sediment transport modeling (HEC-6 or HEC-RAS sediment transport) or historic trend analysis. The total scour depth at each substructure element is the sum of:
Total Scour = Long-term degradation + Contraction scour + Local pier or abutment scour
Phase 3 — Scour Vulnerability Classification compares the computed total scour depth to the foundation bottom elevation. Three standard examples defined in HEC-18 are: Example A — Scour above the top of footing (foundation stable), Example B — Scour within the limits of the footing or pile embedment (moderate vulnerability), and Example C — Scour below the spread-footing base or pile tips (foundation unstable — scour critical). Spread footings are particularly vulnerable because once the scour depth drops below the footing base, the foundation loses all bearing support nearly instantaneously. Deep foundations (piles and drilled shafts) can retain vertical capacity as long as sufficient embedment remains, though lateral support is significantly reduced.
Probing is the most basic scour measurement technique, using a graduated metal rod or weighted cable deployed from the bridge deck or a boat. The probe is pushed into the streambed until resistance indicates the original bed material below any loose scour hole fill. A flat plate or disk attached to the rod (the Mississippi plate or scour disk) prevents the rod from penetrating soft fill material, providing a more accurate reading of the denser undisturbed bed elevation. The American Society of Civil Engineers (ASCE) and FHWA recommend a minimum plate diameter of 12 inches (300 mm) for accurate scour measurement. Probing works best at low to moderate flow velocities (below 3 ft/s) and in non-cohesive bed materials. It is operator-dependent and can be hazardous during flood events.
Sonar (Sound Navigation and Ranging) is the primary portable scour measurement technology for depths exceeding approximately 3 feet. Echo sounders transmit acoustic pulses from a transducer mounted on a boat or deployed from the bridge deck. The time delay between pulse transmission and return echo is converted to water depth using the speed of sound in water (approximately 1,500 m/s). Side-scan sonar provides plan-view imagery of the streambed, useful for identifying scour hole extent and shape. Sub-bottom profilers use lower-frequency acoustic signals that penetrate the bed surface, revealing stratigraphy and identifying historic scour and fill sequences.
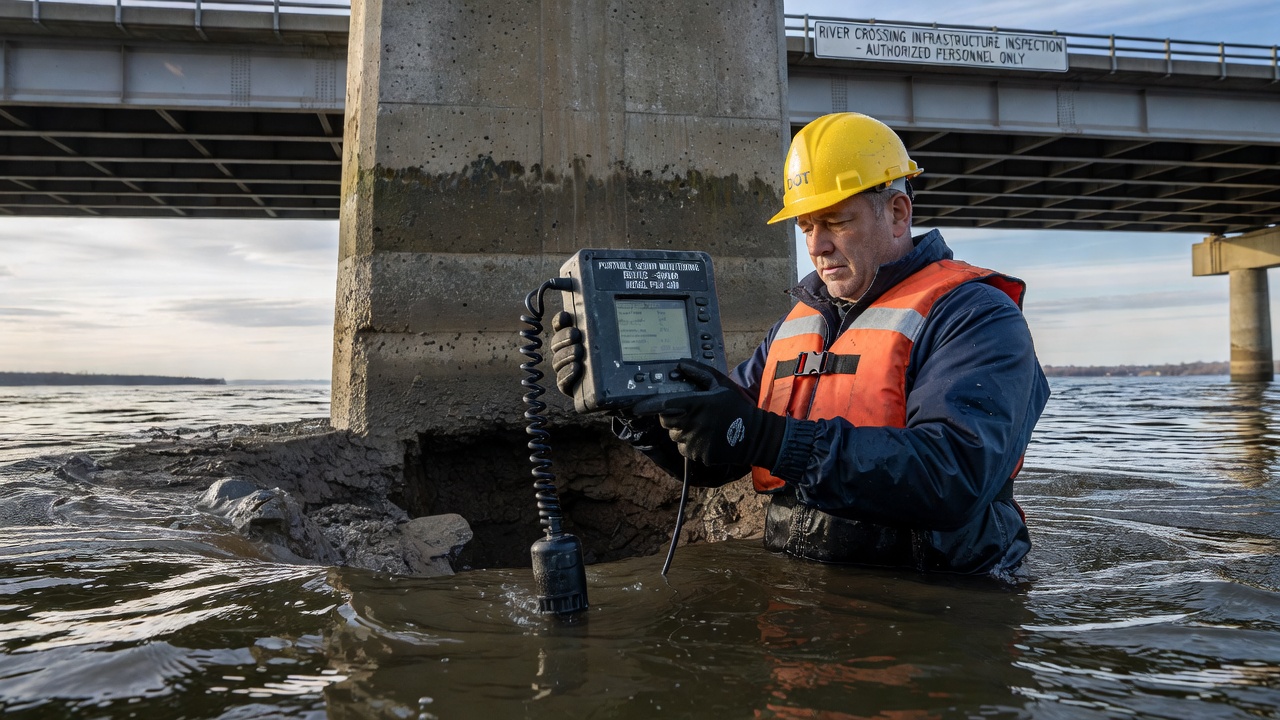
The FHWA portable sonar scour monitoring system — a boat-mounted or bridge-deployable echo sounder with real-time GPS positioning — provides accurate (±0.1 ft) streambed profiles at each pier and abutment. Readings are collected at multiple points around each substructure unit (typically upstream nose, both sides, and downstream wake zone) and compared to baseline surveys to identify changes. Sonar operation is most effective when water depth exceeds 3 feet, velocities are below 8 ft/s, and suspended sediment concentrations are within equipment specifications. Turbulence, air entrainment, debris, and steep bed slopes can degrade sonar accuracy.
Underwater bridge inspection by certified commercial divers is required when visual inspection of submerged foundations cannot be accomplished by other means. The NBIS (23 CFR 650 Subpart C) mandates underwater inspection for all bridges over waterways where scour is a concern, with intervals determined by the scour criticality rating. Diving inspections provide high-quality direct observation of foundation condition including exposed footing dimensions, pile condition, debris accumulation, scour hole geometry, and countermeasure condition. Divers use underwater video cameras, digital still cameras, ultrasonic thickness gauges, and hand-held probes for detailed documentation. Safety constraints include water velocity (typically limited to 3 to 5 ft/s depending on diver experience and tether configuration), water clarity (minimum 1 to 3 feet visibility for meaningful inspection), and underwater hazards including debris and entanglement risk.
Unmanned aerial vehicles (UAVs) equipped with high-resolution cameras and photogrammetry software provide rapid, comprehensive documentation of scour conditions at bridges. Drone inspection captures oblique and vertical imagery of the bridge substructure, channel banks, debris accumulation, and scour hole extent. Structure-from-motion (SfM) photogrammetry processing generates orthomosaic images and digital elevation models (DEMs) with ground sampling distances as fine as 0.5 to 1.0 inches. Comparison of drone-derived DEMs from successive inspections quantifies channel change including scour hole development, bank erosion, sediment bars, and channel migration. LiDAR-equipped drones provide streambed topography measurement through clear water using green-wavelength lasers (bathymetric LiDAR), though accuracy degrades with water turbidity. Drone inspection cannot directly measure scour depth under standing water — it is complementary to sonar and probing methods for subaqueous measurement.
Fixed scour monitoring instruments are permanently installed at bridges to provide continuous, real-time or scheduled measurement of streambed elevation changes. Fixed systems are required for scour critical bridges (Item 113 codes 3, 2, 1) and bridges with unknown foundations (code U) per FHWA guidance. The Plan of Action (POA) specifies the type of instrument, installation location (which pier/abutment), sample interval (30 minutes to 12 hours), data transmission method, alert elevations, and critical elevations.
Magnetic sliding collars are the most widely deployed fixed scour monitor. The system consists of a vertical probe — typically a 2-inch diameter steel pipe or PVC pipe — installed adjacent to a pier or abutment and embedded below the maximum anticipated scour depth. A series of magnetic switches encased in watertight collars slide freely along the probe. As the streambed erodes, the collars descend with the falling bed surface. Each collar contains a magnetic reed switch that closes at a specific elevation, transmitting a signal to a data logger at the bridge or remotely via cellular telemetry. The system provides discrete depth readings at each collar location. Multiple collars are spaced at 1 to 2-foot intervals along the probe to provide adequate vertical resolution.
Float-out devices (also called scour monitors or erosion sensors) consist of a tethered transmitter buried in the streambed at a predetermined depth. When scour reaches the device, the float is released by erosion and rises to the water surface, activating the transmitter which reports the scour event and depth via radio or cellular communication. The transmitter also serves as a visual marker for inspection crews. Float-out devices are simple, robust, and inexpensive but provide only a single measurement — once triggered, the device must be reset by burying a new unit.
Sonar transducers provide continuous streambed distance measurement with high accuracy (±0.01 ft). An acoustic transducer mounted on the pier face or on a dedicated support structure emits an ultrasonic pulse vertically downward and measures the return time. Multiple transducers can be installed around a single pier to map the scour hole shape in real time. Data are recorded to an on-site data logger and transmitted via cellular modem or satellite telemetry. Power is typically supplied by solar panels with battery backup. Sonar systems require periodic maintenance to remove biofouling (algae, zebra mussels) from the transducer face. They perform poorly in high-turbidity conditions and air-entrained water during flood events.
Time-domain reflectometry (TDR) uses a buried coaxial cable embedded in the streambed. As scour erodes the bed, the cable is exposed at the air-water interface, creating a change in the electrical impedance that is detected by a TDR pulser at the surface. The distance from the pulser to the erosion interface is determined from the signal reflection time, providing accurate (±0.1 ft) depth measurement. TDR systems are less susceptible to biofouling than sonar and can be installed with multiple cable loops at different elevations. The primary disadvantage is that the cable is consumable — once exposed, it must be replaced after the flood event.
Portable scour monitors are deployed manually during or after flood events and can be moved between multiple bridge sites. The FHWA portable sonar system consists of a boat-mounted or bridge crane-deployed echo sounder, real-time kinematic (RTK) GPS receiver, data collection computer, and mounting hardware. The operator positions the sonar transducer at each measurement point (typically 5 to 25 points per bridge) and the system records depth and position simultaneously. Post-processing generates streambed topography maps and identifies elevation changes by comparison with baseline surveys.
Bridge-deployed acoustic Doppler current profilers (ADCP) measure both streambed elevation and three-dimensional flow velocity simultaneously. ADCPs are typically deployed from a boat traversing the bridge cross section and provide discharge measurement concurrent with bed mapping. The Hydroacoustic scour monitoring approach uses fixed ADCP installations for continuous velocity and bed elevation monitoring.
Portable systems are most effective when deployed within 24 to 72 hours after a flood peak. The trade-off is that manual deployment during flood events exposes personnel to safety risks, so automated fixed monitoring is preferred for high-risk scour critical bridges. Newer technologies including fiber-optic strain sensors embedded in piles, MEMS (micro-electromechanical) accelerometers for foundation movement detection, and smart rocks with embedded RFID tags that migrate with scour holes are under development by FHWA and NCHRP research programs.
Riprap — graded quarry stone placed around piers and abutments — is the most widely used scour countermeasure in the United States. Riprap functions by armoring the streambed surface, increasing the local critical shear stress above the applied shear stress from flowing water. The armor layer absorbs turbulent energy and prevents direct contact between the flow and the underlying erodible bed material. Riprap design follows the methodology in FHWA HEC-23 (Bridge Scour and Stream Instability Countermeasures, Third Edition) and NCHRP Report 593.
The median riprap stone size (D₅₀) is determined using the Isbash equation or the HEC-23 design charts. The Isbash equation for rock stability on a streambed is:
D₅₀ = V² / (2g(SG — 1))
Where V = mean velocity at the pier, g = gravitational acceleration, and SG = specific gravity of the rock (typically 2.65). A factor of safety of 1.2 to 2.0 is applied depending on the consequence of failure and the accuracy of velocity estimates. A minimum D₅₀ of 6 to 12 inches is typical for moderate velocities (5 to 10 ft/s). For extreme velocities exceeding 15 ft/s, D₅₀ may reach 36 inches or larger. Riprap gradation must be well-graded with a uniformity coefficient (D₆₀/D₁₀) between 1.5 and 3.0. A filter layer — either granular filter (graded sand and gravel) or geotextile filter fabric — is required beneath the riprap to prevent migration of the underlying bed material through the armor layer. Filter design follows the Terzaghi filter criteria or FHWA HEC-23 guidelines.
Riprap placement extends horizontally a minimum distance from the pier face. FHWA recommends a minimum apron width of 2 to 3 times the pier width or 10 feet, whichever is greater. The apron is placed at a thickness of 2 × D₁₀₀ or 1.5 × D₅₀, with a minimum thickness of 18 inches. At abutments, riprap is placed on the embankment slope from the bridge seat elevation down to the streambed, extending a minimum of 25 feet horizontally for slopes steeper than 2:1. The top elevation of riprap is placed at the elevation of the existing streambed plus an allowance for future degradation. Grouted riprap uses cement grout injected into the voids between stones for enhanced stability where individual stone displacement is a concern, though grouting reduces flexibility and filter compatibility.
Gabion mattresses are rectangular wire mesh baskets filled with stone, typically 3 to 6 inches in diameter, laced together to form a continuous flexible mat. Mattress thickness is typically 6 to 12 inches. Gabions are used for abutment slope protection, bank stabilization, and channel lining where riprap may be difficult to place or maintain. The wire mesh is typically galvanized steel or PVC-coated for corrosion resistance. Gabions are more flexible than rigid concrete revetments, allowing them to conform to minor settlement or scour without failure. The primary disadvantage is vulnerability to vandalism (cut wire mesh) and debris impact damage. Gabions are not recommended for locations with high debris or ice loads.
Steel sheet piles are interlocking steel sections driven vertically around pier foundations to form a continuous cutoff wall. The sheet pile wall prevents the lateral migration of scour holes into the pier foundation zone and provides a physical barrier against flow-induced erosion. Sheet piles are typically driven to a depth of 1.5 to 2.0 times the estimated scour depth below the scour elevation or to bedrock, whichever is shallower. Sheet piling is effective where deep scour is expected and where the foundation type (spread footing) cannot tolerate loss of lateral support. Concrete sheet piles are used where corrosion resistance or longer service life (75+ years) is required. The sheet pile wall must be designed for the lateral earth and water pressures acting on the wall during and after scour development, typically using the free earth support method for cantilever walls. Tieback anchors may be required for tall walls or where significant lateral loads are anticipated.
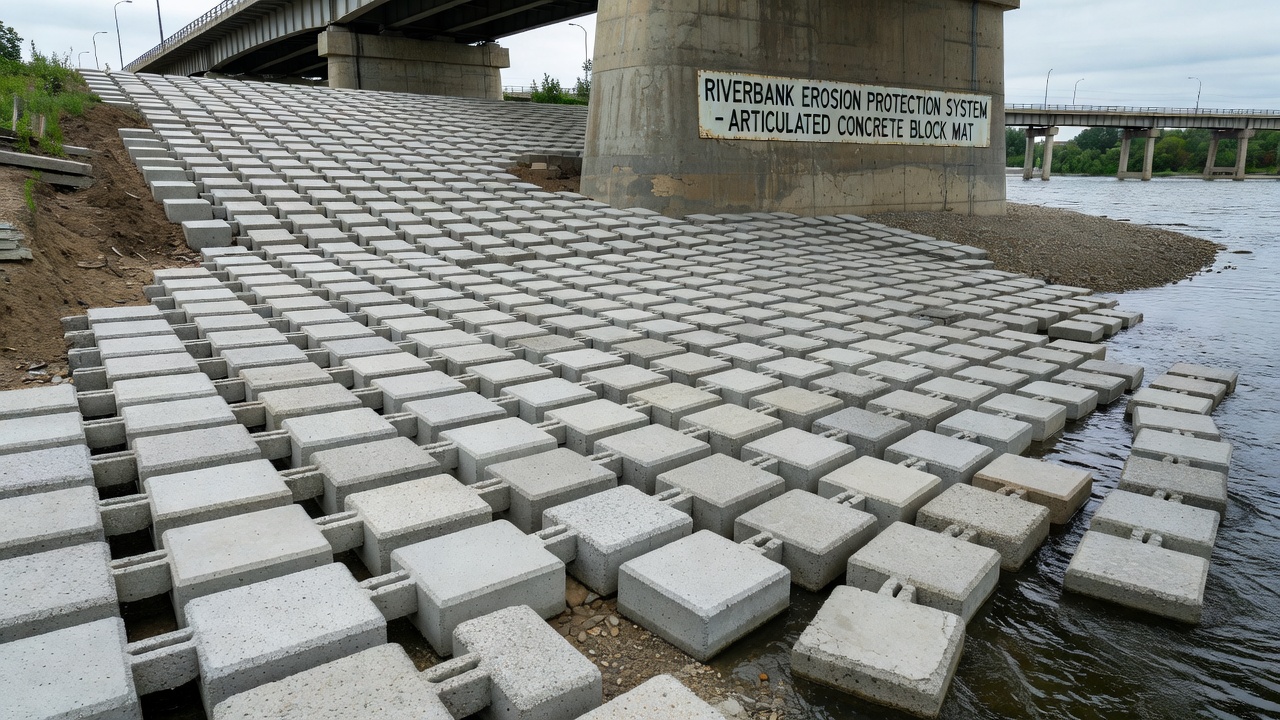
Articulated concrete block systems (ACBs) consist of pre-cast concrete blocks interconnected by cables, geotextile, or interlocking geometry to form a continuous, flexible erosion protection mat. Block dimensions are typically 2 to 4 feet in length and width, 5 to 8 inches in thickness, with voids ranging from 10% to 50% of the block surface area for hydraulic connectivity and vegetation establishment. ACBs are placed on a geotextile filter fabric over the prepared subgrade. The mat flexibility allows it to conform to scour hole development without losing continuity — individual blocks can settle or rotate while the mat remains intact, providing continued protection.
ACB design follows FHWA HEC-23 Design Guideline 8 and NCHRP Report 593. The required block thickness is determined from the applied shear stress at the pier, the critical shear stress of the ACB system (determined from laboratory testing or manufacturer data), and a factor of safety typically 1.5 to 2.0. ACBs offer several advantages over riprap: uniform thickness reduces material quantity, hydraulic efficiency is improved due to smoother surface, vegetation can be established through block voids for environmental mitigation, and the interconnected system is more resistant to individual block displacement. Disadvantages include higher material cost, specialized installation equipment, and vulnerability to edge failure if the mat perimeter is not adequately anchored.
Grout-filled mattresses are woven geotextile mats that are filled with cement grout on site, forming a continuous flexible revetment. They conform well to irregular bed surfaces and cure to form a durable, low-maintenance armor layer. Geotextile sand containers (sandbags or geocontainers) are used for temporary or emergency scour protection — they consist of geotextile tubes or bags filled with sand or aggregate, stacked or placed to form erosion protection. Concrete cribbing and concrete-filled bags are used for foundation encasement where footing exposure has already occurred.
Structural countermeasures include foundation underpinning (extending existing footings to deeper bearing strata using piles or micropiles), pier retrofit (wrapping existing piers in reinforced concrete jackets), pier geometry modification (adding a protective collar or deflector to reduce vortex formation), and pier removal and replacement. Flow-altering countermeasures such as guide banks, spur dikes, and bendway weirs redirect flow away from piers and abutments to reduce scour potential. Guide banks (also called spur dikes) are earth or rock dikes constructed upstream of the bridge to redirect flow through the bridge opening. Riprap dikes and rock vanes deflect flow from eroding banks. The selection of countermeasure type depends on scour mechanism, site conditions, construction access, environmental constraints, debris and ice considerations, cost, and maintenance requirements.
NBI Item 113 — Scour Critical Bridges is the National Bridge Inventory element that identifies the scour vulnerability status of each bridge over a waterway in the United States. It is a single-digit code defined by the FHWA Recording and Coding Guide for the Structure Inventory and Appraisal of the Nation’s Bridges. The coding was revised by FHWA memorandum on April 27, 2001, to expand code descriptions and encourage development of Plans of Action for scour critical bridges.
The Item 113 coding system uses the following codes:
| Code | Description |
|---|---|
| N | Bridge not over waterway |
| U | Bridge with unknown foundation that has not been evaluated for scour — a Plan of Action must be developed |
| T | Bridge over tidal waters, not evaluated but considered low risk — bridge monitored with regular inspection cycle |
| 9 | Bridge foundations on dry land well above flood water elevations |
| 8 | Bridge foundations stable for assessed/calculated scour — scour above top of footing (Example A) |
| 7 | Countermeasures installed to mitigate existing scour problem — POA instructions implemented |
| 6 | Scour evaluation has not been performed |
| 5 | Bridge foundations stable for assessed/calculated scour — scour within footing or pile limits (Example B) |
| 4 | Bridge foundations stable for assessed/calculated scour — field review indicates action required to protect exposed foundations |
| 3 | Scour critical — foundations unstable for assessed/calculated scour (scour within footing/pile limits or below spread-footing base/pile tips) |
| 2 | Scour critical — field review shows extensive scour has occurred at foundations, determined unstable by comparison of calculated vs. observed scour or by engineering evaluation |
| 1 | Scour critical — field review indicates failure of piers/abutments is imminent; bridge closed to traffic |
| 0 | Scour critical — bridge has failed and is closed to traffic |
A scour critical bridge is defined as one with abutment or pier foundations rated as unstable due to (1) observed scour at the bridge site (rating factor 2, 1, or 0) or (2) a scour potential determined from a scour evaluation study (rating factor 3). Whenever a rating factor of 2 or below is determined for Item 113, the rating factor for Item 60 — Substructure and other affected items (load ratings, superstructure rating) must be revised to be consistent with the severity of observed scour.
A Plan of Action (POA) must be developed for each bridge coded 3, 2, 1, 0, or U. The POA is a comprehensive document that includes: general bridge information, responsible parties, scour vulnerability summary, recommended monitoring actions (increased inspection frequency, fixed monitoring devices, flood monitoring program), recommended countermeasures (with priority ranking and estimated costs), bridge closure plan with criteria for closure and re-opening, detour route description, and attachments including boring logs, cross sections, bridge elevation showing existing streambed and foundation depths, and photographic documentation. The POA is updated at specified intervals (typically annually to every 5 years) or after significant flood events. The FHWA revised POA template (available at www.fhwa.dot.gov/engineering/hydraulics/bridgehyd/poaform.cfm ) provides a standardized format accepted by all FHWA division offices.
A post-flood scour inspection is a special inspection conducted immediately after a flood event reaches a predefined threshold to assess scour damage at bridges. The inspection is mandated by the bridge POA for all scour critical bridges and is recommended for all bridges over waterways after major flood events. The inspection must occur within a specified timeframe — FHWA recommends within 30 days, but many state DOTs specify 24 to 72 hours for high-priority scour critical bridges on emergency evacuation routes.
The flood event threshold that triggers a post-flood inspection is defined in the POA based on one or more criteria: discharge (e.g., Q ≥ 50,000 cfs measured at a downstream USGS gage), stage (e.g., water surface elevation exceeds the 10-year flood stage), rainfall (e.g., 6-inch rainfall in 24 hours within the watershed), or flood forecast from the National Weather Service or regional flood warning system. For bridges with fixed monitoring instrumentation, a scour alert elevation or scour critical elevation reading automatically triggers the inspection.
The post-flood inspection protocol includes: visual examination of channel banks and substructure for scour holes, debris accumulation, channel migration, embankment erosion, and approach settlement; streambed elevation measurement using portable sonar or sounding rod at each pier and abutment — typically 5 to 25 measurement points per bridge; comparison of measured elevations to pre-flood baseline data and to alert/critical elevations defined in the POA; documentation of riprap displacement or countermeasure damage; and underwater inspection by divers if water clarity permits or if sonar indicates significant changes.
Measured scour depths are compared to the computed scour depths from the HEC-18 analysis. If actual measured scour exceeds computed scour by more than 25%, the bridge may require re-evaluation and potential load restriction. If actual scour reaches the scour alert elevation (typically 75% of the computed maximum scour depth), the increased monitoring frequency is triggered. If actual scour reaches the scour critical elevation (typically 100% of computed maximum scour depth or the foundation bottom elevation), the bridge closure plan is activated and the bridge is closed until a structural and geotechnical evaluation confirms safety. Stream cross-section surveys are compared to previous surveys to identify channel changes — a new equilibrium cross-section may require revised hydraulic modeling.
The inspection report must be submitted to the bridge owner within the timeframe specified in the POA (typically 5 to 30 days). The report includes measured streambed elevations at each measurement point, comparison to computed scour depths, updated Item 113 rating if conditions have changed, recommendations for countermeasure repair or installation, and updated load rating if foundation capacity has been reduced. The post-flood inspection is a critical safety function — some of the most catastrophic bridge failures, including the 1987 Schoharie Creek Bridge (10 fatalities) and the 1993 Railroad Bridge failure at Rulo, Nebraska, occurred during or immediately after flood events where scour went undetected.
Climate change is increasing bridge scour risk through three primary mechanisms. Increased flood frequency and intensity — more frequent extreme precipitation events produce higher peak discharges and flow velocities. The NOAA Atlas 14 precipitation frequency estimates and the USGS Flood Frequency Analysis (Bulletin 17C) provide the hydrologic basis for design discharges. Climate projections from the Intergovernmental Panel on Climate Change (IPCC) CMIP6 models indicate that precipitation intensity is increasing across most of the United States, with the largest increases in the Northeast (20-30% increase in 100-year precipitation by 2070 under RCP 8.5), Midwest (15-25%), and Pacific Northwest (10-20%). These increases translate directly to higher peak discharges and scour demands on bridges.
Sea level rise in coastal areas raises base water levels, reducing the freeboard between the water surface and the bridge deck. Higher tailwater elevations reduce flow velocities at the bridge during lower flow events, but during high-flow events, the higher base level increases the energy slope and velocity through the bridge opening by reducing the backwater effect. SLR projections from the NOAA 2022 Sea Level Rise Technical Report project 0.6 to 2.2 feet of rise by 2050 and 1.0 to 7.0 feet by 2100 along US coastlines. Tidal bridges designed to historical tidal ranges will experience higher base water levels, increasing scour potential and reducing the effectiveness of riprap and other countermeasures. The USACE Sea-Level Change Curve Calculator provides site-specific projections for engineering design.
Changes in sediment transport regimes — altered hydrographs change the timing and magnitude of sediment delivery to river systems. More intense rainfall on burned watersheds (from increased wildfire frequency) generates debris flows that can suddenly deposit massive sediment loads at bridges, abruptly changing channel geometry and flow patterns. Conversely, upstream dam removals — such as the Klamath River dam removals (2023-2024) — release decades of stored sediment, causing rapid aggradation and degradation that affects downstream bridges. Channel instability from more frequent extreme floods can change channel planform from meandering to braided, redirecting flow toward previously protected abutments.
The FHWA Order of Magnitude Climate Risk and Vulnerability Assessment for Bridges recommends a phased approach: screening-level assessment using projected climate data, quantitative hydraulic modeling with climate-adjusted hydrology, and development of adaptation strategies. State DOTs including Washington (WSDOT), Oregon (ODOT), California (Caltrans), New York (NYSDOT), and Florida (FDOT) have developed climate adaptation guidance for bridges. The AASHTO Standard Specifications and FHWA HEC-18 are being updated to incorporate climate-adjusted hydrology into scour design — using projected 2070 to 2100 rainfall intensities with appropriate factors of safety. Bridges designed to the current 100-year flood standard (1% annual exceedance probability) may effectively face return periods of 50 years or less by mid-century under high-emission scenarios, representing a substantial increase in annual failure probability.
Scour emergency response is the organized protocol for managing bridges during and immediately after flood events when scour may compromise foundation stability. The protocol is defined in the Plan of Action (POA) for each scour critical bridge and must be coordinated with local emergency management agencies, law enforcement, and transportation operations centers.
The emergency response is triggered when one or more of the following conditions occurs: flood stage reaches or exceeds the predefined flood monitoring threshold defined in the POA, a fixed scour monitor detects scour at the alert or critical elevation, visual inspection during flood monitoring reveals rapid scour progression, debris accumulation against piers or abutments significantly alters flow patterns, or the bridge experiences observable settlement or lateral movement. During the event, monitoring frequency increases from routine (monthly or quarterly) to continuous or hourly monitoring. Flood watch personnel are deployed to the bridge site with communication equipment (satellite phones, two-way radios) and measurement instruments (portable sonar, GPS, cameras). Monitoring personnel observe the bridge at specified intervals (typically every 1 to 6 hours depending on flood severity) and report conditions to the Emergency Operations Center.
The bridge closure decision is the most critical element of emergency response. Closure criteria defined in the POA include: water surface elevation reaches the predefined closure stage, scour measurement reaches the critical elevation (typically the foundation bottom elevation), observed structure movement or settlement exceeds acceptable tolerances (typically 1:100 movement ratio), discharge exceeds the computed capacity of the bridge foundation, or debris accumulation threatens immediate overtopping or structural damage. The authority to close the bridge is vested in designated personnel — typically the state DOT Chief Bridge Engineer or Regional Bridge Engineer. Closure procedures include traffic control (portable message signs, barriers, law enforcement coordination), public notification (511 traffic information systems, local media, emergency alerts), and detour activation using pre-planned detour routes. All bridges on the detour route must be evaluated for scour vulnerability to ensure the detour does not divert traffic to an equally compromised structure.
Post-event re-opening requires an engineering evaluation demonstrating that the bridge is safe for traffic. Evaluation includes a complete post-flood scour inspection (sonar/probing measurement at each pier and abutment), comparison of measured scour to computed scour depths, structural evaluation of the foundation for the reduced embedment condition, geotechnical evaluation of bearing capacity and lateral stability, and countermeasure inspection and repair if damaged. The bridge is re-opened only when the responsible engineer confirms that the foundation has adequate capacity for the design loads. The criteria for re-opening are documented in the POA and typically require the flood to have receded below a specified stage plus a minimum safety margin.
Emergency repair materials are pre-staged at strategic locations for rapid deployment. Emergency countermeasure stockpiles include riprap (a minimum of 500 to 1,000 tons of graded stone per high-risk bridge), geotextile sand containers (pre-filled or deployable), steel sheet pile sections, and concrete precast blocks. Emergency response contractors are pre-qualified and under contract for rapid mobilization — typically required to be on site within 4 to 24 hours of notification. Post-event forensic investigations document failure mechanisms, evaluate countermeasure performance, and update design guidance. The NCHRP 20-68A (Bridge Scour Risk Management) provides a structured framework for statewide scour risk management programs including emergency response planning.
TarmacView provides comprehensive bridge scour evaluation services including HEC-18 analysis, NBI Item 113 classification, scour monitoring installation, post-flood inspection, and countermeasure design. Contact our team of experienced hydraulic and structural engineers.
Riprap is a layer of loose, angular stone or concrete blocks placed around bridge piers, abutments, and channel banks to armor the streambed against scour erosi...
Culvert inspection assesses structural condition (cracking, deformation, joint separation), hydraulic condition (blockage, sedimentation, scour), and material c...
The bridge deck is the uppermost structural element of a bridge, directly supporting traffic loads and providing the riding surface. Deck condition — cracking, ...