Map Cracking
Map cracking (also called crazing) is a network of shallow, fine, interconnected cracks on the concrete surface forming an irregular pattern. In FHWA LTPP, map ...
30 min read
Concrete Defects
Pavement Distress
+3
Shrinkage cracks are fine, often shallow cracks that form when concrete volume decreases during drying and curing. Plastic shrinkage occurs before setting; drying shrinkage occurs over months to years. While often not initially structural, shrinkage cracks can widen and allow moisture/chloride ingress. Covers types, prevention, and differentiation from structural cracking.
Shrinkage cracking is one of the most prevalent forms of cracking in concrete structures and pavements. It occurs when the volume of concrete decreases due to moisture loss, chemical reactions, or thermal changes, and the resulting tensile stresses exceed the concrete’s tensile strength. Unlike cracks caused by external structural loads, shrinkage cracks are fundamentally driven by internal volume changes inherent to the material itself.
The phenomenon is so widespread that the Portland Cement Association (PCA) estimates that over 90% of all concrete slabs develop some form of shrinkage cracking during their service life. This near-ubiquity does not mean shrinkage cracking can be dismissed; rather, it underscores the critical importance of understanding, predicting, and managing these cracks to ensure long-term durability and serviceability.
Concrete undergoes volume changes throughout its life, beginning within hours of placement and continuing for decades. These changes arise from multiple physical and chemical processes, each operating on different timescales. The four primary types of shrinkage — plastic shrinkage, drying shrinkage, autogenous shrinkage, and carbonation shrinkage — each have distinct mechanisms, timing, visual characteristics, and mitigation strategies.
This glossary article provides a comprehensive technical examination of shrinkage cracking in concrete, covering fundamental mechanisms, influencing factors, visual recognition, differentiation from structural cracking, durability implications, prevention methods, specialized considerations for airport pavements, modern AI-based detection techniques, and repair strategies. The goal is to equip civil engineers, pavement specialists, infrastructure managers, and construction professionals with the detailed knowledge needed to identify, prevent, and manage shrinkage cracking effectively.
The root cause of all shrinkage cracking is the same: concrete, like most cementitious materials, undergoes volumetric contraction as it hydrates, dries, and chemically evolves. When this contraction is restrained — by the subgrade, reinforcement, adjacent structural elements, or internal aggregate particles — tensile stresses develop. Because concrete has relatively low tensile strength (typically only 8–15% of its compressive strength), even modest restraint can produce cracking.
The relationship between shrinkage strain, restraint, and cracking can be expressed simply: if the restrained shrinkage strain εr exceeds the concrete’s tensile strain capacity εt, cracking will occur. The tensile strain capacity of normal-weight concrete is typically in the range of 100 to 200 microstrain (0.01–0.02%), while ultimate drying shrinkage strains commonly reach 400 to 800 microstrain (0.04–0.08%) — four to eight times the material’s cracking threshold. This large disparity explains why shrinkage cracking is so common and why active management through jointing, reinforcement, and mix design is essential.
The understanding of shrinkage cracking has evolved significantly since the early days of modern concrete construction. Early 20th-century engineers observed cracking in concrete pavements and structures but often misattributed it to poor materials or workmanship. The landmark research of Lynam in 1934 first systematically described the mechanisms of plastic shrinkage, while Powers and Brownyard in the 1940s laid the theoretical foundation for understanding drying shrinkage through capillary tension and disjoining pressure theories.
The post-World War II era of rapid highway and airport construction brought renewed focus on shrinkage cracking, as large-area concrete pavements proved particularly susceptible. The work of the PCA, the American Concrete Institute (ACI), and the Federal Aviation Administration (FAA) throughout the 1950s–1970s established the joint spacing guidelines, curing requirements, and mix design recommendations that remain the basis of modern practice.
Today, shrinkage cracking research continues, with particular emphasis on high-performance concrete (low water-cement ratio mixes), self-consolidating concrete, and the use of shrinkage-reducing admixtures (SRAs) . The growing use of concrete in critical infrastructure — airport runways, bridge decks, nuclear containment structures — demands ever more sophisticated understanding and control of shrinkage behavior.
Shrinkage cracking in concrete is not a single phenomenon but encompasses four distinct types, each driven by different mechanisms and occurring on different timescales. A comprehensive understanding requires familiarity with all four.
Plastic shrinkage cracking occurs in the first few hours after concrete placement, while the concrete is still in its plastic state — before final set. These cracks form when the rate of evaporation of water from the concrete surface exceeds the rate at which bleed water rises to the surface. Once the surface dries and begins to shrink while the underlying concrete remains plastic, tensile stresses develop in the surface layer, producing cracks.
Plastic shrinkage cracks typically appear within 30 minutes to 6 hours after placement, depending on environmental conditions. They develop before the concrete reaches its initial set and are therefore exclusively a fresh concrete phenomenon. The critical window is the period when bleed water has evaporated but the concrete has not yet gained sufficient strength to resist tensile stresses.
Key environmental risk factors include:
The nomograph developed by the PCA (and later incorporated into ACI 305R) provides a graphical method for estimating evaporation rate based on air temperature, concrete temperature, relative humidity, and wind velocity. When the evaporation rate exceeds 1.0 kg/m²/hr (0.2 lb/ft²/hr) , plastic shrinkage cracking risk is considered high, and preventive measures are required.
Plastic shrinkage cracks have distinctive visual features:
The mechanism involves a competition between bleeding (the upward movement of water in fresh concrete due to differential density) and evaporation. In properly designed and placed concrete, a thin layer of bleed water rises to the surface. This bleed water temporarily replaces water lost to evaporation, protecting the underlying concrete from drying.
When evaporation exceeds bleeding, the surface layer dries, contracts, and tensile stresses develop. Since the underlying concrete is still plastic and cannot provide significant restraint to the surface, the surface layer experiences a restrained shrinkage condition analogous to a thin drying layer on a non-shrinking substrate.
The critical role of finishing operations must also be noted. Over-finishing (especially over-troweling) can seal the surface, trapping bleed water below while the surface dries — a condition that can actually increase plastic shrinkage cracking risk. Additionally, finishing while bleed water is present can work water into the surface, increasing the surface water-cement ratio and making it more prone to shrinkage.
Drying shrinkage cracking is the most widely recognized form of shrinkage cracking. It results from the loss of physically adsorbed water from the cement paste matrix as concrete dries over extended periods. Unlike plastic shrinkage, drying shrinkage occurs in hardened concrete and continues for months to years after placement.
Drying shrinkage begins as soon as concrete is exposed to a drying environment, even during curing. The time development of drying shrinkage follows a roughly logarithmic pattern:
| Time Period | Proportion of Ultimate Shrinkage |
|---|---|
| First 7 days | 15–25% |
| First 28 days | 25–35% |
| First 3 months | 45–55% |
| First 6 months | 60–70% |
| First 12 months | 70–80% |
| First 2 years | 85–90% |
| 5+ years | 95–100% |
The ultimate drying shrinkage of concrete depends on numerous factors (discussed in Section 4) but typically falls in the range of 400–800 × 10⁻⁶ (0.04–0.08%) for normal-weight concrete. For lightweight aggregate concrete, ultimate shrinkage can be higher, typically 600–1000 × 10⁻⁶ (0.06–0.10%).
Drying shrinkage cracks present distinct visual features:
Drying shrinkage is fundamentally a pore water phenomenon. The cement paste contains a complex pore structure with pore sizes ranging from nanometers to micrometers. Water in these pores exists in several forms:
As concrete dries, water is progressively removed from larger pores first, then smaller ones. This removal generates capillary tension in the remaining pore water, which causes the pore walls to be pulled inward, resulting in overall contraction of the paste. Three primary mechanisms have been proposed:
Capillary Tension Theory (Powers, 1965): As water evaporates from capillary pores, menisci form at the liquid-vapor interface. The surface tension of water creates a negative pressure (capillary tension) in the pore liquid, given by the Kelvin-Laplace equation: ΔP = 2γ/r, where γ is the surface tension of water and r is the meniscus radius. This negative pressure effectively pulls the pore walls together, causing shrinkage. This mechanism dominates at relative humidities between 45% and 95%.
Disjoining Pressure Theory (Feldman and Sereda, 1968): Between the C-S-H layers, adsorbed water films exert a disjoining pressure that keeps the layers apart. When this water is removed during drying, the disjoining pressure decreases, allowing the C-S-H layers to move closer together. This mechanism is important at lower relative humidities (below 45%).
Surface Free Energy Theory: The removal of adsorbed water from solid surfaces increases the surface free energy of the solids, which in turn increases the surface tension of the solid particles, causing them to contract. This mechanism is significant at very low relative humidities (below 10–20%).
Autogenous shrinkage (also called chemical shrinkage or self-desiccation shrinkage) is a volume reduction that occurs in concrete without moisture loss to the environment. It results from the chemical reaction of cement with water — the hydration products occupy less volume than the original cement and water combined (Le Chatelier’s principle of volume reduction).
Autogenous shrinkage begins immediately after initial set and develops rapidly in the first 1–7 days, with most occurring within the first 28 days. In conventional concrete with water-cement ratios above 0.45, autogenous shrinkage is relatively small (less than 100 × 10⁻⁶ strain) because the capillary pores contain sufficient water to sustain hydration without creating significant internal drying.
However, in high-performance concrete (HPC) and ultra-high-performance concrete (UHPC) with water-cement ratios below 0.40, autogenous shrinkage becomes a major concern. In such mixes, the limited water supply is rapidly consumed by hydration, creating internal drying (self-desiccation) and significant capillary tension in the pore structure. Autogenous shrinkage strains in HPC can reach 200–400 × 10⁻⁶ or more, comparable to or exceeding drying shrinkage in some cases.
The mechanism of autogenous shrinkage is directly analogous to drying shrinkage, but the water loss is internal rather than external. As cement hydrates, the chemical reaction consumes water, reducing the internal relative humidity within the pore structure. This self-desiccation creates the same capillary tension effects as external drying, causing the paste to contract.
The key relationship is that 1 gram of cement requires approximately 0.25 grams of water for complete hydration (theoretically 0.23 g/g for C₃S, hydrating to C₁.₇SH₄). When the available water is insufficient to maintain saturated conditions in the capillary pores, the internal relative humidity drops, and autogenous shrinkage proceeds.
For water-cement ratios below 0.36, available water is theoretically insufficient for complete hydration, meaning the concrete will experience significant self-desiccation regardless of curing conditions. For w/c ratios between 0.36 and 0.45, the degree of self-desiccation depends on the rate of hydration versus the availability of external curing water.
Autogenous shrinkage is particularly challenging because it occurs during the early age when concrete has limited tensile strength and has not yet developed its full modulus of elasticity. This makes it especially prone to cracking.
Internal curing using pre-wetted lightweight aggregate or superabsorbent polymers (SAPs) has emerged as an effective mitigation strategy. By introducing internal water reservoirs that release water gradually during hydration, internal curing maintains internal relative humidity, reducing capillary tension and autogenous shrinkage. Research has shown that replacing 15–25% of normal-weight aggregate with pre-wetted lightweight aggregate can effectively eliminate autogenous shrinkage in HPC.
Carbonation shrinkage is a long-term volume change resulting from the chemical reaction between atmospheric carbon dioxide (CO₂) and hydration products in cement paste, primarily calcium hydroxide (Ca(OH)₂) and calcium silicate hydrate (C-S-H) . This reaction produces calcium carbonate (CaCO₃) and water, and is accompanied by a volume reduction of the solid phase.
Carbonation shrinkage is a very slow process, occurring over years to decades depending on the concrete’s permeability and exposure conditions. The depth of carbonation (the distance from the surface to which the carbonation front has penetrated) follows approximately a square-root-of-time relationship: d = k√t, where d is carbonation depth, k is a rate constant depending on concrete quality and exposure, and t is time.
Typical carbonation depths after 50 years in good-quality concrete (w/c = 0.45) might be 5–15 mm indoors and 10–25 mm outdoors sheltered from rain. In poor-quality concrete (w/c > 0.60), carbonation depths can exceed 50 mm within the same period.
The magnitude of carbonation shrinkage strain is typically 100–200 × 10⁻⁶ for fully carbonated paste, though it can be higher in some circumstances. This is significantly less than drying shrinkage but accumulates over much longer periods.
The primary carbonation reactions are:
Ca(OH)₂ + CO₂ → CaCO₃ + H₂O — this reaction releases water and causes an initial increase in solid volume (molar volume of CaCO₃ is approximately 11% greater than Ca(OH)₂), but this is associated with dissolution and reprecipitation that can cause local shrinkage.
C-S-H + CO₂ → CaCO₃ + SiO₂·nH₂O (silica gel) — the decalcification of C-S-H produces a silica gel with lower volume, contributing to overall shrinkage.
The net volume change from carbonation is complex and depends on the balance between the molar volume changes of the solid phases, the dissolution of calcium hydroxide, and the characteristics of the precipitated calcium carbonate. In practice, carbonation produces a surface layer that is denser (lower porosity) but also more brittle, often causing fine surface crazing or map cracking.
Carbonation shrinkage itself is rarely the sole cause of problematic cracking but can contribute to the widening and extension of existing drying shrinkage cracks over time. More importantly, carbonation reduces the pH of concrete from approximately 12.5–13.5 to below 9, which depassivates steel reinforcement and initiates corrosion — the leading cause of reinforced concrete deterioration worldwide.
The interaction between carbonation and cracking is bidirectional: cracks accelerate carbonation by providing direct pathways for CO₂ ingress, and carbonation-induced shrinkage can widen existing cracks, creating a positive feedback loop.
The capillary tension theory provides the most widely accepted explanation for drying shrinkage at relative humidities above approximately 45%. As water evaporates from capillary pores, air-water menisci form. The curvature of these menisci creates a negative hydrostatic pressure (tension) in the pore water, which can be calculated from the Kelvin-Laplace equation:
ΔP = 2γLVcosθ / r
Where:
This capillary tension can reach significant values. For a pore radius of 10 nm, the capillary tension is approximately 14.6 MPa — far exceeding the tensile strength of the cement paste. However, the actual stress transmitted to the solid skeleton depends on the degree of saturation and the pore structure geometry.
The relationship between pore radius and the relative humidity at which drying occurs is given by the Kelvin equation:
ln(RH/100) = −2γLVcosθ·M / (r·ρ·R·T)
Where:
For example, at 20°C, pores of radius 1.6 nm empty at about 45% RH, pores of 4 nm at about 75% RH, and pores of 16 nm at about 95% RH. This means that as concrete dries, smaller and smaller pores progressively empty, developing increasingly high capillary tension.
At relative humidities below 45%, capillary tension alone cannot explain continued shrinkage, as the menisci are no longer stable. Under these conditions, the disjoining pressure and surface free energy mechanisms dominate.
The development of capillary tension during drying is directly analogous to the mechanism of self-desiccation in autogenous shrinkage, where the consumption of water by hydration rather than evaporation creates the same negative pressure effect.
The disjoining pressure theory was developed by Feldman and Sereda (1968) and later refined by Wittmann (1973) and others. It addresses the behavior of water in the interlayer spaces of C-S-H, the primary hydration product of Portland cement.
C-S-H has a layered structure with interlayer spaces of approximately 1–3 nm. Water molecules are adsorbed onto the surfaces of these layers, forming a film. Between opposing surfaces, the adsorbed water films exert a disjoining pressure — a repulsive force that keeps the layers apart. This disjoining pressure has three components:
When water is removed from the interlayer spaces during drying (or during self-desiccation), the disjoining pressure decreases, allowing the C-S-H layers to approach each other, resulting in macroscopic shrinkage. The degree of shrinkage depends on the number of adsorbed water layers remaining:
| Number of Adsorbed Water Layers | Approximate Thickness | Relative Humidity Range |
|---|---|---|
| 5+ layers | >1.25 nm | >95% RH |
| 3-4 layers | 0.75–1.0 nm | 75–95% RH |
| 2 layers | ∼0.5 nm | 45–75% RH |
| 1 layer | ∼0.25 nm | 20–45% RH |
| Monolayer | ∼0.25 nm (partial) | <20% RH |
The disjoining pressure mechanism is reversible to a significant degree — when water is re-introduced (e.g., during wetting), adsorbed water films re-form, the disjoining pressure increases, and the C-S-H layers separate, causing swelling (the inverse of shrinkage). This reversibility explains the wetting-drying cycling behavior of concrete.
The mechanism of self-desiccation driving autogenous shrinkage is fundamentally similar to the capillary tension mechanism in drying shrinkage, but the water loss is internal — consumed by cement hydration rather than evaporated to the environment.
The chemical reaction of cement hydration is not volume-conservative:
Cement + Water → Hydration Products
The volume of hydration products is approximately 6–12% less than the combined volume of original cement and water. This chemical shrinkage creates empty pore space within the hardening paste. In saturated concrete (with access to external water), this empty space is filled by water drawn into the paste from the environment. In sealed concrete (no external water supply), the empty space remains, and the internal relative humidity drops.
The degree of self-desiccation depends primarily on the water-cement ratio:
| w/c Ratio | Internal RH After 28 Days (sealed) | Autogenous Shrinkage (×10⁻⁶) |
|---|---|---|
| 0.30 | ∼75% | 300–400 |
| 0.35 | ∼82% | 200–300 |
| 0.40 | ∼88% | 100–200 |
| 0.45 | ∼92% | 50–100 |
| 0.50 | ∼95% | 20–50 |
| 0.60 | ∼98% | <20 |
The internal RH reduction creates capillary tension in the pore water, identical to the mechanism described in Section 3.1. However, because this occurs in very early-age concrete (first hours to days), the paste has not yet fully developed its stiffness, making it particularly susceptible to volumetric contraction.
A critical implication is that autogenous shrinkage continues even with perfect external curing. If a concrete mix has a w/c ratio below 0.45, some degree of self-desiccation and autogenous shrinkage is inevitable regardless of how thoroughly the surface is moist-cured. This has led to the development of internal curing strategies (using pre-wetted lightweight aggregate or SAPs) specifically for low w/c ratio concretes.
Carbonation shrinkage results from the chemical reaction of CO₂ with cement hydration products. The reaction occurs in two primary stages:
Stage 1: Reaction with Calcium Hydroxide
Ca(OH)₂ + CO₂ → CaCO₃ + H₂O
This reaction is thermodynamically favorable and proceeds whenever CO₂ is present and moisture is available. Calcium hydroxide (portlandite) comprises approximately 20–25% of the volume of hydrated cement paste. The reaction consumes CO₂ from the atmosphere (or from dissolved CO₂ in pore water) and produces calcium carbonate.
The molar volume change in this reaction is complex:
The solid product occupies ∼11% more volume than the reactant. However, the reaction also dissolves Ca(OH)₂ in pore water and reprecipitates CaCO₃ in the pore space. The net effect on the pore structure depends on where the CaCO₃ precipitates — if it fills existing pores, the porosity decreases and the material densifies, but local shrinkage can still occur due to the dissolution-reprecipitation process.
Stage 2: Reaction with C-S-H
C-S-H + CO₂ → CaCO₃ + SiO₂·nH₂O (silica gel)
This reaction decalcifies the C-S-H, reducing its Ca/Si ratio and producing an amorphous silica gel. The decalcified C-S-H has a lower solid volume than the original, contributing to overall shrinkage. The silica gel is porous and has high surface area, which can itself undergo further shrinkage as it dries.
The rate of carbonation depends on:
Carbonation depth can be predicted using the simplified model:
d = K√t
Where K (the carbonation coefficient) ranges from approximately 2–15 mm/√year for typical concretes, depending on quality and exposure.
The magnitude and rate of shrinkage in concrete depend on numerous interrelated factors. Understanding these factors is essential for predicting shrinkage behavior and designing effective mitigation strategies.
Water content is the single most influential factor affecting drying shrinkage. All other factors being equal, an increase in mixing water content produces a proportional increase in shrinkage. This relationship exists because:
The relationship between water content and drying shrinkage is approximately linear. ACI 209R provides a correction factor for water content:
Where γw multiplies the ultimate shrinkage strain. For example, a concrete with 170 kg/m³ of water has γw = 0.85, while one with 230 kg/m³ has γw = 0.89.
The practical implication is clear: reducing mixing water is the most effective mix design strategy for reducing shrinkage. Modern concrete practice aims to minimize water content through:
Aggregates constitute 60–80% of concrete volume and play a critical role in controlling shrinkage. Since most normal-weight aggregates are dimensionally stable (they do not shrink significantly upon drying), they act as rigid inclusions that restrain the shrinkage of the cement paste.
The key parameter is aggregate volume concentration (Vagg). The relationship between aggregate content and concrete shrinkage follows approximately:
εc = εp × (1 − Vagg)n
Where:
This means that increasing the aggregate volume from 65% to 75% can reduce concrete shrinkage by approximately 30–40%. The practical range for coarse aggregate content in most structural concrete is 55–75% by volume.
Aggregate stiffness also matters. Aggregates with higher modulus of elasticity provide greater restraint. Quartzite and granite aggregates are more effective at restraining shrinkage than limestone, sandstone, or (especially) lightweight aggregates.
Aggregate type effects on relative shrinkage:
| Aggregate Type | Relative Concrete Shrinkage (at equal volume) |
|---|---|
| Quartzite | 0.60–0.70 |
| Granite | 0.65–0.75 |
| Limestone | 0.70–0.80 |
| Dolomite | 0.75–0.85 |
| Sandstone | 0.80–1.00 |
| Lightweight (expanded shale) | 1.00–1.40 |
Maximum aggregate size also plays a role: larger maximum aggregate size allows a higher aggregate volume fraction for a given workability, which reduces shrinkage.
The water-cement (w/c) ratio influences shrinkage through its effect on paste quality and porosity. For a given water content, a lower w/c ratio means higher cement content, which might seem counterintuitive for reducing shrinkage. However, the effect of w/c ratio on shrinkage is complex:
For drying shrinkage: At constant aggregate volume, a lower w/c ratio produces a denser paste with higher strength and stiffness, which reduces shrinkage magnitude. Lower w/c also means lower permeability, which slows the rate of drying.
For autogenous shrinkage: Below w/c ≈ 0.45, autogenous shrinkage increases rapidly as w/c decreases due to self-desiccation. Above w/c ≈ 0.45, autogenous shrinkage is minimal.
The net effect is that optimum w/c ratios for minimum total shrinkage are typically in the range of 0.40–0.50, balancing drying shrinkage reduction against autogenous shrinkage increase.
Different cement types exhibit different shrinkage behavior due to differences in chemical composition, fineness, and hydration kinetics.
| Cement Type | Relative Drying Shrinkage (28-day) |
|---|---|
| Type I (Ordinary Portland) | 1.00 (reference) |
| Type II (Moderate Sulfate Resistance) | 0.95–1.00 |
| Type III (High Early Strength) | 1.10–1.25 |
| Type IV (Low Heat) | 0.85–0.95 |
| Type V (High Sulfate Resistance) | 0.90–1.00 |
C3A content (tricalcium aluminate) is particularly influential. Higher C3A cement produces more ettringite during hydration, which has a higher water demand and can increase drying shrinkage. On the other hand, C3A also contributes to early strength development, which can help resist cracking.
Cement fineness affects shrinkage indirectly: finer cement hydrates faster, producing higher early-age autogenous shrinkage and requiring more careful early-age curing.
The use of SCMs — fly ash, slag cement, silica fume, metakaolin, and natural pozzolans — can significantly influence shrinkage behavior.
| SCM Type | Typical Replacement | Effect on Drying Shrinkage | Effect on Autogenous Shrinkage |
|---|---|---|---|
| Fly Ash (Class F) | 15–35% | Reduces (5–15%) | Reduces (dilution + slower reaction) |
| Fly Ash (Class C) | 15–30% | Minimal change | Minimal change |
| Slag Cement | 25–50% | Reduces (10–20%) | Increases at high replacement |
| Silica Fume | 5–15% | Increases (5–20%) | Increases significantly |
| Metakaolin | 8–15% | Variable (±10%) | Increases |
Fly ash generally reduces drying shrinkage because its slower hydration rate and spherical particle shape reduce water demand for a given workability. Slag cement at moderate replacement levels (25–50%) can reduce drying shrinkage through its lower porosity and refined pore structure. However, at high replacement levels (>60%), slag cement can increase autogenous shrinkage.
Silica fume presents a particular challenge: its extremely fine particles (100–150× finer than cement) improve packing and reduce bleeding, but they increase water demand and autogenous shrinkage significantly. Silica fume concretes require careful curing and often benefit from shrinkage-reducing admixtures or internal curing.
Environmental conditions during and after curing profoundly influence shrinkage:
Relative Humidity (RH) : The driving force for drying is the difference between the internal RH of the concrete (approximately 100% in fresh concrete, decreasing with age) and the ambient RH. Lower ambient RH increases both the rate and ultimate magnitude of drying shrinkage. ACI 209R provides a correction factor:
For example, concrete drying at 50% RH shrinks approximately 1.6× more than concrete at 90% RH (γRH = 0.90 vs. 0.50).
Temperature: Higher temperatures accelerate the rate of shrinkage by increasing the evaporation rate and accelerating cement hydration. However, the effect on ultimate shrinkage magnitude is relatively small. The temperature correction factor per ACI 209R is:
Wind: Wind increases the evaporation rate at the concrete surface, accelerating drying shrinkage in the surface layer. This is particularly critical for plastic shrinkage, where wind speeds above 15 km/h significantly increase cracking risk.
Drying from one face vs. multiple faces: A slab drying only from the top surface shrinks differently from a beam or column that dries from all sides. The differential drying through the thickness creates self-equilibrating stresses — the surface is in tension and the interior in compression — which can cause surface cracking even without external restraint.
The size and shape of a concrete member affect both the rate and distribution of shrinkage. This is quantified by the volume-to-surface ratio (V/S) or the effective thickness.
The relationship is captured by ACI 209R’s size correction factor:
For example:
Thinner members shrink more (and faster) because a larger proportion of the cross-section is within drying distance of the surface. Thicker members have a core that remains at high RH for extended periods, slowing the overall shrinkage rate.
Differential shrinkage through the thickness is also more significant in thicker members. The surface layer dries and shrinks while the interior remains moist, creating tensile stresses at the surface that can exceed the tensile strength, causing surface cracking.
Reinforcement provides passive restraint to shrinkage. Steel reinforcement does not shrink, so it restrains the shrinkage of the surrounding concrete, introducing tensile stresses in the concrete. This is why reinforced concrete members typically exhibit more crack lines but narrower crack widths than unreinforced members — the restraint creates more cracks at closer spacing, each with smaller opening.
The concept of critical reinforcement ratio (ρcrit) is important:
ρcrit = fct / (fy − n·fct)
Where:
When the reinforcement ratio exceeds ρcrit, the reinforcement can control cracking by ensuring that yielding does not occur before concrete cracking, allowing multiple cracks to form at the characteristic crack spacing rather than a single wide crack.
For typical structural concrete (fct = 3 MPa, fy = 500 MPa, n ≈ 8), ρcrit is approximately 0.6–0.8%. Below this value, a single crack may open widely; above it, multiple finer cracks form.
External restraint from foundations, adjacent structural elements, or subgrade friction also generates tensile stresses. The degree of restraint (R) ranges from 0 (free to shrink) to 1 (fully restrained). A typical slab-on-grade has R ≈ 0.3–0.6 due to subgrade friction, while a wall cast on a previously cast foundation slab may have R > 0.8 at the interface.
The visual appearance of shrinkage cracks provides valuable diagnostic information about their type, cause, and potential severity. Experienced inspectors can often determine the type of shrinkage and its likely cause through careful visual examination.
Plastic shrinkage cracks exhibit several characteristic patterns:
Parallel Diagonal Cracks: The most common pattern consists of cracks running approximately 45° to 90° to the direction of the prevailing wind. These cracks typically form at irregular intervals of 0.3–3.0 m (1–10 ft) apart and may extend from the slab edge toward the interior. In large slabs, they often form a herringbone pattern.
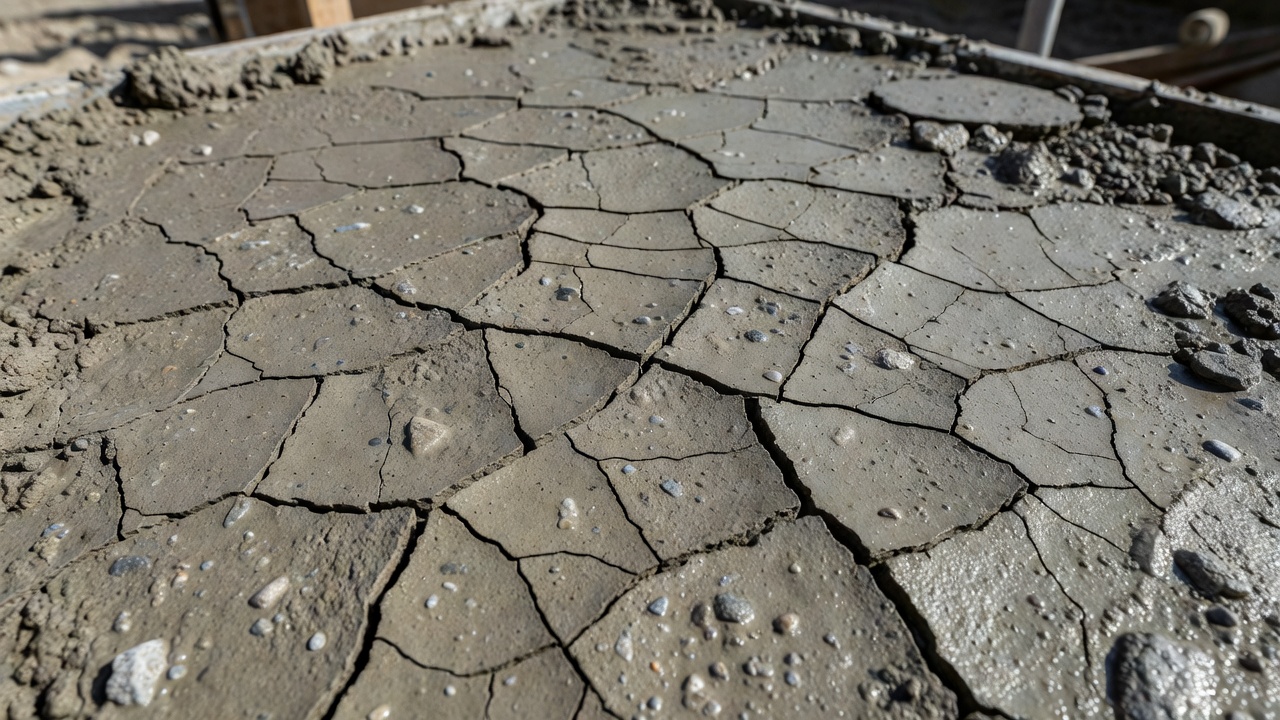
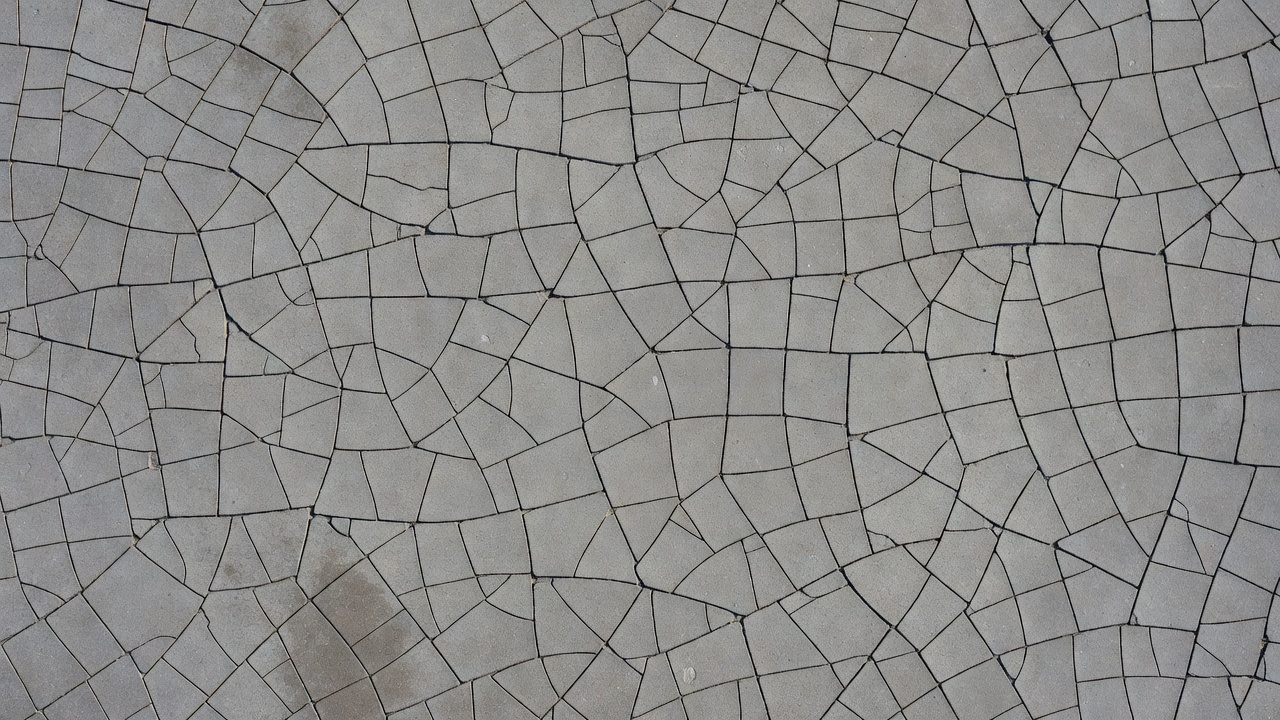
Map Cracking: A network of interconnected shallow cracks forming irregular polygons of 25–150 mm diameter. This pattern is common when the entire surface dries rapidly.
Crazing: Very fine surface cracks (typically <0.1 mm wide) forming a tight network. Crazing may not be visible until the surface is wetted or lightly abraded. It is often considered a cosmetic issue but can indicate a paste-rich surface layer prone to more significant cracking.
Settlement Cracks: These form around coarse aggregate particles or reinforcement bars near the surface, where differential settlement of the concrete creates local tensile stresses. They appear as fine cracks following the outline of the aggregate particle or rebar.
Drying shrinkage cracks in slabs typically follow predictable patterns determined by the restraint conditions and joint layout:
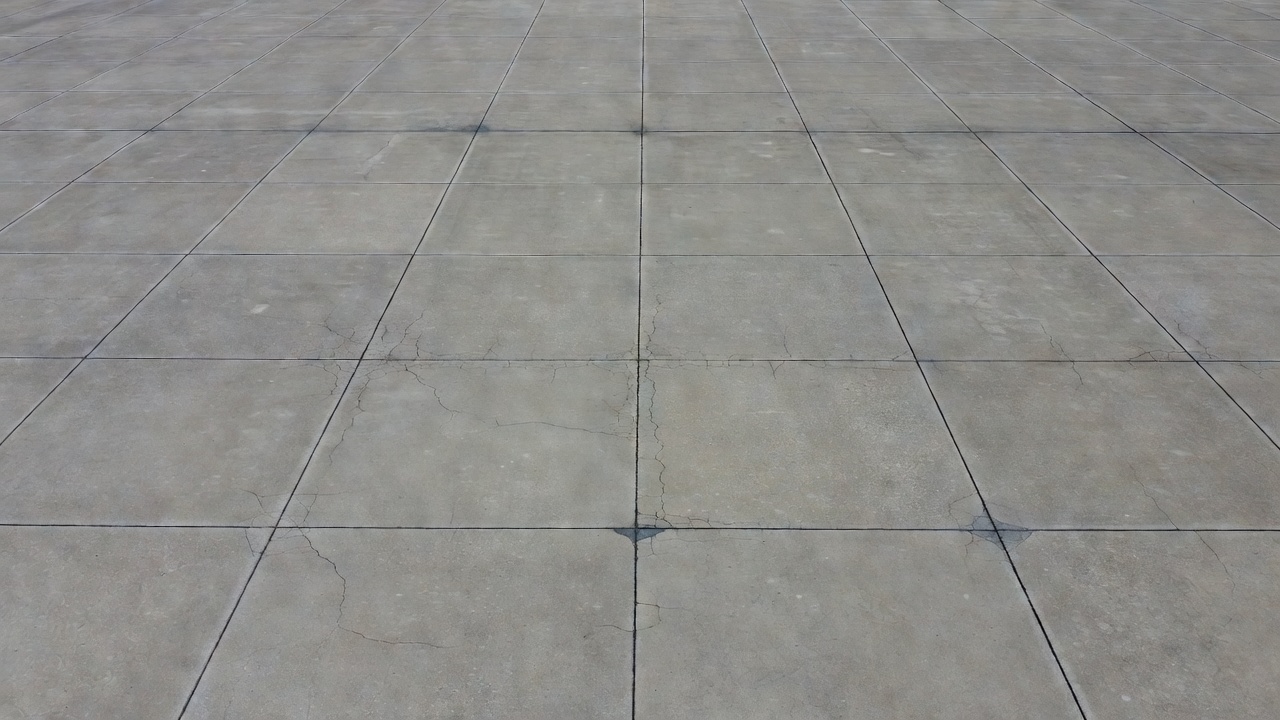
Mid-Panel Cracks: The most characteristic drying shrinkage crack in slabs occurs approximately at the midpoint between joints (or between a joint and an edge). This is where the tensile stress from restrained shrinkage is maximum. The crack typically runs roughly perpendicular to the long direction of the slab.
Corner Cracks: These propagate from the slab corner at approximately 45° to the edges. They result from the combination of shrinkage and curling (warping due to moisture gradients), with the slab corner being the most restrained point.
Map Cracking: In unrestrained or lightly restrained slabs — or in surface treatments such as toppings — drying shrinkage can produce a random map pattern. This is distinct from the fine crazing of plastic shrinkage because the cracks are typically deeper and wider.
Longitudinal Cracks: In slabs cast in long, narrow forms (such as pavement lanes), longitudinal cracks may form due to shrinkage in the transverse direction, often influenced by the differential restraint between the slab edges and center.
Crack Widths and Severity Classification: The following table provides a common severity classification for drying shrinkage cracks:
| Severity | Crack Width | Depth | Required Action |
|---|---|---|---|
| Fine (Cosmetic) | <0.1 mm | Surface only (<10 mm) | Observation; usually acceptable |
| Moderate | 0.1–0.3 mm | Partial depth (10–50 mm) | Consider sealing; monitor |
| Significant | 0.3–1.0 mm | Full depth or near full depth | Seal required; evaluate durability impact |
| Severe | 1.0–3.0 mm | Full depth | Structural assessment; repair required |
| Critical | >3.0 mm | Full depth with displacement | Structural investigation essential |
Autogenous shrinkage cracks are typically fine and uniformly distributed across the concrete surface. They may not be visible to the naked eye in the early stages, appearing only when the concrete is wetted or when more detailed inspection methods (e.g., dye penetration, microscopy) are used.
In high-performance concrete with high autogenous shrinkage, the cracks may form a uniform pattern of closely spaced (100–500 mm), very fine cracks. These can be particularly problematic because they occur at very early ages (1–3 days) when the concrete has not yet gained significant strength and before external curing measures can be effective.
Carbonation shrinkage appears as fine surface crazing — very shallow cracks forming a polygonal pattern on the concrete surface. The cracks are typically <0.1 mm wide and follow the distribution of paste on the surface, avoiding aggregate particles.
Carbonation cracking is often accompanied by a visible color change — the carbonated surface layer appears lighter than the interior concrete (closer to the natural color of limestone). This color change provides a useful field indicator: when a freshly broken surface shows a distinct lighter-colored outer layer, carbonation has occurred.
The depth of carbonation can be determined in the field using a phenolphthalein indicator solution. When sprayed onto a freshly broken concrete surface, the indicator turns pink (magenta) at pH > 9.0 (non-carbonated concrete) and remains colorless at pH < 9.0 (carbonated concrete). The depth of the colorless layer indicates the carbonation depth.
Correctly distinguishing shrinkage cracks from structural cracks is essential for appropriate repair decisions and structural assessment. Misdiagnosis can lead to either unnecessary structural repairs or dangerous underestimation of structural damage.
| Parameter | Shrinkage Cracks | Structural Cracks |
|---|---|---|
| Typical width | <0.3 mm (fine); can reach 3 mm | Variable: 0.3–5+ mm |
| Width variation | Uniform along length | Often varies (wider at one end) |
| Depth | Shallow (surface) to partial depth | Often full depth |
| Vertical displacement (lipping) | None or <1 mm | Common (1–10+ mm) |
| Crack pattern | Random (map, web, diagonal) | Follows stress patterns (moment, shear) |
| Orientation | Random or 45° to edges | Perpendicular to principal tension |
| Relation to joints | Mid-panel or between joints | At or near joints in structural cracks |
| Surface profile | Smooth, no aggregate fracturing | Rough, may show aggregate fracture |
| Timing of appearance | Hours to years after placement | Often after loading or events |
| Progression | Stabilizes over time | May progress with continued loading |
| Loading relation | No clear load relationship | Related to applied loads |
For field differentiation, engineers can apply a systematic diagnostic approach:
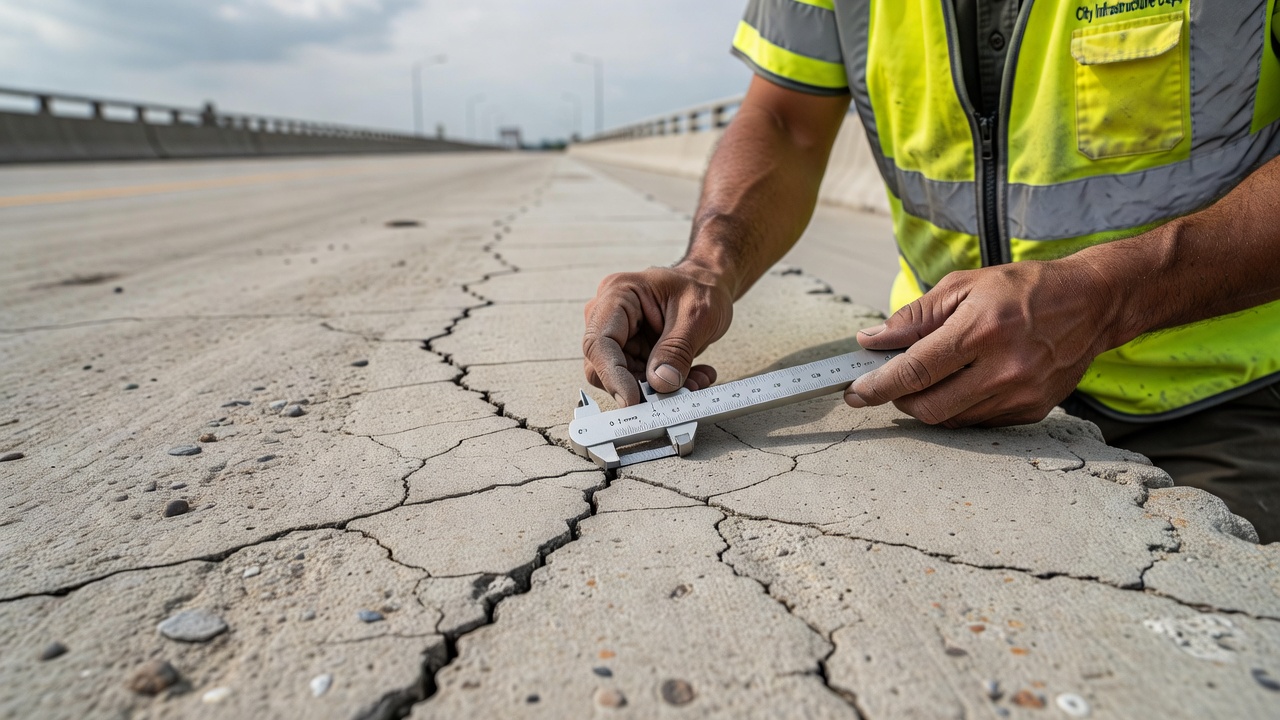
1. Width Measurement: Using a crack comparator card (a pocket card with printed lines of known widths) or a scale microscope (handheld 20–40× magnification with reticle). Measure width at multiple points along the crack and record the range and uniformity.
2. Depth Assessment: Using a thin feeler gauge or wire to probe depth. Alternatively, impact-echo (nondestructive) or coring (destructive) can determine depth. Shrinkage cracks are typically less than 25 mm deep in their early stages, though they can propagate deeper over time.
3. Vertical Offset (Lipping): Place a straightedge across the crack and measure the vertical displacement with a feeler gauge or tapered wedge. Any measurable vertical offset (lipping) suggests the crack is structural or has been subjected to differential movement.
4. Crack Mapping: Record the crack pattern on a scaled drawing. Shrinkage cracks in slabs should map between joints. If cracks extend through joints or are concentrated at points of known stress concentration (e.g., re-entrant corners, load application points), a structural cause should be suspected.
5. Load Testing: For critical cases, applying a proof load and monitoring crack opening can distinguish active structural cracks from stable shrinkage cracks. This is typically specified by a structural engineer and follows established protocols (e.g., ACI 437).
6. Long-Term Monitoring: Installing crack monitoring gauges (e.g., Demec points, tell-tales, or digital crack meters) and monitoring over 3–12 months. Shrinkage cracks generally stabilize (cease widening) after initial formation, while structural cracks may continue to widen.
When field diagnosis is inconclusive, petrographic examination (ASTM C856) of extracted core samples provides definitive differentiation. A trained petrographer examines thin sections of the concrete under a polarized light microscope and can identify:
While shrinkage cracks are often non-structural in their initial formation, their significance for long-term durability can be substantial. Cracks provide pathways for ingress of aggressive agents — water, chlorides, sulfates, CO₂ — that can initiate or accelerate deterioration mechanisms.
The American Concrete Institute (ACI) has established maximum permissible crack widths for various exposure conditions, primarily based on corrosion risk:
| Exposure Condition | Maximum Acceptable Crack Width |
|---|---|
| Dry air or protective membrane (interior) | 0.41 mm (0.016 in) |
| Humidity, moist air, soil | 0.30 mm (0.012 in) |
| Deicing chemicals | 0.18 mm (0.007 in) |
| Seawater, seawater spray (wet-dry cycling) | 0.15 mm (0.006 in) |
| Water-retaining structures | 0.10 mm (0.004 in) |
These thresholds are based on the concept that cracks below these widths are self-healing to some degree — they can become sealed by calcium carbonate precipitation from water flowing through the crack. Cracks above these widths remain open throughout the life of the structure.
Moisture ingress through shrinkage cracks is the first step in most deterioration processes. Even fine cracks (<0.1 mm) can permit significant water penetration under hydrostatic pressure or capillary action. The water flow rate through a crack increases approximately with the cube of the crack width (Hagen-Poiseuille type relationship), meaning a crack of 0.3 mm width transmits approximately 27× more water than a crack of 0.1 mm width under the same pressure gradient.
In reinforced concrete structures exposed to deicing salts or seawater, chloride-induced corrosion of reinforcement is the dominant deterioration mechanism. Chloride ions penetrate concrete through diffusion (through the intact paste) and through advection (flow through cracks).
The presence of cracks significantly accelerates chloride penetration. Research has shown that the apparent chloride diffusion coefficient can be increased by 2–10× in the cracked zone compared to uncracked concrete. The critical threshold for corrosion initiation (typically 0.05–0.10% chloride by weight of concrete at the reinforcement depth) can be reached much sooner in cracked sections.
The combination of crack width and spacing determines the extent of chloride-affected area. A single wide crack affects a narrow zone of steel directly beneath the crack, while many fine cracks affect a larger area but with less concentrated chloride ingress.
Once chlorides reach the reinforcement at concentrations exceeding the corrosion threshold, the protective passivation layer on the steel is destroyed, and active corrosion begins. The corrosion products (iron oxides and hydroxides) occupy 2–6× the volume of the original steel, generating expansive stresses that cause further cracking and spalling of the concrete cover — a positive feedback loop.
The time to corrosion initiation (ti) for cracked concrete can be estimated using:
ti = d² / (6 × Dapp)
Where d is cover depth and Dapp is the apparent chloride diffusion coefficient. For uncracked concrete with 50 mm cover and Dapp = 5 × 10⁻¹² m²/s, ti ≈ 10–15 years. For cracked concrete with the same cover but Dapp increased to 2 × 10⁻¹¹ m²/s, ti may be reduced to 2–3 years.
In cold climates, shrinkage cracks provide water reservoirs that can initiate and accelerate freeze-thaw damage. When water in the crack freezes, it expands by approximately 9% in volume, generating expansive stresses that tend to widen the crack. Repeated freeze-thaw cycles can progressively widen and deepen shrinkage cracks, leading to D-cracking (in coarse aggregate) or scaling (surface material loss).
The critical saturation concept is relevant here: concrete can tolerate freeze-thaw cycling without damage if the degree of saturation remains below approximately 85–90% of the total pore volume. Cracks, by providing direct water access, can locally increase the degree of saturation above this threshold.
Air-entrained concrete (with an appropriate air void system: spacing factor <0.2 mm, specific surface >25 mm⁻¹) provides resistance to freeze-thaw damage by providing empty air voids that accommodate ice expansion. However, cracks that intersect the surface can still provide pathways for water to bypass the protective air void system near the surface.
Prevention of shrinkage cracking requires a multi-faceted approach addressing materials, design, and construction practices simultaneously.
Proper curing is the single most important practice for preventing shrinkage cracking. Curing maintains concrete moisture content and temperature, allowing hydration to proceed and strength to develop before drying stresses become significant.
| Curing Method | Duration | Effectiveness | Typical Applications |
|---|---|---|---|
| Wet curing (ponding, fogging) | 7–14 days | Excellent | Slabs, pavements |
| Wet coverings (burlap, cotton mats) | 7–14 days | Good | General use |
| Curing compounds (liquid membrane) | Single application | Good to Fair | Large areas, vertical surfaces |
| Plastic sheeting | 7 days | Good (with care) | Slabs, walls |
| Steam curing | 12–24 hours | Excellent | Precast elements |
| Internal curing (LWA, SAPs) | Continuous | Excellent | Low w/c concretes |
ACI 308 recommends minimum curing periods based on concrete properties and exposure:
| Concrete Type | Minimum Curing Duration |
|---|---|
| Normal concrete (w/c > 0.45) | 7 days |
| Normal concrete (w/c < 0.45) | 7 days or until 70% strength |
| High-performance concrete (w/c < 0.40) | 7–14 days |
| Concrete exposed to freeze-thaw | 7–14 days |
| Concrete with SCMs (fly ash, slag) | 7–14 days |
Critical curing window: The first 24–48 hours after placement are the most critical for preventing plastic shrinkage. Surface evaporation must be controlled immediately after finishing, not after cracking has occurred.
Evaporation retarders: These are spray-applied liquids (typically monomolecular films of fatty alcohols) that reduce evaporation at the concrete surface. They are applied immediately after finishing and provide protection during the first critical hours before moist curing can begin.
Fiber reinforcement controls shrinkage cracking by providing three-dimensional distributed restraint that limits crack width more than it prevents crack formation. Fibers act at the microstructural level, bridging microcracks and reducing stress concentrations at crack tips.
| Fiber Type | Typical Dosage | Shrinkage Crack Reduction |
|---|---|---|
| Polypropylene (microfiber) | 0.6–1.2 kg/m³ (0.1–0.2% by volume) | 30–50% reduction in crack area |
| Polypropylene (macro fiber) | 3–6 kg/m³ (0.3–0.6% by volume) | 50–70% reduction |
| Steel fiber | 20–40 kg/m³ (0.25–0.50% by volume) | 20–40% reduction in crack width |
| Glass fiber (AR) | 1–3 kg/m³ | 30–50% reduction |
| PVA (polyvinyl alcohol) | 3–6 kg/m³ | 40–60% reduction |
| Carbon fiber | 1–3 kg/m³ | 50–70% reduction |
Mechanism: Fibers restrain crack opening through fiber bridging — as a crack begins to form, fibers spanning the crack transmit tensile stresses across it. The effectiveness depends on fiber-matrix bond strength, fiber modulus of elasticity, and fiber aspect ratio (length/diameter).
For plastic shrinkage, microfibers (6–12 mm length) are most effective because they are present in high numbers per unit volume and can interrupt the development of micro-cracks before they propagate. For drying shrinkage, macro fibers (30–60 mm) provide better performance by bridging larger crack openings.
Structural design considerations: Fiber reinforcement is not a substitute for structural reinforcement (rebar) in concrete designed to resist flexural or tensile loads. However, fibers can reduce the amount of conventional reinforcement needed for temperature and shrinkage control in slabs, as recognized by ACI 360 and other codes.
Proper joint spacing is the most important structural design measure for controlling drying shrinkage cracking in slabs. Joints provide predetermined planes of weakness where shrinkage cracks are expected and controlled. Without joints, cracks will form at random locations determined by variations in slab thickness, subgrade support, and material properties.
ACI 360 and PCA recommendations for joint spacing in slabs-on-ground:
| Slab Thickness | Maximum Joint Spacing |
|---|---|
| 100 mm (4 in) | 2.4–3.0 m (8–10 ft) |
| 125 mm (5 in) | 3.0–3.7 m (10–12 ft) |
| 150 mm (6 in) | 3.7–4.5 m (12–15 ft) |
| 200 mm (8 in) | 4.9–6.1 m (16–20 ft) |
| 250 mm (10 in) | 6.1–7.6 m (20–25 ft) |
| 300 mm (12 in) | 7.3–9.1 m (24–30 ft) |
The general rule of thumb: joint spacing (in feet) = 2 to 3 × slab thickness (in inches) . For metric: joint spacing (in meters) = 24 to 36 × slab thickness (in meters) .
Types of joints:
Contraction joints (also called control joints): Grooves cut or formed to a depth of 25–30% of the slab thickness. These create a weakened plane where shrinkage cracks form, producing clean, straight cracks at predetermined locations.
Isolation joints: Full-depth separation between the slab and adjacent structural elements (columns, walls, footings). These prevent restraint from adjacent elements and allow independent movement.
Construction joints: Planned joints between successive concrete placements. These are typically full depth and may include dowels to transfer load across the joint.
Expansion joints: Full-depth joints with a compressible filler, designed to accommodate expansion as well as contraction. Less commonly needed for shrinkage control (concrete typically contracts, not expands), but required at changes in direction, long runs, and connections to fixed structures.
Joint cutting timing: The timing of saw-cutting contraction joints is critical. Joints must be cut early enough to control cracking but late enough to avoid edge raveling (damage from the saw blade). General guidelines:
| Environment | Saw-Cut Timing After Placement |
|---|---|
| Hot weather (>30°C) | 4–8 hours |
| Moderate weather (20–30°C) | 6–12 hours |
| Cool weather (10–20°C) | 12–24 hours |
| Cold weather (<10°C) | 24–48 hours |
Early-entry saws (lightweight saws with small blades) allow cutting within 1–4 hours of finishing, providing better crack control in rapidly drying conditions.
Shrinkage-reducing admixtures are chemical admixtures that reduce drying shrinkage by reducing the surface tension of the pore water. By lowering the surface tension of water (from approximately 72 mN/m to 35–50 mN/m), SRAs reduce the capillary tension generated during drying, directly reducing the driving force for shrinkage.
Effectiveness: SRAs typically reduce drying shrinkage by 25–50% , with dosage-dependent performance. Typical dosage is 1–5% by weight of cement, depending on the product and desired reduction.
Benefits:
Limitations and considerations:
Combination with internal curing: The combination of SRAs with internal curing (pre-wetted LWA) has been shown to provide additive benefits, reducing both drying and autogenous shrinkage simultaneously.
Optimizing the concrete mix design for shrinkage resistance involves several interrelated strategies:
Maximize coarse aggregate volume: Increasing coarse aggregate from 55% to 70% of total volume can reduce shrinkage by 40–50%. This requires careful aggregate gradation optimization and may require adjusting the cement paste volume.
Reduce water content: Every 10 kg/m³ reduction in mixing water reduces drying shrinkage by approximately 3–5% . The use of high-range water reducers (superplasticizers) is essential for achieving low water content while maintaining workability.
Use moderately low w/c ratio: A w/c ratio of 0.40–0.45 provides a good balance between minimizing drying shrinkage and controlling autogenous shrinkage. For exposures requiring lower w/c ratios (<0.40), internal curing or SRAs should be specified.
Select low-shrinkage aggregates: Where available, use quartzite, granite, or limestone aggregates that provide high restraint. Avoid sandstones and lightweight aggregates in shrinkage-sensitive applications.
Use appropriate SCMs: Class F fly ash at 20–30% replacement or slag cement at 30–50% replacement can reduce drying shrinkage. Avoid or compensate for silica fume’s high autogenous shrinkage.
Limit cement paste volume: Paste volume should be the minimum required for workability and strength, typically 25–30% of total concrete volume for most applications.
While not a substitute for joints, properly designed structural reinforcement can control crack widths:
Minimum reinforcement for temperature and shrinkage in slabs per ACI 318:
ρmin = 0.0018 × (420/fy)
For Grade 60 (420 MPa) steel: ρmin = 0.0018. This translates to:
Placement within the slab: Shrinkage and temperature reinforcement should be placed at mid-depth for slabs on ground (to control cracking from both top and bottom). For slabs exposed to drying from one face only, reinforcement can be offset toward the drying face.
Airport concrete pavements represent a particularly demanding application for shrinkage crack control. The combination of large continuous areas (runways up to 4,000+ meters long), high joint density requirements, heavy aircraft loads, and strict operational tolerances (foreign object debris — FOD — from spalled concrete near cracks is a serious safety hazard) requires exceptional attention to shrinkage management.
Airport pavement design worldwide is governed by:
ICAO (International Civil Aviation Organization): Aerodrome Design Manual (Part 3 — Pavements) — provides general guidance on concrete pavement design, including joint spacing and construction practices.
FAA (Federal Aviation Administration): Advisory Circular 150/5320-6G — Airport Pavement Design and Evaluation — the primary US standard for airfield pavement design. Provides specific joint spacing requirements, mix design criteria, and construction standards.
ACI 325 — Guide for Design of Joints in Concrete Pavements (particularly relevant to airfield pavements).
ASTM standards for materials, testing, and construction quality control.
FAA standards specify that contraction joints in airport concrete pavements shall be spaced at intervals of 4.6 m (15 ft) maximum for slabs 250–400 mm (10–16 in) thick. This is more conservative than typical highway or industrial slab joint spacing.
The FAA’s Advisory Circular 150/5320-6G provides the following joint spacing guidelines:
| Pavement Thickness | Maximum Joint Spacing (Transverse) | Maximum Joint Spacing (Longitudinal) |
|---|---|---|
| 200–250 mm (8–10 in) | 4.6 m (15 ft) | 3.8 m (12.5 ft) |
| 250–300 mm (10–12 in) | 4.6 m (15 ft) | 3.8–4.6 m (12.5–15 ft) |
| 300–400 mm (12–16 in) | 4.6 m (15 ft) | 4.6 m (15 ft) |
| >400 mm (>16 in) | 6.1 m (20 ft) | 4.6 m (15 ft) |
The aspect ratio of individual slab panels (length/width) should not exceed 1.25:1. For example, a 4.6 m (15 ft) by 3.8 m (12.5 ft) panel has an aspect ratio of 1.2:1.
Joint design for airfield pavements includes:
Airport pavement construction requires specialized practices to minimize shrinkage cracking:
Concrete mix design: FAA-specified mixes for airfield pavements typically require:
Saw-cut timing: For airport pavements, saw cutting of contraction joints is particularly critical because:
Construction sequence: Airport runways are typically placed in longitudinal lanes (3.8–7.6 m or 12.5–25 ft wide, matching lane widths) with successive lanes cast adjacent to hardened lanes. Longitudinal construction joints between lanes include tie bars.
Curing: Airfield pavement curing is strictly specified:
Proper load transfer at joints is essential for airfield pavement performance. Without adequate load transfer, differential vertical movement at joints causes:
Load transfer mechanisms include:
For airfield pavements, doweled joints are standard for all transverse contraction joints on runways and major taxiways, as the heavy wheel loads and high traffic volume demand reliable load transfer.
Chemical resistance: Airport pavements are exposed to jet fuel, deicing fluids (ethylene glycol, propylene glycol), and hydraulic fluids. These chemicals can attack the concrete or joint sealants, potentially initiating deterioration at joints and cracks.
Thermal effects: Airport pavements experience significant thermal gradients due to solar exposure on large, unshaded surfaces. Daily temperature differentials between top and bottom of the slab can reach 15–25°C (27–45°F) , causing curling that can either open or close cracks and joints.
FOD safety: Spalled concrete at joints or cracks is a particular safety concern for aircraft operations. Any loose concrete fragment on the runway surface has the potential to be ingested into aircraft engines or damage propellers and airframes. This means crack maintenance in airfield pavements is not just a durability issue but a critical safety issue.
Artificial intelligence (AI), particularly deep learning and computer vision, has emerged as a powerful tool for automated crack detection and classification in concrete structures. These technologies are increasingly being deployed for infrastructure inspection, including detection of shrinkage cracking.
Convolutional Neural Networks (CNNs) are the foundation of most modern AI crack detection systems. CNNs learn to identify visual features — edges, textures, patterns — from training data and can classify image patches as “crack” or “no crack” with high accuracy.
Architecture approaches:
Patch-based classification: The input image is divided into small patches (e.g., 64×64 or 128×128 pixels), and each patch is classified. This approach is well-suited for mobile deployment with limited computational resources.
Semantic segmentation (pixel-level) : The network classifies every pixel in the input image, producing a crack map of the same dimensions as the input. Architectures such as U-Net, SegNet, and DeepLab are commonly used. This approach provides precise crack geometry (width, length, orientation) but requires more computational resources.
Region-based (object detection) : Approaches like Faster R-CNN or YOLO identify bounding boxes around crack regions. This is faster than semantic segmentation but provides less geometric detail.
Typical performance metrics for CNN-based crack detection:
| Metric | Typical Range |
|---|---|
| Accuracy | 95–99% |
| Precision | 90–98% |
| Recall | 88–97% |
| F1-Score | 89–97% |
| Mean IoU (segmentation) | 75–90% |
YOLO (You Only Look Once) is a family of object detection algorithms that provides real-time crack detection with a single forward pass through the network. YOLO has been increasingly adopted for infrastructure inspection due to its speed and reasonable accuracy.
YOLOv5, YOLOv8 applications for crack detection:
Training requirements:
Semantic segmentation is particularly valuable for shrinkage crack analysis because it provides quantitative crack parameters:
U-Net architecture for crack segmentation has become a standard approach:
Advanced architectures for improved crack detection:
| Architecture | Key Innovation | Performance Improvement |
|---|---|---|
| Attention U-Net | Attention gates to focus on crack regions | 3–5% IoU improvement |
| DeepCrack | Multi-scale feature fusion + CRF post-processing | End-to-end crack segmentation |
| FractureNet | Synthetic crack generation + adversarial training | Robust to varying lighting |
| CrackTransformer | Vision transformer with self-attention | Better long-range crack continuity |
For shrinkage crack detection specifically, semantic segmentation models can be trained to distinguish shrinkage cracks from other crack types by learning pattern features:
Unmanned Aerial Vehicles (UAVs, drones) equipped with high-resolution cameras and onboard AI processing are increasingly used for concrete crack inspection, particularly for large-scale infrastructure such as bridges, dams, and airport pavements.
UAV inspection workflow:
Resolution considerations:
UAV-specific challenges:
Generative Adversarial Networks (GANs) are being used to generate synthetic crack images for training data augmentation, addressing the chronic shortage of labeled crack datasets. StyleGAN and CycleGAN architectures can produce realistic crack images with controlled characteristics (width, pattern, lighting).
Transformer-based architectures (e.g., Vision Transformers, Swin Transformers) are achieving state-of-the-art results on crack segmentation benchmarks, particularly for capturing long-range spatial dependencies (important for connecting fragmented crack segments).
Few-shot learning approaches enable crack detection with as few as 10–50 labeled training images per crack type, leveraging meta-learning concepts. This is particularly valuable for specialized crack types (like specific types of shrinkage cracking) where large labeled datasets are not available.
Edge-AI deployment: Modern embedded systems (NVIDIA Jetson, Google Coral, Apple Neural Engine) enable on-device AI inference for real-time crack detection. This is critical for:
Multi-modal detection: Combining visual (camera) data with other sensing modalities for improved crack detection:
| Modality | Information Provided |
|---|---|
| Thermal infrared | Subsurface voids, moisture, delamination |
| LiDAR | 3D surface profile, deformation, faulting |
| Ground-penetrating radar | Subsurface defects, layer thickness |
| Acoustic (hammer sounding, impact echo) | Delamination, debonding |
| Ultrasonic | Crack depth, internal voids |
Not all shrinkage cracks require repair. The decision to repair depends on crack width, depth, location, exposure conditions, and the performance requirements of the structure.
The following decision matrix provides guidance on when shrinkage cracks should be sealed:
| Crack Width | Interior (Dry) | Exterior (Sheltered) | Exterior (Wet/Deicing) | Water-retaining |
|---|---|---|---|---|
| <0.1 mm | No action | No action | Monitor | Monitor |
| 0.1–0.3 mm | No action | Monitor | Seal | Seal |
| 0.3–1.0 mm | Monitor | Seal | Seal | Seal |
| 1.0–3.0 mm | Monitor/Seal | Seal | Seal + evaluate | Seal + evaluate |
| >3.0 mm | Evaluate structurally | Evaluate structurally | Evaluate structurally | Evaluate structurally |
Triggers for structural evaluation (regardless of crack width):
Epoxy injection is the primary repair method for structural cracks (cracks requiring restoration of tensile strength) and for cracks where watertightness is required.
Procedure:
Surface preparation: Clean crack faces (remove laitance, dirt, oil). Route out the crack at the surface to create a V-groove.
Port installation: Drill and install injection ports (entry nipples) at regular intervals along the crack — typically 100–300 mm (4–12 in) spacing, depending on crack width and epoxy viscosity.
Surface sealing: Seal the crack along its full length with a rapid-setting epoxy or polyester paste to prevent leakage during injection.
Epoxy injection: Inject low-viscosity epoxy at low pressure (300–700 kPa or 40–100 psi), starting from the lowest port and progressing upward. The epoxy penetrates the crack and bonds the crack faces. Injection continues until epoxy appears at adjacent ports.
Curing: Allow epoxy to cure per manufacturer specifications (typically 24–72 hours at 20°C, longer at lower temperatures).
Finishing: Remove surface seal and ports; grind or fill surface.
Epoxy selection criteria:
Limitations:
Routing and sealing is the standard repair method for non-structural cracks that require sealing for durability or appearance. It is simpler and less expensive than epoxy injection.
Procedure:
Route (chase) the crack: Using an angle grinder with a diamond blade or a specialized routing tool, cut a groove along the crack. Typical groove dimensions: 6–12 mm (1/4–1/2 in) wide by 6–12 mm (1/4–1/2 in) deep.
Clean the groove: Use compressed air, wire brush, or a combination to remove dust, debris, and loose material from the groove.
Install backer rod (for wider grooves): A compressible foam rod placed at the bottom of the groove to control sealant depth and shape.
Apply sealant: Fill the groove with an appropriate sealant:
Tool the sealant: Shape the sealant to ensure bond and proper profile.
Advantages:
Limitations:
In some cases, shrinkage cracking is so extensive or severe that partial or full replacement of the concrete element is the most cost-effective solution.
Indications for replacement:
Full-depth cracking at less than 1.5 m (5 ft) spacing over large areas — indicates fundamental problems with joint spacing, mix design, or construction that cannot be repaired economically.
Cracking with spalling (concrete breaking away at crack edges) — particularly problematic in pavements where FOD is a safety concern.
Cracks exceeding 3 mm width in large numbers (more than one per 10 m² or 100 ft²).
Cracks with corrosion — if rust staining is visible at multiple cracks, replacement of the affected area may be more economical than individual crack repairs.
Structural distress — if cracks have progressed to cause structural concerns (reduced capacity, excessive deflection, stability issues).
Failed repairs — if previous crack repairs have failed (re-opened, debonded, or adjacent cracking), more aggressive intervention is needed.
Replacement approaches:
| Approach | Applicability | Cost | Disruption |
|---|---|---|---|
| Full-depth slab replacement | Pavements with frequent cracking | High | High |
| Partial-depth repair (patching) | Isolated spalls/cracks | Moderate | Moderate |
| Overlay | Extensive surface cracking | Moderate | Moderate |
| Full reconstruction | Severely deteriorated pavements | Very high | Very high |
Partial-depth repairs (50–100 mm deep) can be effective for:
Full-depth repairs are indicated when:
Shrinkage cracking is an inherent characteristic of concrete that, while nearly universal in occurrence, can be effectively managed through proper design, materials selection, and construction practices. The four types — plastic, drying, autogenous, and carbonation — each have distinct mechanisms, timescales, visual characteristics, and mitigation strategies.
The key to successful shrinkage crack management lies in understanding that prevention is far more effective than repair. Joint spacing, curing practices, mix design optimization, fiber reinforcement, and shrinkage-reducing admixtures all play essential roles in minimizing shrinkage cracking. For the most demanding applications — such as airport concrete pavements — adherence to established standards (FAA AC 150/5320-6G, ICAO Aerodrome Design Manual) and the adoption of best practices in both design and construction are essential.
When cracking does occur, proper diagnosis is critical. Distinguishing shrinkage cracks from structural cracks through field observation, measurement, and, if necessary, petrographic examination ensures appropriate repair decisions. Not all shrinkage cracks require repair; the decision depends on crack width, exposure conditions, and performance requirements.
Emerging technologies — particularly AI-based crack detection using CNNs, YOLO, and semantic segmentation — are transforming infrastructure inspection by enabling automated, quantitative, and repeatable crack assessment. These technologies, deployed on UAVs and automated inspection vehicles, promise to improve the speed, accuracy, and consistency of crack detection across large infrastructure networks.
The future of shrinkage crack management lies in continued advances in materials science (low-shrinkage cementitious materials, internal curing, advanced SRAs), design methodology (performance-based crack control criteria), and inspection technology (AI, drones, multi-modal sensing). As concrete continues to be the world’s most widely used construction material, the importance of understanding and managing shrinkage cracking will only grow.
Final recommendations for practitioners:
Specify maximum water content and minimum aggregate volume in project specifications, not just minimum strength.
Design joint layouts as early in the project as possible, and ensure they are constructible.
Insist on adequate curing — 7 days minimum, with immediate application of curing measures after finishing.
Use crack width thresholds (ACI guidelines) to determine repair necessity, not arbitrary crack presence.
Document and monitor cracks from formation through service life, using consistent measurement methods.
Invest in training for field personnel on crack identification, measurement, and classification.
Consider SRAs and fiber reinforcement for crack-sensitive applications, accounting for their costs and benefits in life-cycle cost analysis.
For airport pavements, adhere strictly to FAA joint spacing requirements and consider internal curing or SRA use for long-life performance.
Adopt AI-based inspection for large infrastructure networks to enable systematic, quantitative crack assessment at regular intervals.
When in doubt, investigate — a small investment in petrographic examination or structural assessment can prevent costly misdiagnosis.
Optimize your concrete mix designs, joint spacing, and curing practices to minimize shrinkage cracking. Our experts provide guidance on preventing and managing shrinkage cracks in airport pavements, structures, and infrastructure.
Map cracking (also called crazing) is a network of shallow, fine, interconnected cracks on the concrete surface forming an irregular pattern. In FHWA LTPP, map ...
Freeze-thaw damage is the progressive deterioration of concrete caused by repeated cycles of water freezing and expanding within the concrete pore structure. Wi...
Concrete scaling is the deterioration of the upper pavement surface in Portland Cement Concrete (PCC) slabs, typically 3-13 mm deep, caused by freeze-thaw cycle...