Friction Testing
Friction testing is a critical airport maintenance process that measures the interaction between aircraft tires and runway pavement surfaces. This ensures safe ...
6 min read
Airport Maintenance
Runway Safety
+2
Skid resistance is the frictional force resisting tire sliding on a pavement surface, critical for safe braking and vehicle control — especially on wet runways. Governed by pavement microtexture and macrotexture, skid resistance is measured by locked-wheel testers, continuous friction measuring equipment (CFME), and British pendulum testers. Covers ICAO friction requirements, measurement standards, texture relationships, and AI-based proxy assessment.
Skid resistance is defined as the force developed when a tire that is prevented from rotating slides along a pavement surface, expressed as a dimensionless friction coefficient (μ) or as a Skid Number (SN = μ × 100). This frictional force is the single most critical pavement surface property governing the ability of an aircraft — or any vehicle — to brake, accelerate, and maintain directional control. On airport runways, skid resistance directly translates into stopping distance, and every meter of additional stopping distance during a rejected takeoff or landing overrun can be the difference between a safe outcome and a catastrophic runway excursion.
The physics of skid resistance operates at the tire-pavement contact patch, an area roughly the size of a human handprint for each aircraft tire. Within this small contact zone, forces of 100 kN or more are transmitted during heavy braking. The available friction is determined not by a single property but by a complex interaction of two distinct pavement texture scales — microtexture and macrotexture — operating simultaneously with the viscoelastic properties of the tire rubber compound, the presence of any interfacial fluids (water, snow, slush, rubber deposits), vehicle speed, tire slip ratio, and normal load.
Runway excursions — where aircraft depart the paved surface laterally or overrun the runway end — remain among the most frequent and severe categories of aviation accidents. Analysis by the International Air Transport Association (IATA) and the Flight Safety Foundation consistently identifies inadequate runway surface friction as a contributing or causal factor in a significant proportion of these events. The fatal overrun of Southwest Airlines Flight 1248 at Chicago Midway Airport in 2005, the Air France Flight 358 overrun at Toronto Pearson in 2005, and numerous other incidents have driven the international aviation community to strengthen friction measurement, reporting, and maintenance standards through the ICAO Global Reporting Format (GRF) and associated regulatory frameworks.
Beyond the immediate safety imperative, skid resistance is also an economic concern for airport operators. Premature pavement rehabilitation, increased maintenance frequencies, operational restrictions during wet weather, and liability exposure all stem from inadequate friction management. A comprehensive skid resistance management program — encompassing regular measurement, trend analysis, preventive maintenance, and timely corrective surface treatments — is an essential component of modern airport asset management.

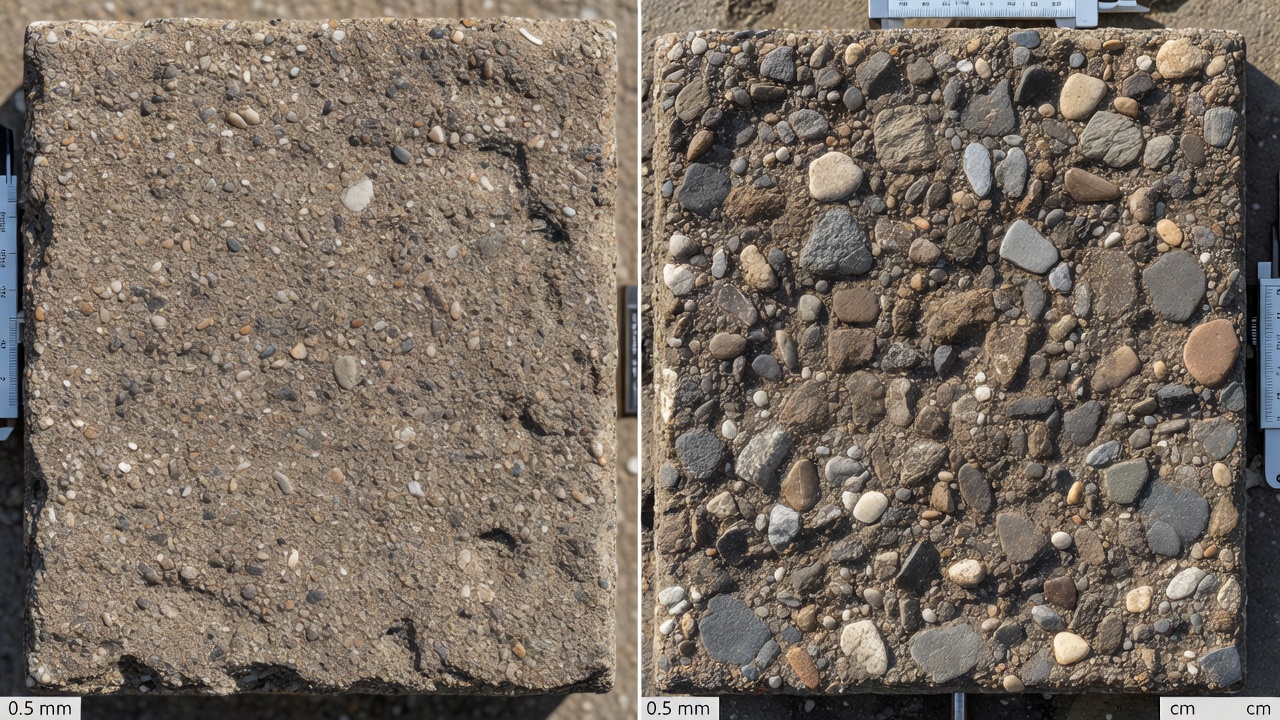
Skid resistance does not arise from a single texture property but from two distinct and complementary scales of pavement surface roughness: microtexture and macrotexture. Understanding the independent and interactive contributions of each is fundamental to interpreting friction measurements, diagnosing friction loss, and selecting appropriate surface treatments.
Microtexture describes the fine-scale roughness of individual aggregate particles — the microscopic asperities on the surface of each stone in the pavement matrix. These asperities interact directly with the tire rubber at the molecular level, penetrating the thin residual water film that persists even on a wet surface. Microtexture provides what is termed adhesive friction — the actual molecular bonding and hysteresis losses within the rubber as it deforms around individual aggregate protrusions.
Microtexture is the dominant friction mechanism at low speeds (below approximately 40–65 km/h) because at these speeds there is sufficient time for the tire rubber to deform into and around the microscopic surface features. It is also the mechanism measured by low-speed devices such as the British Pendulum Tester. Aggregate mineralogy is the primary determinant of microtexture: hard, angular, fine-crystalline aggregates such as granite, basalt, and calcined bauxite retain their microtexture far longer than softer, more readily polished materials such as limestone or dolomite. The Polished Stone Value (PSV) test, standardized in BS EN 1097-8, directly quantifies an aggregate’s resistance to microtexture loss through traffic polishing.
Macrotexture describes the larger-scale surface relief created by the arrangement, size, and spacing of aggregate particles protruding from the binder. Unlike microtexture, which operates at the rubber-to-stone contact, macrotexture primarily functions as a drainage system. The interconnected void network between aggregate particles provides escape channels through which water trapped under the tire contact patch can be expelled. Without adequate macrotexture, water becomes pressurized within the tire-pavement interface, eventually lifting the tire off the surface — the phenomenon known as hydroplaning.
Macrotexture also contributes to friction through hysteresis — the energy lost as tire rubber cyclically deforms around larger surface protrusions. This hysteresis component becomes increasingly important as speed increases, exactly when adhesive friction from microtexture diminishes. The net result is that pavements with high macrotexture maintain their skid resistance as speed increases (a flat friction-speed gradient), while pavements with low macrotexture experience a sharp decline in friction with increasing speed — a profile that can rapidly transition into full hydroplaning.
The standard field measure of macrotexture is the Mean Texture Depth (MTD) determined by the sand patch test (ASTM E965) or the Mean Profile Depth (MPD) measured by laser profilometers (ASTM E1845). ICAO Annex 14 recommends a minimum average texture depth of 1.0 mm for new runway surfaces. The FAA similarly requires a minimum of 1.0 mm (0.04 inches) texture depth for grooved or porous friction course surfaces. Typical MTD values for dense-graded asphalt runways range from 0.4 mm to 0.8 mm, while open-graded porous friction courses commonly achieve 1.2 mm to 2.5 mm.
The combined behavior of microtexture and macrotexture across the speed spectrum explains why a runway can pass low-speed friction tests yet still be hazardous for landing aircraft. A polished pavement with adequate macrotexture may show acceptable BPN values at pendulum test speed (~10 km/h equivalent) but dangerous friction at aircraft landing speeds (130–280 km/h). Conversely, a pavement with aggressive microtexture but insufficient macrotexture may perform acceptably at moderate speeds but fail catastrophically if standing water is present. Comprehensive friction evaluation therefore requires measurement at both macrotexture and microtexture scales, ideally supplemented with friction-speed gradient data from devices such as the Dynamic Friction Tester.
The measurement of skid resistance spans a range of devices and test configurations, each designed to isolate or combine different aspects of the tire-pavement friction interaction. The four principal methodologies are detailed below.
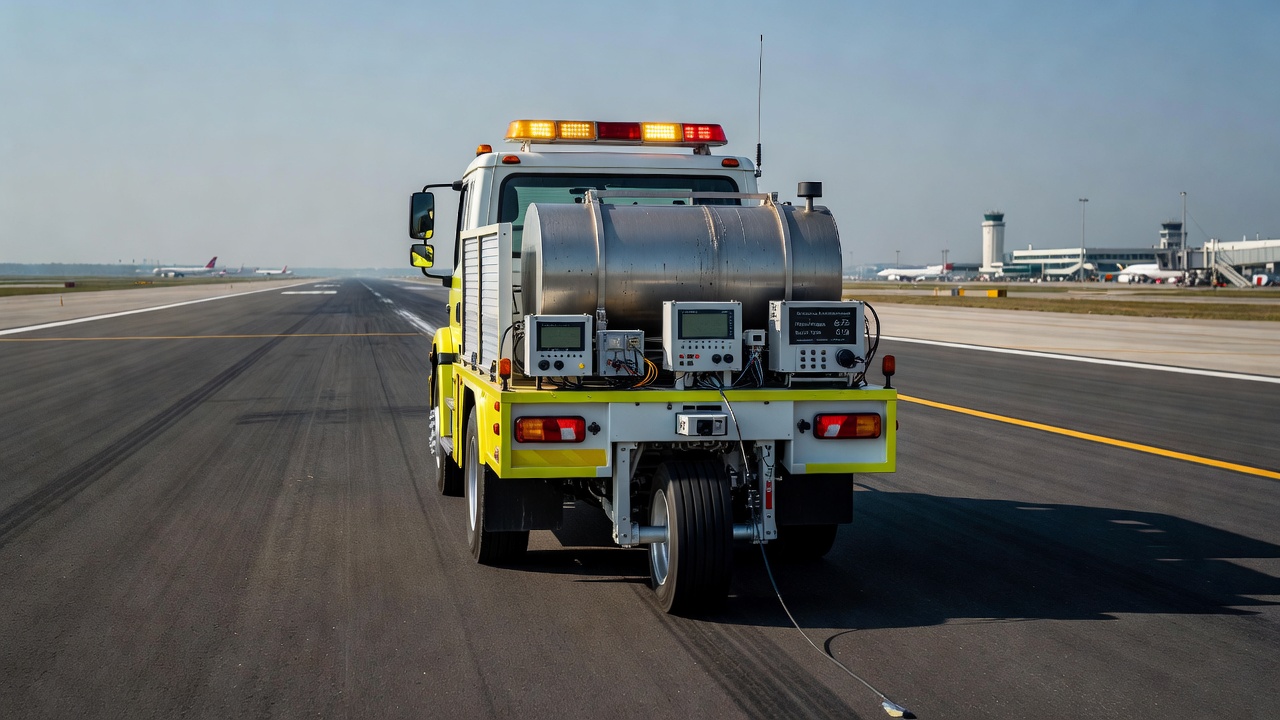
The locked-wheel tester is the reference friction measurement device for highway and airport applications in North America. The system consists of a trailer or vehicle-mounted test wheel that is mechanically locked to prevent rotation and dragged along a wetted pavement surface at a controlled speed — typically 64 km/h (40 mph) for highway testing and 96 km/h (60 mph) for airport runway testing. A standardized test tire — either the ribbed ASTM E501 tire (G78-15) or the smooth ASTM E524 tire — is pressed against the pavement under a known vertical load while a water delivery system applies a controlled film of water (0.5 mm to 0.8 mm thickness) ahead of the test tire at a rate of approximately 750 to 1,900 liters per test run.
The instrument measures the horizontal drag force required to pull the locked tire, and the friction coefficient is calculated as the ratio of this tractive force to the vertical normal load. The result is reported as the Skid Number (SN), defined as SN = 100 × μ. A fully locked wheel represents a 100% slip ratio — the worst-case braking scenario — and the measured friction thus represents the minimum available friction for anti-skid braking systems that may cycle near full lock-up.
The locked-wheel method directly measures sliding friction at a fixed speed, providing a single data point per test run. Multiple runs at different speeds can characterize the friction-speed gradient. The primary limitations are that the test is destructive to the pavement surface over repeated testing, the water consumption is high, and the test represents only the full-lock condition rather than the peak friction at the critical slip ratio (typically 10–20% slip).
CFME encompasses a family of self-contained friction measurement devices that continuously record friction along the full length of a runway at operational speeds, typically 65 km/h to 96 km/h. Rather than the fully locked wheel, CFME devices employ a fixed-slip measurement principle: a freely rotating measurement wheel is braked or angled to maintain a constant slip ratio (typically 10–20%) that approximates the peak of the friction-slip curve — the condition where most anti-skid braking systems operate.
The principal CFME device types recognized by ICAO Annex 14, Attachment A, include:
Each CFME type produces its own friction index (Mu, GN, SFC, etc.), and ICAO provides a standardized table correlating these device-specific readings to the ICAO friction scale. This device-specific correlation is necessary because each CFME type interacts differently with the pavement due to differences in tire compound, tread pattern, slip ratio, water film thickness, and measurement speed.
The Dynamic Friction Tester is a portable, discretely-positioned device that measures the friction-speed relationship at a single point on the pavement surface. The DFT consists of a horizontal spinning disk with three rubber slider pads on its underside. The disk is rotated at a tangential speed of approximately 90 km/h, then lowered onto the wetted pavement surface. As the disk decelerates due to friction, the torque and rotational speed are continuously recorded, producing a friction coefficient as a function of sliding speed from approximately 90 km/h down to 0 km/h.
The key output of the DFT is the friction-speed curve, typically summarized by two parameters: DFT20 — the friction coefficient measured at 20 km/h, which serves as a proxy for low-speed microtexture-dominated friction — and the speed gradient, which describes how quickly friction decreases with increasing speed. The DFT is often paired with the Circular Texture Meter (CTM) which measures the Mean Profile Depth (MPD) at the same test location. Together, the DFT and CTM data can be used to compute the International Friction Index (IFI) — a standardized parameter that harmonizes friction measurements across different devices.
The IFI is reported as a pair of values: F60 (the estimated friction coefficient at 60 km/h using a standard smooth tire) and Sp (the speed constant, a measure of the friction-speed gradient). ASTM E1960 provides the standard calculation procedure for the IFI from DFT and MPD measurements. The IFI framework enables meaningful comparison of friction data collected by different devices at different speeds — a significant advance for airport operators managing data from multiple CFME types across a fleet of runways.
The British Pendulum Tester is the oldest and most widely deployed portable friction measurement device, providing low-speed spot measurements at approximately 10 km/h equivalent sliding speed. The BPT consists of a pendulum arm with a standardized rubber slider mounted at its foot. The pendulum is released from a horizontal position, and the slider sweeps across a wetted pavement surface over a fixed contact length of 126 mm. The energy lost to friction is measured by the height to which the pendulum swings past the contact point, displayed on a calibrated scale as the British Pendulum Number (BPN) or Pendulum Test Value (PTV).
The BPN scale ranges from 0 (complete loss of energy — zero friction) to approximately 150 (theoretical maximum). For runway surfaces, BPN values above 45–50 are typical for new or well-maintained surfaces. Values below 35 indicate significant friction loss requiring investigation and potential corrective action. The BPT is specified for friction testing of pedestrian surfaces (BS 7976, UK Slip Resistance Group guidelines), road markings, and as a complement to CFME testing on runways. Its primary advantages are portability, low cost, and direct correlation to low-speed skid resistance; its primary limitation is that it cannot characterize the macrotexture-dependent high-speed friction performance critical for aircraft operations.
The Skid Number (SN) is the output of the locked-wheel tester (ASTM E274) and is defined as:
SN = 100 × μ
where μ is the dimensionless coefficient of friction — the ratio of the horizontal tractive force to the vertical normal load. An SN of 40 thus corresponds to a friction coefficient of μ = 0.40. The Skid Number is always reported with an associated test speed, conventionally appended as a subscript — for example, SN₄₀ indicates a skid number measured at 40 mph (64 km/h), and SN₆₅R indicates a measurement using a ribbed tire at 65 km/h.
The friction coefficient (Mu, μ) is the more universal parameter used across CFME devices, DFT measurements, and international standards. However, it is critical to understand that the Mu value reported by a CFME is device-specific — a Mu of 0.50 from a GripTester is not directly equivalent to a Mu of 0.50 from a Mu-Meter or an SN of 50 from a locked-wheel tester. Each device has its own calibration relationship to the ICAO reference friction scale.
The ICAO-recommended friction values by CFME type, as published in Annex 14, Attachment A, Table A-2, establish three threshold levels:
| Friction Level | GripTester (GN, 65 km/h) | Mu-Meter (Mu, 65 km/h) | Runway Friction Tester (Mu, 96 km/h) | Skiddometer BV-11 (Mu, 96 km/h) | Surface Friction Tester (Mu, 96 km/h) |
|---|---|---|---|---|---|
| Design Objective (new surface) | 0.74 | 0.72 | 0.82 | 0.74 | 0.72 |
| Maintenance Planning | 0.53 | 0.52 | 0.60 | 0.52 | 0.50 |
| Minimum Friction | 0.43 | 0.42 | 0.50 | 0.41 | 0.42 |
For the FAA locked-wheel tester (ASTM E274) using a ribbed tire at 65 km/h, the corresponding thresholds are approximately: Design Objective SN of 60–74, Maintenance Planning SN of 50–53, and Minimum SN of 40–43. For a smooth tire at 96 km/h (airport testing speed), the Minimum SN is approximately 40.
It is worth emphasizing that with the introduction of the ICAO Global Reporting Format (GRF) effective November 2020, the operational use of raw Mu values for pilot braking action decisions has been deprecated. Instead, the Runway Condition Assessment Matrix (RCAM) uses the Runway Condition Code (RWYCC) as the primary communication tool between airport operators and flight crews. Friction measurements continue to serve as essential inputs to the runway maintenance program and as one of several data sources informing the RWYCC assignment, but they are no longer directly reported to pilots as standalone operational friction coefficients.
ICAO Annex 14, Volume I — Aerodrome Design and Operations, addresses runway surface friction characteristics in Chapter 10 (Aerodrome Maintenance) and in Attachment A (Guidance on Determining and Expressing Friction Characteristics). The regulatory framework establishes a three-tier friction hierarchy:
This is the friction level that a new or resurfaced runway should achieve. It represents the friction expected from a well-designed, properly constructed pavement surface with high-quality aggregates and adequate macrotexture. The Design Objective varies by CFME device type, as shown in the table in Section 4 above, but typically falls in the range of μ = 0.72–0.82 (or SN = 60–74).
When friction measurements fall below the Maintenance Planning Level, the airport operator is required to plan and schedule corrective maintenance action. This is not an immediate operational restriction but rather a trigger for the pavement management system. The operator must investigate the cause of friction loss (e.g., aggregate polishing, rubber accumulation, binder flush), determine the most appropriate corrective treatment, and schedule the work within a timeframe commensurate with the severity and trend of friction deterioration. Typical Maintenance Planning Levels range from μ = 0.50 to 0.60 (SN = 43–53), depending on the CFME type.
The Minimum Friction Level is the regulatory threshold below which the runway is considered to have unacceptably low friction, requiring immediate corrective action. If friction falls below this level and cannot be restored through immediate maintenance, the airport operator must issue a NOTAM and may need to impose operational restrictions or close the runway until friction is restored. Typical Minimum Friction Levels range from μ = 0.41 to 0.50 (SN = 40–43), varying by device.
ICAO Doc 9981 — Aerodromes (PANS-Aerodromes) provides additional procedures for the assessment, measurement, and reporting of runway surface conditions, including detailed friction survey protocols, calibration requirements, and data recording standards. Under the Global Reporting Format (GRF), Doc 9981 specifies that:
The FAA Advisory Circular AC 150/5320-12C (and the subsequent Draft AC 150/5320-12D) provides the U.S. regulatory framework for the measurement, construction, and maintenance of skid-resistant airport pavement surfaces. The AC applies to all airports certificated under 14 CFR Part 139 and is also recommended for other airports serving turbine-powered aircraft.
Key provisions of AC 150/5320-12 include:
Friction Survey Frequency: The required frequency of runway friction surveys is determined by the number of daily turbojet aircraft operations:
| Daily Turbojet Operations | Minimum Survey Frequency |
|---|---|
| Less than 15 | Once per year |
| 16 to 30 | Twice per year |
| 31 to 90 | Once per quarter |
| 91 to 150 | Once per month |
| 151 to 210 | Twice per month |
| More than 210 | Once per week |
Minimum Friction Levels: The AC establishes that a minimum friction level of μ = 0.50 (SN = 50) at 65 km/h (40 mph) using a ribbed tire, or μ = 0.40 (SN = 40) at 96 km/h (60 mph) using a smooth tire, must be maintained. Measurements below these values trigger mandatory corrective action.
Measurement Equipment: The AC approves the use of CFME meeting FAA specifications, the locked-wheel skid trailer (ASTM E274), and supplementary devices including the DFT and BPT.
Surface Treatments: The AC mandates runway grooving for all new runways serving turbojet aircraft where the design objective for wet pavement friction cannot be achieved through aggregate selection alone. Grooving dimensions are specified as 6 mm × 6 mm (¼ inch × ¼ inch) at 32 mm (1¼ inch) center-to-center spacing for the central portion of the runway.
Corrective Action Hierarchy: When friction falls below minimum levels, the recommended corrective actions proceed from least to most invasive: (1) rubber removal using high-pressure water or chemical means, (2) surface retexturing (shot blasting, diamond grinding), (3) application of a thin friction course overlay, (4) full pavement rehabilitation.
Hydroplaning — also termed aquaplaning — is the complete separation of the tire from the pavement surface by a layer of water, resulting in a near-total loss of skid resistance. Three distinct mechanisms of hydroplaning are recognized in aviation:
Dynamic hydroplaning occurs when a wedge of water builds up at the leading edge of the tire contact patch and, at sufficient speed, lifts the tire completely off the pavement. The speed at which dynamic hydroplaning begins was characterized by NASA research (Horne and Dreher, 1963) and is given by the well-known formula:
Vp = 9 × √P
where Vp is the minimum dynamic hydroplaning speed in knots and P is the tire inflation pressure in pounds per square inch (PSI). For a typical commercial aircraft main gear tire inflated to 200 PSI, Vp = 9 × √200 = 9 × 14.14 ≈ 127 knots. For a general aviation aircraft tire at 50 PSI, Vp ≈ 64 knots.
This formula assumes a smooth tire, a smooth pavement surface, and standing water depth equal to or exceeding the tread depth. In practice, pavement macrotexture, tire tread pattern, and water depth all modify the onset speed. On a grooved runway with good macrotexture, dynamic hydroplaning may be delayed to speeds 10–20% higher than the predicted value. Conversely, on a worn, polished runway with minimal texture, dynamic hydroplaning may occur at speeds lower than predicted.
Viscous hydroplaning occurs on very smooth pavement surfaces (such as rubber-contaminated touchdown zones) when a microscopic thin film of water — too thin to be displaced by macrotexture — lubricates the tire-pavement interface. Viscous hydroplaning can occur at much lower speeds than dynamic hydroplaning, sometimes as low as 50–60 knots, because the water film need only be a few thousandths of a millimeter thick to prevent microtexture contact. This is the mechanism that makes rubber-contaminated, polished runway surfaces dangerously slippery even when the runway appears only damp rather than flooded.
This phenomenon occurs during locked-wheel braking on a wet or flooded runway. The frictional heat generated by the locked tire converts the interfacial water to steam, which partially lifts the tire. The heated rubber then reverts to a sticky, unvulcanized state and deposits as a black mark on the runway. These reverted rubber deposits are extremely smooth and, once present, create localized zones of near-zero friction for subsequent aircraft — a positive feedback loop of deteriorating skid resistance.
The primary defense against all forms of hydroplaning is adequate pavement macrotexture, typically supplemented by runway grooving. Macrotexture provides continuous drainage paths through which the pressurized water film can escape, preventing pressure buildup beneath the tire. A Mean Texture Depth (MTD) of at least 1.0 mm, achieved through aggregate gradation, surface texturing, grooving, or porous friction course application, is the internationally accepted minimum for hydroplaning prevention on runways.
The Runway Condition Assessment Matrix (RCAM) is the central operational tool introduced by ICAO under the Global Reporting Format (GRF), effective worldwide since November 2020. The RCAM replaces the previous practice of reporting raw friction coefficients (Mu values) to pilots with a standardized, contaminant-based condition code system.
The RCAM assigns each runway third a Runway Condition Code (RWYCC) from 0 to 6 based on:
| RWYCC | Runway Surface Description | Braking Action | Pilot Reported Braking Action |
|---|---|---|---|
| 6 | Dry | — | — |
| 5 | Damp; Wet (up to 3 mm water); Frost; Slush, Dry Snow, or Wet Snow up to 3 mm depth | Good | Good |
| 4 | Compacted snow at OAT −15°C or colder | Good to Medium | Good to Medium |
| 3 | Wet ("slippery wet"); Dry or Wet Snow on Compacted Snow (any depth); Dry Snow or Wet Snow >3 mm; Compacted Snow warmer than −15°C | Medium | Medium |
| 2 | Water or Slush >3 mm depth | Medium to Poor | Medium to Poor |
| 1 | Ice | Poor | Poor |
| 0 | Wet Ice; Water on Compacted Snow; Dry Snow or Wet Snow on Ice | Less than Poor / Nil | Less than Poor |
A runway is considered contaminated if more than 25% of at least one third of the runway surface area is covered with more than 3 mm of any contaminant (water, slush, snow, or ice). A wet runway (water depth ≤3 mm) is not classified as contaminated under the GRF definition.
The RCAM fundamentally changes the role of friction measurements in operational decision-making. ICAO has determined — based on multiple accident investigations — that there is no reliable correlation between a CFME-reported Mu value and the actual braking action experienced by an aircraft. This is because CFME devices use small, lightly loaded measurement tires that interact with contaminants very differently from a heavily loaded aircraft tire. Consequently, the GRF requires that:
For aircraft operators and flight crews, the RWYCC serves as the primary input to landing distance calculations and takeoff performance assessments. Most aircraft manufacturers provide performance data correlated to RWYCC values, enabling flight crews to determine required landing distance and decision speeds directly from the reported condition code without reference to a friction coefficient.
Skid resistance degrades over time through two primary mechanisms: aggregate polishing and rubber deposit accumulation. Each mechanism predominates in different runway zones and requires different corrective approaches.
Aggregate polishing is the progressive smoothing of aggregate surface microtexture under repeated traffic, particularly in the wheel paths where tire contact is concentrated. The polishing rate depends on aggregate mineralogy: hard, fine-grained igneous rocks (granite, basalt, gabbro) polish slowly and retain microtexture for decades, while softer sedimentary rocks (limestone, dolomite, sandstone) can lose microtexture within a few years of service. The Polished Stone Value (PSV) test classifies aggregates on a scale from approximately 30 (highly polishable) to 68+ (highly polish-resistant). Calcined bauxite — a synthetic aggregate used in high-friction surfacing — achieves PSV values above 70 and is used for critical high-stress locations such as runway ends and intersections.
Polishing is typically a gradual, progressive process. Friction degradation due to polishing first manifests in the touchdown zone and braking zones where tire forces are highest. The friction-speed curve shifts downward, with low-speed friction (microtexture-dependent) declining more than high-speed friction. Corrective action for polished surfaces includes: diamond grinding to expose fresh aggregate surfaces, shot blasting to fracture surface aggregate, application of a high-friction surface treatment (calcined bauxite epoxy overlay), or full surface milling and replacement.
Rubber deposits accumulate from aircraft tires during touchdown, when the initially non-rotating tire accelerates to landing speed in approximately 0.2 to 0.5 seconds. During this spin-up phase, rubber is abraded from the tire and deposited on the pavement. Over hundreds of landings, these deposits build up as a continuous film that fills the pavement macrotexture, smooths the microtexture, and — critically — creates a surface that becomes extremely slippery when wet due to viscous hydroplaning.
Rubber accumulation is concentrated in the touchdown zone, typically extending from approximately 150 m to 450 m from the runway threshold. Beyond this zone, rubber deposits are thinner and more readily dispersed by natural weathering and rain. Surveys consistently show that friction in the touchdown zone can be 15–30% lower than in other runway segments due to rubber contamination.
Rubber removal is accomplished through:
Frequency of rubber removal depends on traffic levels: a busy international airport may require quarterly removal in the touchdown zone, while a regional airport may only need annual treatment.
When a pavement surface cannot achieve or maintain adequate skid resistance through aggregate selection and mix design alone, surface treatments are applied to restore or enhance friction.
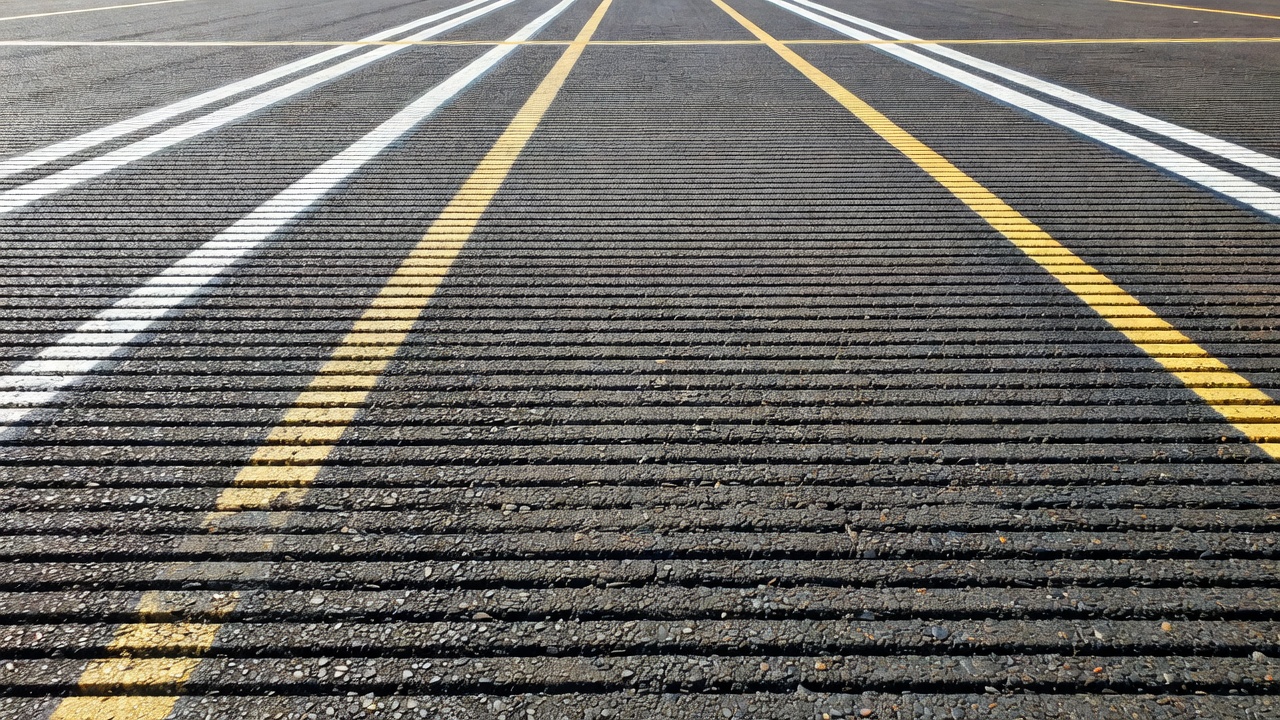
Runway grooving is the mechanical cutting of transverse channels into the pavement surface to create continuous water drainage paths. The standard FAA and ICAO specification calls for grooves 6 mm (¼ inch) wide, 6 mm (¼ inch) deep, spaced at 32 mm (1¼ inch) center-to-center, extending across the full width of the runway in the central portion where aircraft wheel paths are concentrated.
Grooving accomplishes three objectives simultaneously: (1) it provides immediate macrotexture for water drainage, (2) it increases the effective surface area for tire-pavement contact, and (3) it creates sharp edges that penetrate the water film at the tire interface. Research by the FAA Technical Center and NASA has demonstrated that properly grooved runways can reduce wet-weather stopping distances by 25–40% compared to ungrooved surfaces with similar aggregate properties.
The grooving process uses diamond-bladed cutting machines that can groove a full runway width in multiple passes. The grooves must be continuous and uniform in depth and width; discontinuities or rounded edges significantly reduce effectiveness. Groove maintenance is essential: grooves that fill with rubber deposits cease to provide drainage, effectively reverting the surface to an ungrooved condition in terms of wet friction. High-pressure water rubber removal should be performed in a direction parallel to the grooves to avoid damaging the groove edges.
A Porous Friction Course is an open-graded asphalt overlay typically 19–25 mm (¾–1 inch) thick, placed on top of the existing runway surface. PFC mixes use a gap-graded aggregate structure with approximately 15–20% air voids, creating an interconnected pore network through which water drains laterally. This internal drainage system eliminates standing water from the tire-pavement interface and provides macrotexture throughout the full depth of the overlay — not just at the surface.
PFC overlays achieve Mean Texture Depths of 1.2–2.5 mm, compared to 0.4–0.8 mm for dense-graded asphalt, and can dramatically improve wet-weather friction on runways where the underlying surface has acceptable structural capacity but inadequate texture. PFC is particularly effective on runways that are not grooved, as it provides a comparable drainage function through material structure rather than mechanical cutting.
PFC performance depends on maintaining the void structure. Over time, voids can fill with detritus, rubber, and deicing chemical residues, reducing drainage capacity. Specialized high-pressure air-water cleaning equipment is used to unclog PFC surfaces, typically at 2–5 year intervals depending on traffic and climate. PFC service life ranges from 8–15 years for airport applications.
The traditional approach to skid resistance assessment requires physical contact between a measurement device and the pavement surface — a process that is equipment-intensive, operationally disruptive (requiring runway closures), weather-dependent, and provides only a snapshot in time. The emerging field of AI-based visual friction proxy offers a complementary approach: using high-resolution imagery of the pavement surface, combined with machine learning models trained on paired visual-texture and friction-measurement data, to estimate skid resistance from visual features alone.
The scientific premise rests on the established relationship between pavement texture and skid resistance. Since both microtexture and macrotexture are surface phenomena that manifest visually at appropriate resolutions, digital image analysis can extract texture features that correlate with friction performance. Features including:
Modern research published in peer-reviewed journals demonstrates that machine learning models trained on these features can predict friction coefficients with R² values of 0.75–0.92 when validated against traditional friction testers. Models incorporating both visual texture features and known aggregate properties (PSV, gradation) achieve the highest accuracy. Recent studies using deep CNNs trained directly on pavement surface images have shown promise in distinguishing safe from unsafe friction conditions with classification accuracy exceeding 90%.
TarmacView applies AI-based visual friction proxy assessment as part of an integrated pavement condition monitoring platform. High-resolution imagery captured during drone-based inspections — already performed for PAPI light calibration and runway marking assessment — provides the visual data stream. The TarmacView system processes this imagery through trained models that:
The visual friction proxy does not replace regulatory CFME testing — friction measurements for compliance with ICAO and FAA minimum thresholds remain mandatory. Rather, it provides continuous, passive monitoring between formal friction surveys, enabling airport operators to:
As the training datasets linking visual features to measured friction values continue to grow — incorporating data from diverse airports, climates, pavement types, and CFME devices — the accuracy and generalizability of visual friction proxy models will continue to improve, supporting a future where comprehensive, airport-wide skid resistance monitoring is available from every drone inspection flight.
Skid resistance is the fundamental pavement surface property enabling safe aircraft braking, acceleration, and directional control on runways worldwide. It arises from the dual mechanisms of microtexture (adhesive friction from fine aggregate roughness) and macrotexture (water drainage and hysteresis from larger surface relief), each dominating at different speed regimes. Measurement is accomplished through a family of standardized devices — locked-wheel testers, CFME, DFT, and BPT — each providing complementary data on the friction-speed relationship and texture contributions. ICAO Annex 14 and FAA AC 150/5320-12 establish the regulatory framework of minimum friction thresholds, measurement frequencies, and corrective action protocols that govern airport friction management programs globally. Surface treatments including grooving and porous friction courses provide engineered solutions for restoring and maintaining adequate skid resistance. The emerging application of AI-based visual friction proxy assessment, as implemented by TarmacView, offers the prospect of continuous, non-disruptive friction monitoring that complements traditional measurement methods and enables data-driven pavement management at a resolution and frequency not previously achievable.
TarmacView provides AI-driven pavement surface assessment including visual friction proxy estimation, helping airports maintain safe skid resistance levels. Contact us to learn about automated surface condition monitoring.
Friction testing is a critical airport maintenance process that measures the interaction between aircraft tires and runway pavement surfaces. This ensures safe ...
Runway friction testing measures the frictional characteristics of runway pavement surfaces using Continuous Friction Measuring Equipment (CFME) at specified sp...
Friction is a resistive force that acts at the interface between two surfaces in contact, opposing their relative motion or tendency to move. It plays a vital r...