What is Spectral Distribution?
Spectral Distribution – Variation of Quantity with Wavelength in Physics
Spectral distribution is a foundational concept that enables us to understand, characterize, and utilize electromagnetic radiation in science and technology. It describes how a physical quantity, such as energy, flux, or power, varies across different wavelengths, frequencies, or wavenumbers, forming the backbone of radiometry, photometry, and spectroscopy.
Defining Spectral Distribution
Spectral distribution refers to the representation of a physical or radiometric quantity as a function of a spectral variable, most commonly wavelength ($\lambda$), frequency ($\nu$), or wavenumber ($\tilde{\nu}$). Rather than focusing on a single color or frequency, spectral distribution reveals the full composition of a light source, detector response, or radiative process, as seen in the figure below:
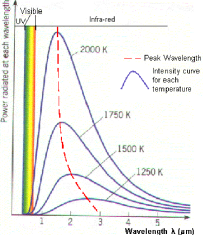
Blackbody Spectral Distributions for Different Temperatures. Higher temperatures shift the peak to shorter wavelengths (Wien’s Law).
In practical terms, the spectral distribution provides insight into the energy makeup of a source (like the Sun, a laboratory lamp, or a star) and determines how that radiation will interact with matter. In astronomy, for example, a star’s spectral distribution reveals its temperature, composition, and evolutionary state. In environmental science, the spectral distribution of sunlight is crucial for understanding plant growth, solar energy harvesting, and the impact of UV radiation on humans.
Spectral Density: The Rate of Change
The spectral density of a quantity describes how much of that quantity exists per unit interval of the chosen spectral variable. For a generic radiometric quantity $Q$, the spectral density with respect to wavelength is:
[ Q_\lambda(\lambda) = \frac{\partial Q}{\partial \lambda} ]
If $Q$ represents total radiant energy, $Q_\lambda(\lambda)$ gives the energy per nanometer at each wavelength. The analogous definition with respect to frequency is $Q_\nu(\nu) = \frac{\partial Q}{\partial \nu}$.
Why does this matter?
- Spectral density allows precise measurement and comparison of radiation across different sources and detectors.
- Spectral densities in different variables (e.g., per nanometer vs per Hertz) are not interchangeable, their numerical values and shapes differ because of the nonlinear relationship between wavelength and frequency.
Units:
- Per wavelength: [W m$^{-2}$ nm$^{-1}$] (e.g., spectral irradiance)
- Per frequency: [W m$^{-2}$ Hz$^{-1}$]
- Per wavenumber: [W m$^{-2}$ cm$^{-1}$]
Key Radiometric Quantities
Radiometric quantities are standardized measures describing the energy flow and interaction of electromagnetic radiation:
- Radiant energy ($Q$): Total energy carried by light, in joules (J).
- Radiant flux ($\Phi$): Rate of energy transfer, in watts (W).
- Irradiance ($E$): Power per unit area, in [W m$^{-2}$].
- Radiance ($L$): Power per unit area per solid angle, in [W m$^{-2}$ sr$^{-1}$].
- Spectral irradiance ($E_\lambda$, $E_\nu$): Irradiance per unit wavelength or frequency.
These quantities are critical for sensor calibration, lighting design, atmospheric modeling, and more. Their definitions and units are standardized by organizations like CIE, ISO, and ICAO to ensure consistency in global applications.
Spectral Energy Distribution (SED)
A spectral energy distribution (SED) graphically shows how the energy output of a source is allocated across the electromagnetic spectrum. SEDs are ubiquitous in astrophysics, where they characterize stars, galaxies, and nebulae, but are also crucial in remote sensing and lighting engineering.
- In astronomy: SEDs reveal the temperature, composition, and structure of stars and galaxies.
- In remote sensing: SEDs of surfaces (vegetation, water, soil) are used to interpret satellite imagery.
- In lighting: The SED of a lamp or LED determines its color rendering and application.
SEDs are constructed from spectrally resolved measurements and can be presented in absolute or relative units, depending on the goal.
Spectral Variables and Their Relationships
The main spectral variables are:
| Name | Symbol | SI Units | Relation to Others |
|---|---|---|---|
| Wavelength | $\lambda$ | m (or nm, μm) | $\lambda = \frac{c}{\nu}$ |
| Frequency | $\nu$ | Hz | $\nu = \frac{c}{\lambda}$ |
| Spectroscopic Wavenumber | $\tilde{\nu}$ | m$^{-1}$ (often cm$^{-1}$) | $\tilde{\nu} = \frac{1}{\lambda}$ |
| Angular Frequency | $\omega$ | rad s$^{-1}$ | $\omega = 2\pi \nu$ |
| Wavenumber | $k$ | rad m$^{-1}$ | $k = \frac{2\pi}{\lambda}$ |
| Photon Energy | $E$ | J (or eV) | $E = h\nu = \frac{hc}{\lambda}$ |
Where $c$ is the speed of light ($\approx 3.00 \times 10^8$ m/s) and $h$ is Planck’s constant ($6.626 \times 10^{-34}$ J·s).
Conversion Table
| Wavelength (nm) | Frequency (Hz) | Photon Energy (eV) |
|---|---|---|
| 200 | $1.5\times10^{15}$ | 6.20 |
| 500 | $6\times10^{14}$ | 2.48 |
| 1000 | $3\times10^{14}$ | 1.24 |
- $\nu = \frac{c}{\lambda}$
- $E = h\nu = \frac{hc}{\lambda}$
- $E,\text{(eV)} = \frac{1240}{\lambda,\text{(nm)}}$
Mathematical Formulation
Spectral distributions are described mathematically by differentiating a total quantity with respect to a spectral variable, then integrating over an interval to recover the total:
[ Q_\lambda(\lambda) = \frac{\partial Q}{\partial \lambda} ] [ Q(\lambda_1, \lambda_2) = \int_{\lambda_1}^{\lambda_2} Q_\lambda(\lambda), d\lambda ]
Changing variables requires transforming the density:
[ Q_\lambda = Q_\nu \left| \frac{d\nu}{d\lambda} \right| = Q_\nu \frac{c}{\lambda^2} ]
This ensures the total quantity remains consistent, regardless of the spectral variable used.
Physical Interpretation and Significance
Spectral distributions directly affect how light interacts with matter and how we measure it. No light source is truly monochromatic, all have a finite spectral width, and all detectors respond over a range of wavelengths.
- Instrumentation: Spectrometers, spectroradiometers, and filter-based detectors rely on understanding spectral distributions for accurate measurements.
- Applications: Solar energy calculations, climate modeling, photosynthesis studies, lighting safety, and aviation all depend on correct spectral data.
The difference between monochromatic (idealized, single-wavelength) and broadband (real-world, multi-wavelength) sources is fundamental in both theory and practice.
Measurement and Units
Measuring spectral distributions requires calibrated instruments and careful consideration of units:
- Spectral irradiance ($E_\lambda$): [W m$^{-2}$ nm$^{-1}$] or [W m$^{-2}$ μm$^{-1}$]
- Spectral radiance ($L_\lambda$): [W m$^{-2}$ sr$^{-1}$ nm$^{-1}$]
- Photon flux density: [photons s$^{-1}$ m$^{-2}$ nm$^{-1}$]
Always state the interval (bandpass) and measurement geometry. Calibration uses standard lamps traceable to national/international references (CIE, ISO). ICAO and WMO provide aviation/environmental measurement protocols.
Spectral Distribution in Context
Blackbody Radiation
A blackbody emits electromagnetic radiation determined solely by its temperature, with its spectral distribution described by Planck’s Law:
[ M_{e,\lambda}(\lambda, T) = \frac{2\pi hc^2}{\lambda^5} \frac{1}{e^{hc/(\lambda kT)} - 1} ]
Key laws:
- Wien’s Law: $\lambda_{\text{max}} T = 2.898 \times 10^{-3}\ \text{m·K}$
- Stefan-Boltzmann Law: $M_e(T) = \sigma T^4$ (where $\sigma = 5.670 \times 10^{-8}$ W m$^{-2}$ K$^{-4}$)
Applications: star/planet temperatures, thermal imaging, energy balance.
Solar Spectral Irradiance
Solar spectral irradiance at Earth’s surface is shaped by atmospheric absorption and scattering. Standard reference spectra (e.g., ASTM G-173) are used for solar panel calibration, climate modeling, and UV hazard assessment.
Spectral Energy Distributions in Astronomy
In astronomy, SEDs:
- Stars: Reveal temperature and composition via absorption/emission lines and continuum shape.
- Galaxies: Show combined light from stars, gas, and dust.
Standards and Calibration
International standards bodies (CIE, ISO, ICAO) define terminology, units, and measurement methods for spectral quantities. Calibration against these standards ensures data comparability across labs, industries, and applications.
Summary
Spectral distribution is a universal concept for describing how a physical quantity varies across the electromagnetic spectrum. Understanding it is essential for accurate science, engineering, and technological applications involving light, from the universe’s largest structures to the most precise sensors.
For further exploration or support in spectral data measurement, calibration, or application, don’t hesitate to contact our experts or schedule a demo.
Frequently Asked Questions
- What is a spectral distribution?
- A spectral distribution is a function or curve that shows how a physical quantity, such as energy, flux, or power, varies with respect to a spectral variable (usually wavelength, frequency, or wavenumber). It allows scientists and engineers to analyze the composition and behavior of electromagnetic radiation from natural and artificial sources.
- How is spectral density different from spectral distribution?
- Spectral density is the derivative of a quantity with respect to a spectral variable, describing how much of that quantity exists per unit interval (e.g., per nanometer or per Hertz). The spectral distribution is the overall shape or function, while the spectral density provides the rate of change at each point along the spectrum.
- Why are different spectral variables used (wavelength, frequency, wavenumber)?
- Different spectral variables suit different contexts: wavelength is common in optics and visible/IR work, frequency in radio and microwave, and wavenumber in molecular spectroscopy. Each variable leads to a different mathematical form of the spectral distribution, and transformations between them must account for their nonlinear relationships.
- How are spectral distributions measured?
- Spectral distributions are measured with instruments like spectrometers or monochromators, which resolve incoming light into its component wavelengths or frequencies and measure intensity at each. Calibration against reference sources and careful unit specification are essential for accurate, reproducible results.
- What are practical uses of spectral distribution in science and engineering?
- Spectral distributions are used to characterize stars and galaxies (astronomy), design lighting and sensors (engineering), assess solar energy or UV exposure (environmental science), and calibrate instruments (metrology). Standards by CIE, ISO, and ICAO ensure measurement consistency for critical applications.
This is a reference entry. TarmacView provides drone inspection services and doesn't sell the equipment or materials described in this glossary.