Structural Health Monitoring (SHM) is the sensor-based, long-term continuous or periodic monitoring of structural condition and performance, providing data to detect damage, assess safety, and plan maintenance. Modern SHM systems integrate accelerometers, strain gauges, displacement sensors, fiber optics, and cameras with AI analysis.
Structural Health Monitoring (SHM) for Bridges and Infrastructure
Structural Health Monitoring (SHM) is the process of implementing a damage detection and characterization strategy for engineering structures through the use of a network of sensors, data acquisition hardware, communication systems, and data analysis algorithms. SHM provides continuous or periodic quantitative assessment of structural condition, enabling engineers to detect damage at an early stage, evaluate structural safety under operational and extreme loads, and optimize maintenance and repair scheduling. The discipline draws on principles from non-destructive testing (NDT), sensor technology, signal processing, data analytics, and structural engineering.
Definition and Purpose of Structural Health Monitoring
Structural Health Monitoring is formally defined by the International Society for Structural Health Monitoring (ISHM) as the measurement of the operating and loading environment of a structure and the response of that structure over a defined period to track and evaluate symptoms of damage, degradation, or changes in performance. The core objective is to answer five fundamental questions about any monitored structure: (1) Is damage present? (2) Where is the damage located? (3) What is the type and severity of the damage? (4) How much remaining useful life does the structure have? and (5) What action is recommended?
The purpose of SHM extends beyond damage detection. SHM provides quantitative performance data that supports condition-based maintenance (CBM), a strategy where maintenance actions are triggered by measured structural condition rather than fixed time intervals. This contrasts with traditional time-based maintenance that follows predetermined schedules regardless of actual condition. Condition-based maintenance enabled by SHM can reduce maintenance costs by 20-40% while improving structural reliability.
SHM is used for several distinct purposes across the infrastructure lifecycle. During construction, SHM validates design assumptions, monitors temporary works, and documents as-built performance. During service life, SHM detects deterioration from fatigue, corrosion, overloading, and environmental degradation. After extreme events such as earthquakes, hurricanes, floods, or vehicle impacts, SHM provides rapid condition assessment to determine if a structure is safe for continued use or requires urgent repair. At the end of service life, SHM data supports decisions about rehabilitation, strengthening, or replacement.
The operational principle of SHM is based on the relationship between structural damage and measurable changes in structural response. Damage — whether cracking, corrosion, loss of prestress, bearing degradation, or foundation settlement — alters the stiffness, mass, or damping properties of a structure. These changes manifest as measurable variations in vibration characteristics (natural frequencies, mode shapes, damping ratios), strain patterns, deflections, or displacements. SHM sensors detect these variations, and analysis algorithms correlate them to specific damage types and locations.
SHM System Architecture
A complete Structural Health Monitoring system is composed of four functional layers that work together to convert physical phenomena on a structure into actionable condition information. Understanding this architecture is essential for designing, specifying, and operating SHM systems.
Sensor Layer
The sensor layer consists of physical transducers mounted on or embedded within the structure. These transducers convert mechanical, physical, or chemical phenomena into electrical signals. The choice and placement of sensors is the most critical design decision in any SHM system because it determines what damage mechanisms can be detected and at what sensitivity. Sensor placement follows principles from optimal sensor placement (OSP) theory, which uses mathematical optimization to maximize the detectability of expected damage scenarios with the minimum number of sensors. Common sensor types are discussed in detail in Section 3.
Data Acquisition (DAQ) Layer
The data acquisition layer receives analog signals from sensors and converts them to digital data suitable for transmission and analysis. DAQ hardware performs several functions: signal conditioning (amplification, filtering, and isolation of raw sensor signals), analog-to-digital conversion (ADC) at specified sampling rates and resolution, synchronization of multiple sensor channels to a common time base, and temporary data buffering before transmission. Sampling rates vary widely by application — accelerometers on a long-span bridge may sample at 50-200 Hz for ambient vibration monitoring, while strain gauges on a orthotropic steel deck may require 1000 Hz or more to capture fatigue cycles from truck passages.
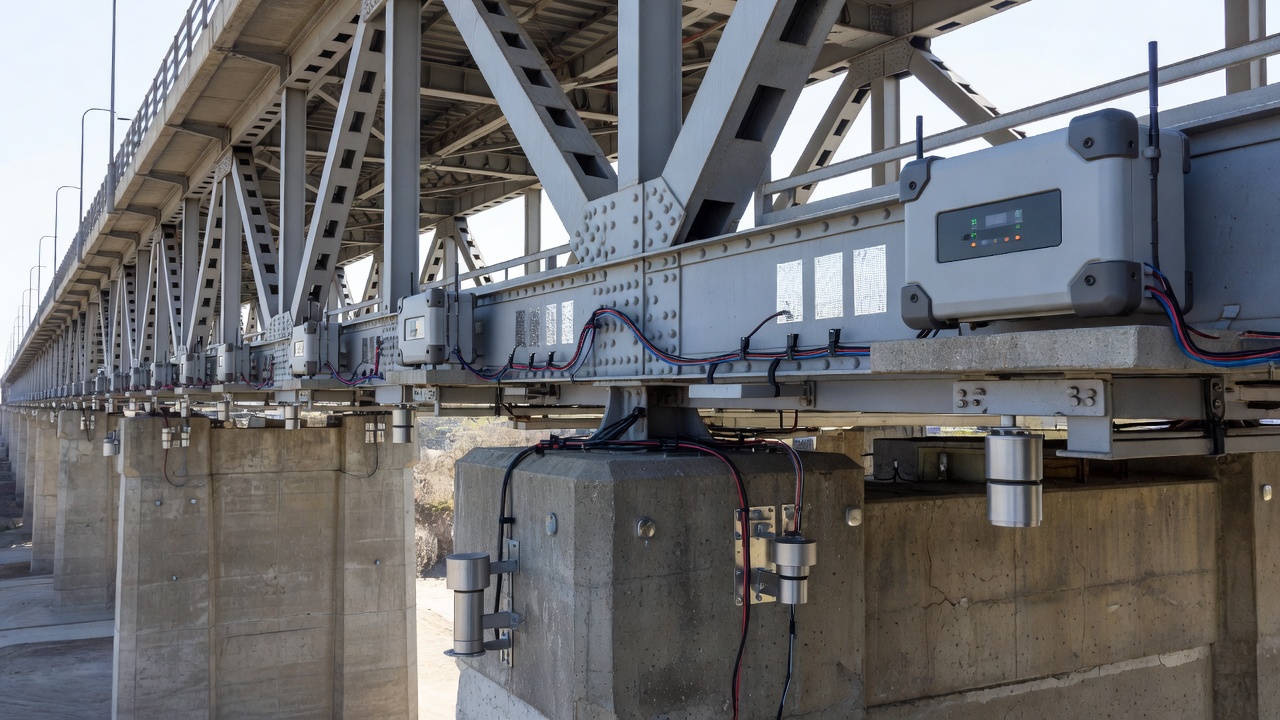
Modern DAQ systems offer modular architectures that allow mixing sensor types on a single platform. The National Instruments cRIO and Campbell Scientific CR6 are examples of ruggedized DAQ platforms common in bridge SHM applications. These systems operate in outdoor environments with temperature ranges from -40°C to +85°C, often in enclosures mounted beneath bridge decks or alongside structures.
Data Transmission Layer
The data transmission layer moves digitized sensor data from the structure to a central processing facility. The transmission method depends on site conditions, data volume, and power availability. Wired transmission using fiber optic cables or Ethernet provides high bandwidth and reliability but requires cable routing and protection. Wireless transmission using cellular networks (4G/5G), radio modems, or satellite links eliminates cabling costs but introduces bandwidth constraints and power consumption considerations.
For rural bridge sites where grid power and wired communications are unavailable, SHM systems commonly use solar panels or wind turbines for power and cellular modems for data transfer. The Oregon Department of Transportation’s SHM program, one of the earliest state-level implementations, uses exactly this configuration for remote bridge monitoring. The data transmission interval can be real-time (continuous streaming), periodic (batch uploads every hour/day), or event-triggered (transmission only when sensor readings exceed thresholds).
Data Processing and Analysis Layer
The data processing layer is where raw sensor readings are transformed into condition information that engineers can act upon. This layer includes data storage (typically a SQL or time-series database), data cleansing and quality control (removal of spikes, drift correction, temperature compensation), and automated analysis algorithms (modal identification, statistical process control, machine learning models). Results are presented through dashboards, trend plots, and automated alert notifications (email, SMS, or SCADA integration).
Cloud-based SHM platforms have become increasingly common. The AWS IoT and Microsoft Azure IoT ecosystems provide managed services for device management, data ingestion, storage, and analytics. These platforms support edge computing, where preliminary data processing occurs on local DAQ hardware before transmission, reducing data volume and enabling real-time alerts even when network connectivity is intermittent.
Convert physical phenomena to electrical signals; capture structural response
Data Acquisition
Signal conditioners, amplifiers, anti-aliasing filters, ADCs, data loggers
Condition analog signals; digitize at appropriate sampling rates; synchronize channels
Data Transmission
Fiber optic cables, Ethernet, cellular modems, radio modems, satellite links
Transfer data from structure to processing facility; support real-time, periodic, or event-triggered modes
Processing & Alerts
Databases, analysis software, dashboards, notification systems
Store, cleanse, and analyze data; detect anomalies; generate alerts and reports
Alert Generation Layer
The alert generation layer is the interface between SHM data and decision-makers. Threshold-based alerts trigger notifications when sensor readings exceed predefined absolute or rate-of-change limits. Statistical alerts use control charts (Shewhart, CUSUM, EWMA) to detect when structural response deviates from baseline behavior beyond expected variability. Machine learning alerts use trained anomaly detection models to identify subtle changes that statistical methods might miss. Alerts are typically graded by severity — informational, advisory, warning, and alarm — with corresponding escalation protocols.
Sensor Types Used in SHM
The selection of sensor types for an SHM system is driven by the damage mechanisms expected for the structure, the structural materials involved, and the monitoring objectives. Each sensor type measures a specific physical parameter and responds to distinct damage modes.
Accelerometers
Accelerometers measure vibration and dynamic response of structures. They are the most widely used sensors in global SHM practice because vibrations are sensitive indicators of structural stiffness changes. Damage such as cracking, loss of prestress, bearing degradation, and member section loss reduces stiffness, which shifts natural frequencies and alters mode shapes. Accelerometers capture these changes.
Technologies include piezoelectric accelerometers (broad frequency range, high sensitivity), capacitive MEMS accelerometers (low cost, small size, DC response), and force-balance servo accelerometers (highest sensitivity for low-frequency civil structures). For bridge monitoring, MEMS accelerometers with a sensitivity of 10 V/g and a noise floor below 10 μg/√Hz are commonly used. The FHWA LTBP program deploys tri-axial accelerometer arrays on instrumented bridges to capture ambient (wind, traffic) and forced (test truck) vibration data.
Data from accelerometer arrays is analyzed through operational modal analysis (OMA) techniques such as Frequency Domain Decomposition (FDD) and Stochastic Subspace Identification (SSI) to extract natural frequencies, mode shapes, and damping ratios. Changes in these modal parameters over time indicate structural degradation.
Strain Gauges
Strain gauges measure local surface deformation (strain) in structural elements under load. They are used to monitor stress levels, detect overloading events, track fatigue damage accumulation, and verify load distribution assumptions. Weldable foil strain gauges are common for steel structures, while vibrating wire strain gauges are preferred for concrete structures due to their long-term stability and immunity to moisture.
Strain monitoring data enables fatigue life assessment using the rainflow counting method, which extracts stress cycles from strain time-histories and applies Miner’s cumulative damage rule (Palmer-Miner linear damage hypothesis). For orthotropic steel bridge decks, where fatigue cracking at rib-to-deck welded joints is a known problem, continuous strain monitoring provides data for fatigue condition assessment under actual traffic, not just design loads.
Displacement and Deflection Sensors
Displacement sensors measure absolute or relative movement of structural components. Linear Variable Differential Transformers (LVDTs) and draw-wire displacement transducers measure relative displacements across cracks, joints, or bearings. Total stations and GNSS receivers measure absolute three-dimensional displacements of bridge decks and towers under load.
For airport runway pavement monitoring, multi-depth deflectometers (MDDs) measure layer-by-layer deflection responses under aircraft loads. This data is used to back-calculate layer moduli for pavement structural evaluation according to ICAO’s Aerodrome Design Manual (Doc 9157) and the FAA’s AC 150/5370-11B pavement design procedures.
Tiltmeters (Inclinometers)
Tiltmeters measure angular rotation of structural elements with high precision (1-10 microradian resolution). They are used to monitor pier settlement, bridge bearing rotation, retaining wall movement, and foundation tilt. In the Oregon DOT SHM program, tiltmeters on the Isthmus Slough bascule bridge (constructed 1935) monitor pier tilt that affects bascule opening and closing operations. The system includes both long-term trend monitoring and an early warning alert for threshold exceedance.
Electrolytic tilt sensors and MEMS-based inclinometers are the most common technologies. They are often deployed in arrays along bridge piers or retaining walls to measure differential settlement and rotation profiles.
Fiber Optic Sensors
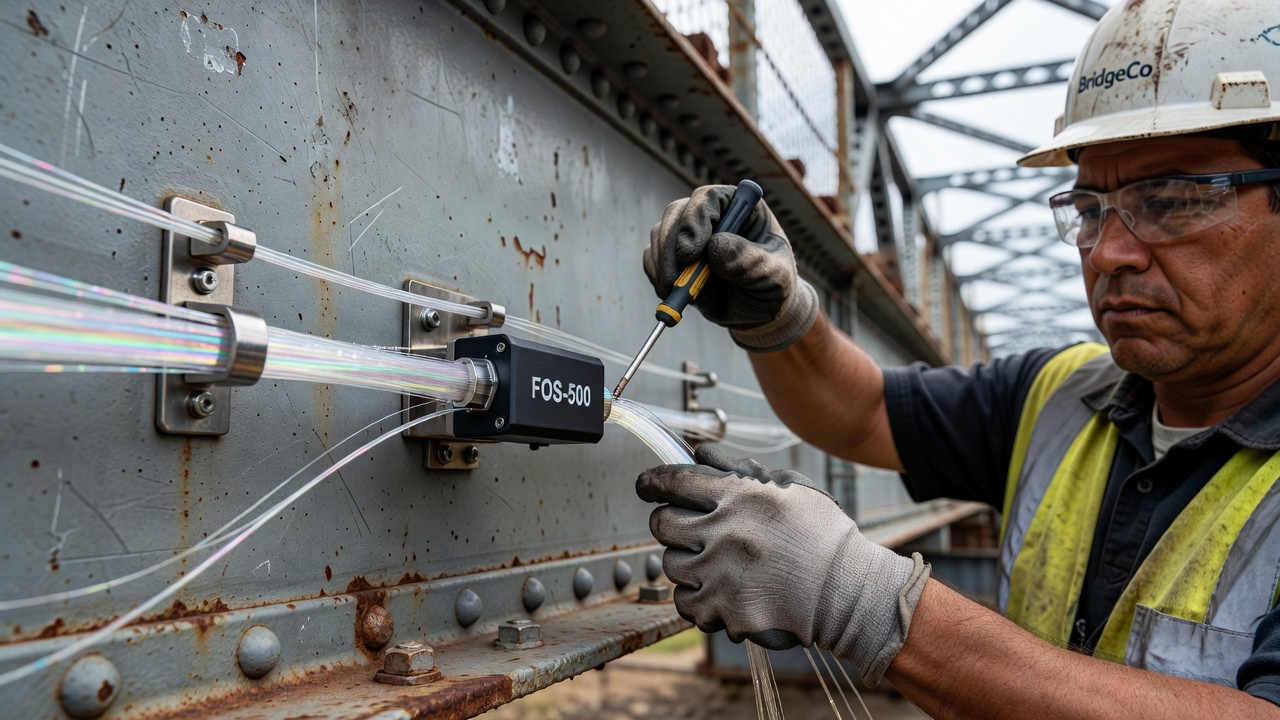
Fiber optic sensors represent a transformative technology for SHM because they offer distributed sensing over long distances, immunity to electromagnetic interference, and long-term stability. Two principal technologies are used: Fiber Bragg Gratings (FBGs) and distributed fiber optic sensing (DFOS) .
FBG sensors consist of periodic refractive index modulations written into the fiber core at specific locations. Changes in strain or temperature shift the Bragg wavelength, which is measured with sub-microstrain resolution. Multiple FBGs can be multiplexed on a single fiber, creating a quasi-distributed sensor network. FBG strain rosettes are installed on steel girders to monitor local stress fields.
Distributed fiber optic sensing uses techniques such as Brillouin Optical Time Domain Analysis (BOTDA) , Brillouin Optical Time Domain Reflectometry (BOTDR) , and Rayleigh-based Optical Frequency Domain Reflectometry (OFDR) to measure strain and temperature continuously along the entire fiber length, achieving spatial resolution of 1-10 cm over lengths of 10-50 km. A single fiber optic cable installed along a bridge girder can provide strain readings at thousands of locations, creating a complete strain profile that reveals local anomalies.
The Akashi Kaikyō Bridge in Japan and the Confederation Bridge in Canada are examples of major bridges that incorporate fiber optic monitoring systems. For airport pavements, fiber optic cables embedded in runway asphalt provide continuous strain and temperature monitoring under aircraft loads, enabling detection of subsurface deterioration before surface cracking appears.
Cameras and Digital Image Correlation
Vision-based SHM uses digital cameras, unmanned aerial vehicles (UAVs/drones) , and digital image correlation (DIC) techniques to measure structural response without physical contact with the structure. Cameras capture high-resolution images of structural surfaces at regular intervals, and image processing algorithms detect and quantify cracks, spalling, corrosion staining, and geometric changes.
Digital image correlation tracks the movement of natural surface texture or applied speckle patterns across a series of images to compute full-field displacement and strain fields with sub-pixel accuracy. DIC is used for laboratory structural testing and, with appropriate camera systems, for field monitoring of bridge elements.
Drone-based visual inspection data — such as that provided by the TarmacView platform — complements ground-based SHM sensor networks by providing comprehensive visual surface condition documentation that can be georeferenced and integrated into the SHM data management system.
Sensor Type
Measured Parameter
Typical Resolution
Common Application
Accelerometer
Acceleration (vibration)
0.1-10 μg
Modal analysis, stiffness change detection
Strain Gauge
Surface strain
1-5 μstrain
Stress monitoring, fatigue assessment
LVDT/Displacement
Relative displacement
1-10 μm
Crack monitoring, joint movement
Tiltmeter
Angular rotation
1-10 μrad
Foundation settlement, pier tilt
FBG Fiber Optic
Strain/temperature
1 μstrain / 0.1°C
Distributed strain profiling
Distributed Fiber Optic
Strain/temperature
10 μstrain / 0.5°C
Long-span continuous monitoring
Camera/DIC
Displacement/Strain field
0.01-0.1 px
Crack detection, full-field deformation
Data Analytics and Artificial Intelligence for SHM
The volume of data generated by modern SHM sensor networks presents both an opportunity and a challenge. A single bridge instrumented with 50 accelerometers sampling at 200 Hz generates approximately 864 million data points per day. Manual analysis of this data volume is impractical, making automated data analytics and artificial intelligence (AI) essential components of any operational SHM system.
Statistical Pattern Recognition
The statistical pattern recognition paradigm for SHM, formalized by Worden and Farrar (2001) at the Los Alamos National Laboratory, divides the SHM analysis process into four steps: (1) operational evaluation — defining the damage scenarios of concern and monitoring constraints; (2) data acquisition and normalization — collecting data and removing environmental and operational effects (temperature, traffic, wind) that may mask damage-induced changes; (3) feature extraction — computing damage-sensitive features from raw data (natural frequencies, mode shape curvature, strain influence lines, wavelet coefficients); and (4) statistical model development — building models that distinguish between undamaged and damaged states.
Data normalization to remove environmental effects is critical because temperature variations can cause natural frequency shifts of 2-10% in bridges — comparable to the magnitude of changes caused by moderate damage. Techniques such as Principal Component Analysis (PCA) , Auto-Associative Neural Networks (AANN) , and Cointegration are used to filter environmental effects and isolate damage-induced features.
Machine Learning for Damage Detection
Machine learning (ML) methods have become central to modern SHM data analysis. Supervised learning algorithms (support vector machines, random forests, deep neural networks) are trained on labeled data from known damage states to classify new data. The challenge is that labeled damage data from operational structures is scarce — most structures are not damaged or undergo damage that is not independently characterized. This limitation has driven interest in unsupervised learning approaches that detect anomalies relative to a baseline healthy-state model without requiring labels.
Convolutional Neural Networks (CNNs) have proven highly effective for image-based crack detection. Trained on thousands of labeled concrete crack images, CNNs can detect cracks as narrow as 0.1 mm with accuracy exceeding 95%. The U-Net architecture, originally developed for biomedical image segmentation, has been adapted for pixel-level crack segmentation in bridge deck images captured by inspection drones.
Recurrent Neural Networks (RNNs) , particularly Long Short-Term Memory (LSTM) networks, are applied to time-series sensor data for prediction of remaining useful life. An LSTM model trained on historical strain gauge data can predict fatigue crack growth rates and estimate the time until a crack reaches a critical length.
Deep Learning for Anomaly Detection
Autoencoder neural networks are used for unsupervised anomaly detection in SHM. An autoencoder is trained to reconstruct normal (undamaged) structural response data. When presented with data from a damaged structure, the reconstruction error increases, signaling an anomaly. Variational autoencoders (VAEs) provide a probabilistic framework for anomaly detection, quantifying the likelihood that observed data represents normal or abnormal structural behavior.
Edge computing nodes that run lightweight AI models directly on the DAQ hardware enable real-time anomaly detection without dependence on cloud connectivity. These systems can trigger immediate alerts for critical events such as earthquake-induced damage or traffic overload.
AI/ML Method
Application in SHM
Data Type
Supervision
Support Vector Machine (SVM)
Classification of damage vs. undamaged
Modal parameters, features
Supervised
Random Forest
Feature importance ranking, damage classification
Multiple sensor types
Supervised
CNN
Crack detection, surface defect identification
Images, video
Supervised
LSTM
Fatigue life prediction, time-series forecasting
Strain, acceleration
Supervised
Autoencoder (VAE)
Anomaly detection, novelty detection
Multi-sensor time-series
Unsupervised
PCA
Environmental effect removal, dimension reduction
Multi-sensor data
Unsupervised
Structural Health Monitoring for Bridges
Bridges represent the most common application domain for SHM. The United States has more than 590,000 highway bridges (as of 2024 data), with approximately 36% classified as structurally deficient or functionally obsolete according to the National Bridge Inventory (NBI) . The FHWA Long-Term Bridge Performance (LTBP) Program and AASHTO guidance provide the framework for bridge SHM practice in the US.
FHWA Long-Term Bridge Performance (LTBP) Program
Launched in April 2008 under the Safe, Accountable, Flexible, Efficient Transportation Equity Act (SAFETEA-LU) , the LTBP Program is a 20-year flagship research initiative of the FHWA Office of Infrastructure Research and Development. The program’s global objective is to collect scientific quality quantitative data from a nationally representative sample of highway bridges, improving knowledge of bridge performance and ultimately promoting safety, mobility, longevity, and reliability of the Nation’s highway transportation assets.
The LTBP program uses a holistic approach analyzing all physical and functional variables affecting bridge performance. Researchers conduct detailed periodic inspections combined with non-destructive evaluation (NDE) techniques including ground-penetrating radar, acoustic emission monitoring, and permanent sensor installations that monitor traffic loading, fatigue cracks, corrosion, overload events, and environmental conditions.
The data collected through the LTBP program supports: improved deterioration and predictive models that simulate interactions between pavements, bridges, and traffic; effective use of life cycle cost analysis; advances in inspection technology through NDE and SHM; development of improved design methods and maintenance practices; quantification of maintenance, repair, and rehabilitation strategy effectiveness; and support for setting national bridge policy.
AASHTO Guidance for SHM
The American Association of State Highway and Transportation Officials (AASHTO) provides guidance on bridge SHM through the Manual for Bridge Evaluation (2015) and supporting publications from the AASHTO Subcommittee on Bridges and Structures. AASHTO’s SHM recommendations cover: determining when SHM is appropriate (bridges with known deterioration, fatigue-prone details, novel designs, or post-extreme-event assessment); sensor selection and placement strategies; data management protocols; and interpretation of SHM results for load rating and condition assessment.
State-Level Bridge SHM Programs
The Oregon Department of Transportation (ODOT) SHM program, documented by Steven Lovejoy of the ODOT Bridge Engineering Section, is one of the most mature state-level implementations. As of 2024, 10 bridges have dedicated SHM systems in six monitoring categories:
Bridge foundations — monitoring pier tilt and settlement using tiltmeters and piezometers (Isthmus Slough bascule bridge, Spencer Creek arch bridge)
Concrete superstructures — monitoring strain and crack propagation in vintage Reinforced Concrete Deck Girder (RCDG) bridges suffering diagonal tension cracking (Luckiamute River bridge, Banzer bridge)
Movable bridges — monitoring mechanical and structural performance of two vertical lift and one swing span bridge
Steel fatigue monitoring — monitoring distortion-induced and thermal fatigue cracking in steel box girder bridges
Structural dynamics — aero-elastic vibration monitoring on large through-truss bridges
Corrosion protection — monitoring cathodic protection system effectiveness on concrete bridges
ODOT’s SHM systems range in cost from $30,000 to $250,000 per bridge, with annual operating costs of $5,000-$20,000 for data management, system maintenance, and analysis. The program has demonstrated that SHM data enables targeted maintenance actions that address specific problems rather than replacing or retrofitting entire structures.
Structural Health Monitoring for Airport Infrastructure
Airport infrastructure monitoring using SHM principles is a growing field driven by increasing aircraft weights, aging pavement infrastructure, and regulatory emphasis on safety. The International Civil Aviation Organization (ICAO) addresses pavement monitoring in the Aerodrome Design Manual (Doc 9157) and Annex 14 — Aerodromes , recommending that aerodrome operators implement monitoring programs to detect pavement deterioration before it compromises safety.
Airport Pavement Health Monitoring
Airport pavement health monitoring systems embed sensors in runway, taxiway, and apron pavements to measure mechanical responses to aircraft loads. Typical sensor suites include: strain gauges embedded in asphalt or concrete to measure tensile strains at the bottom of bound layers; pressure cells to measure vertical stress within pavement layers; temperature probes to measure pavement temperature gradients affecting asphalt stiffness; moisture sensors to detect subsurface water infiltration that accelerates pavement deterioration; and multi-depth deflectometers (MDDs) to measure layer-by-layer deflection responses.
A 2019 study from Iowa State University (funded by the FAA) developed a smart airport pavement instrumentation framework that integrates sensor data with finite element models for real-time pavement structural evaluation. The framework uses falling weight deflectometer (FWD) backcalculation calibration combined with continuous sensor monitoring to track changes in layer moduli over time — identifying structural deterioration months or years before surface cracking appears.
The FAA’s AC 150/5370-11B — Use of Nondestructive Testing in the Evaluation of Airport Pavements — provides guidance on deflection testing, ground-penetrating radar, and other NDE methods used in airport pavement evaluation. The document recognizes that while periodic NDE testing (typically every 5 years for major airports) provides snapshots of pavement condition, continuous sensor monitoring (SHM) can detect deterioration in the intervals between tests.
Market Growth
The airport pavement sensor systems market was valued at $2.1 billion in 2025, projected to reach $4.1 billion by 2034 at a CAGR of 7.7% . Growth is driven by runway reconstruction programs at major airports worldwide, increasing aircraft payloads (A380, B777-9, B787), and regulatory requirements for continuous pavement condition reporting.
Structural Health Monitoring vs. Periodic Inspection
SHM and periodic visual inspection are complementary rather than competitive approaches to structural condition assessment. Understanding when each is appropriate — and how they can be integrated — is essential for effective infrastructure management.
Periodic Visual Inspection
Periodic inspection follows codified procedures — the AASHTO Manual for Bridge Element Inspection (MBEI) or ICAO’s Aerodrome Certification requirements — at fixed intervals (typically 12-24 months for bridges, annually for airport pavements). Inspection is qualitative, relying on the inspector’s visual observation and experience to identify and rate defects. The output is a condition rating (e.g., 1-9 for NBI bridge condition, 1-100 for PCI pavement condition).
Limitations of periodic inspection include: visibility restricted to accessible and visible surfaces (submerged foundations, internal tendons, sub-pavement layers are invisible); inability to detect active deterioration between inspection cycles; subjectivity and variability between inspectors; inability to measure structural performance under actual loads; and absence of quantitative trend data.
Structural Health Monitoring
SHM provides quantitative, time-series data collected continuously or at high frequency. It detects subsurface damage (corrosion of embedded reinforcement, loss of prestress, internal concrete cracking, debonding of overlays) that visual inspection cannot detect. SHM captures transient events (overload trucks, earthquakes, thermal extremes, flood scour events) that occur between inspection cycles.
Integrated Approach
The most effective condition assessment strategy integrates SHM with periodic inspection. The National Bridge Inspection Standards (NBIS) in the US do not currently mandate SHM, but many states use SHM as a supplement for specific structures with known performance issues. The FHWA LTBP program integrates both approaches: periodic detailed inspections provide visual condition baselines, while SHM sensors provide continuous performance data. TarmacView drone surveys bridge the gap by providing high-resolution visual data that can be collected on demand between scheduled inspection cycles and integrated with ground-based SHM sensor data.
Aspect
Periodic Visual Inspection
Structural Health Monitoring
Data type
Qualitative (condition ratings)
Quantitative (time-series measurements)
Frequency
Fixed intervals (12-24 months)
Continuous or high-frequency (minutes to Hz)
Surface access
Visible surfaces only
Hidden surfaces, internal elements
Transient events
Missed between inspections
Captured in real time
Subsurface damage
Not detectable
Detectable with appropriate sensors
Trend analysis
Limited (coarse ratings)
Detailed (continuous trend data)
Cost
Low per inspection
Higher initial investment, lower per-event
Best application
Routine condition documentation
Critical structures, known problems, performance validation
Damage Detection Algorithms
Damage detection in SHM is based on the principle that structural damage alters the physical properties (mass, stiffness, damping, boundary conditions) of a structure, and these alterations produce measurable changes in structural response. Damage detection algorithms are the mathematical and computational methods that extract damage-sensitive features from sensor data and classify structural condition.
Modal-Based Damage Detection
Modal-based methods use changes in natural frequencies, mode shapes, modal strain energy, and damping ratios to detect, locate, and quantify damage. The fundamental principle is that a reduction in local stiffness (caused by cracking, section loss, etc.) shifts the natural frequency downward and changes the mode shape curvature at the damaged location.
Frequency-shift methods compare measured natural frequencies against baseline values. The sensitivity method relates frequency shifts to stiffness reductions at specific element locations. Mode shape curvature methods compute the second spatial derivative of mode shapes; the curvature increases at damage locations. Modal strain energy (MSE) methods compute the strain energy distribution in each element from mode shapes; damage causes strain energy redistribution.
The main limitation of modal-based methods is that natural frequencies are global properties — a small local stiffness change may produce frequency shifts smaller than the measurement uncertainty. Temperature-induced frequency changes (2-10%) can mask damage-induced changes (0.5-2%). Successful application requires careful environmental normalization and statistical hypothesis testing.
Strain-Based Damage Detection
Strain-based methods monitor strain influence lines, strain distributions, and strain range histograms to detect damage. A crack beneath a strain gauge reduces the measured strain at that location under load. Comparative strain analysis compares strain measurements at identical load levels over time — increasing strain indicates stiffness reduction.
Moving load testing is a strain-based method used for bridge condition assessment. A truck of known weight crosses the bridge at crawl speed while strain gauges record responses. The resulting strain influence lines are compared to baseline measurements. Changes in influence line shape indicate stiffness changes, with the location of damage identified by the affected portion of the influence line.
Acoustic Emission (AE) Monitoring
Acoustic emission monitoring detects elastic stress waves generated by active damage mechanisms — crack growth, fiber fracture, corrosion, and delamination. Piezoelectric AE sensors mounted on the structure surface detect wave arrivals, and the system locates the source by triangulation of arrival times across multiple sensors.
AE monitoring is highly sensitive to active damage (crack propagation) and can detect events that are invisible to other methods. The Felicity ratio and calm ratio parameters derived from AE data correlate with damage severity according to the ASTM E976 and ASTM E1932 standards. AE monitoring is applied to steel bridge fatigue crack detection, prestressed concrete tendon corrosion monitoring, and composite material damage assessment.
Machine Learning for Automated Damage Classification
Machine learning algorithms provide automated classification of structural condition states. Features extracted from sensor data (modal parameters, statistical moments, wavelet coefficients, spectral characteristics) are input to classifiers trained on data from known structural states. Common algorithms include:
Support Vector Machines (SVM) find the optimal hyperplane separating undamaged and damaged feature spaces. SVMs are effective with limited training data and are used for binary damage classification. Random Forest ensembles of decision trees provide feature importance ranking — identifying which sensors and features are most sensitive to specific damage types. Convolutional Neural Networks (CNNs) process raw time-domain acceleration data or images directly, learning optimal features for damage detection without manual feature engineering.
Integration with BIM and Digital Twin
The integration of SHM data with Building Information Modeling (BIM) and digital twin platforms represents the current frontier of infrastructure management. A digital twin is a dynamic virtual representation of a physical structure that updates in real time using sensor data from the SHM system.
BIM as an SHM Data Framework
Building Information Modeling provides a structured 3D geometric and semantic framework for organizing SHM data. Each sensor in the monitoring network is assigned a location in the BIM model with associated metadata: sensor type, installation date, calibration history, measurement range, and data stream identifier. Inspection results from visual surveys (including TarmacView drone imagery) are linked to specific BIM elements, creating a unified data environment for all condition information.
The Industry Foundation Classes (IFC) standard, managed by buildingSMART International, provides an open data schema for representing SHM sensors in BIM models. IFC4 includes entities for sensors, sensor types, and measurement capabilities. The IFC-Bridge extension specifically addresses bridge structures, enabling standardized data exchange between SHM systems and BIM platforms.
Digital Twin for Predictive Maintenance
A digital twin integrates SHM sensor data with finite element (FE) models, deterioration models, and analytical algorithms to simulate current and future structural condition. The FE model is updated continuously using modal parameters extracted from accelerometer data — a process called model updating . The updated model provides a calibrated representation of the structure that accounts for actual as-built conditions and current damage state.
With the calibrated digital twin, engineers can: simulate the effect of repair or retrofit strategies before implementation; predict remaining useful life under projected future loading; optimize inspection and maintenance scheduling based on predicted deterioration rates; and validate structural performance after repairs. The Eurostars Bridge Digital Twin project and the InfraWatch project in Europe have demonstrated the feasibility of integrating SHM data with BIM-based digital twins for operational bridge management.
TarmacView Integration
TarmacView drone survey data — high-resolution orthomosaic images, 3D point clouds, and defect maps — can be integrated into BIM/digital twin platforms as time-stamped condition snapshots that complement continuous SHM sensor data. Visual condition data from aerial surveys provides ground truth validation for automated damage detection algorithms and documents surface conditions that sensors beneath the surface cannot detect.
Cost-Benefit Analysis and Implementation Considerations
Implementing an SHM system requires significant initial investment, but the return on investment through extended service life, reduced maintenance costs, and prevention of catastrophic failures is well documented.
Cost Components
An SHM system’s total cost includes: system design and engineering (structural evaluation, sensor selection, optimal placement analysis) — typically 15-25% of total cost; sensor procurement ($200-$5,000 per sensor depending on type) — 20-35% of total; installation and commissioning (mounting sensors, cabling, enclosure setup, system testing) — 25-40% of total; data management and analysis (software, storage, analysis) — ongoing at $5,000-$30,000/year; and system maintenance and calibration — annual cost of $3,000-$15,000.
Typical total installed SHM system costs: small bridge (10-20 sensors) — $50,000-$150,000; medium bridge (20-50 sensors) — $150,000-$350,000; large long-span bridge (50-200+ sensors) — $350,000-$1,500,000; airport runway monitoring system — $200,000-$500,000 per kilometer.
Quantified Benefits
University of California, San Diego research on bridge SHM economics documented that condition-based maintenance enabled by SHM reduces total maintenance costs by 25-40% compared to time-based maintenance. The New York State Department of Transportation (NYSDOT) reported that SHM monitoring of critical bridges with known fatigue issues eliminated the need for annual traffic-closing inspections, saving $500,000 per year in traffic management costs alone.
The cost of structural failure provides the strongest economic justification for SHM. The 2007 I-35W Mississippi River bridge collapse in Minneapolis caused 13 fatalities and resulted in total economic losses exceeding $300 million. SHM systems on bridges with known structural deficiencies cost 0.1-0.5% of the replacement value, providing catastrophic failure insurance at minimal cost.
Implementation Framework
Successful SHM implementation follows a structured framework: (1) Define monitoring objectives — what damage mechanisms are of concern, what decisions will be based on SHM data; (2) Structural evaluation — identify critical elements, failure modes, and performance indicators through engineering analysis; (3) Sensor system design — select sensor types, quantities, and locations using optimal sensor placement algorithms; (4) Data management planning — define data storage, transmission, processing, and archiving protocols; (5) Baseline data collection — characterize the structure in its current condition before deterioration progresses; (6) Analysis and interpretation — implement automated algorithms for damage detection and performance assessment; (7) Decision support — translate SHM findings into actionable maintenance, repair, or operational recommendations.
The American Society of Civil Engineers (ASCE) published guidelines for SHM implementation through the Structural Engineering Institute (SEI) , recommending that SHM be incorporated into the asset management framework of infrastructure-owning organizations with clear roles, responsibilities, and decision-making protocols.
Summary
Structural Health Monitoring is a data-driven approach to infrastructure management that transforms structural inspection from periodic qualitative snapshots into continuous quantitative assessment. The integration of sensor networks, data acquisition systems, communication infrastructure, and AI-based analytics enables engineers to detect damage at the earliest possible stage, understand structural performance under actual loading conditions, and make informed decisions about maintenance, repair, and replacement. As sensor costs decrease, AI capabilities advance, and infrastructure ages, SHM is becoming an increasingly essential component of bridge, tunnel, building, and airport pavement management programs worldwide.
Frequently Asked Questions
Structural Health Monitoring (SHM) is a sensor-based process that continuously or periodically monitors the condition and performance of engineering structures such as bridges, buildings, tunnels, and airport pavements. SHM systems collect data from sensors including accelerometers, strain gauges, displacement transducers, fiber optic sensors, and cameras. The data is analyzed to detect damage, assess structural safety, and optimize maintenance planning. SHM complements traditional visual inspection by providing quantitative, time-series data that reveals hidden deterioration and performance trends.
SHM provides continuous or high-frequency data collection over extended periods, capturing transient events such as earthquakes, traffic overloads, and wind loads that may be missed during periodic inspections. Visual inspection is qualitative and limited to visible surfaces. SHM detects subsurface damage, monitors rate of deterioration, and enables predictive maintenance. The two approaches are complementary: periodic inspections provide baseline visual condition data while SHM delivers quantitative performance trends and early warnings of developing problems.
Common SHM sensors include accelerometers (for vibration and modal analysis), strain gauges (for stress and load monitoring), displacement transducers and LVDTs (for movement and deflection), tiltmeters (for rotation and settlement monitoring), fiber optic sensors (distributed temperature and strain sensing along long spans), crack meters (for crack width monitoring), corrosion sensors (for reinforcement corrosion detection), and cameras/drones (for visual surface condition assessment). Sensor selection depends on the structural type, the damage mechanisms of concern, and the monitoring objectives.
AI and machine learning algorithms process the large volumes of data generated by SHM sensor networks to identify patterns, detect anomalies, and classify damage states. Deep learning models analyze vibration signatures to identify stiffness changes. Convolutional neural networks (CNNs) process images from cameras and drones to detect surface cracks, spalling, and corrosion. Statistical pattern recognition compares current sensor readings against baseline healthy-state data to flag deviations. AI enables automated, real-time damage detection and reduces reliance on manual data interpretation.
Digital twins are virtual replicas of physical structures that incorporate real-time SHM sensor data. Building Information Modeling (BIM) provides a 3D geometric and semantic framework for organizing sensor locations, data types, and inspection results. SHM data is mapped onto the BIM model to create a living digital twin that shows current structural condition, identifies areas of concern, and supports simulation of future deterioration or repair scenarios. This integration enables data-driven asset management decisions.
SHM enables condition-based maintenance rather than time-based maintenance, reducing unnecessary interventions by 20-40%. Early damage detection prevents catastrophic failures and extends structure service life. SHM reduces traffic disruption costs by eliminating unnecessary lane closures for inspection. The cost of an SHM system ranges from $50,000 to $500,000 depending on structure size and sensor count, but the return on investment through extended service life and avoided failures is typically 5-10 times the initial cost over a 10-year period.
The FHWA Long-Term Bridge Performance (LTBP) Program is a 20-year initiative launched in 2008 to collect scientific quality data from a representative sample of US highway bridges using NDE techniques and sensor monitoring. AASHTO provides guidance on SHM application through the Manual for Bridge Evaluation (2015) and supporting research publications. AASHTO's recommendations cover sensor selection, data management, and interpretation of SHM results for load rating and condition assessment. The Oregon DOT SHM program, referencing AASHTO guidelines, monitors 10+ bridges for foundation stability, concrete cracking, steel fatigue, and corrosion protection.
Airport pavement health monitoring systems use embedded sensors (strain gauges, pressure cells, temperature probes, moisture sensors) to measure responses to aircraft loads and environmental conditions. The International Civil Aviation Organization (ICAO) recognizes the value of pavement monitoring for preventing foreign object debris (FOD) damage and ensuring runway safety. SHM systems at airports detect subsurface pavement deterioration before it becomes visible on the surface, enabling proactive maintenance scheduling that minimizes runway closure time. The airport pavement sensor systems market was valued at $2.1 billion in 2025, growing at 7.7% CAGR.
SHM data analytics methods include time-domain analysis (peak value, RMS, crest factor), frequency-domain analysis (FFT, power spectral density), time-frequency analysis (wavelet transform, short-time Fourier transform), modal analysis (natural frequencies, mode shapes, damping ratios), statistical process control (control charts, outlier detection), machine learning (neural networks, support vector machines, random forests), and deep learning (CNNs for image analysis, LSTMs for time-series prediction). The choice of method depends on the damage mechanism being monitored and the sensor data type.
A complete SHM system architecture consists of four layers: (1) the sensor layer — physical transducers (accelerometers, strain gauges, etc.) mounted on the structure; (2) the data acquisition (DAQ) layer — hardware that converts analog sensor signals to digital data through signal conditioning, amplification, filtering, and analog-to-digital conversion; (3) the data transmission layer — wired (fiber optic, Ethernet) or wireless (cellular, radio, satellite) communication networks that transfer data from the structure to a central server; and (4) the data processing and visualization layer — software that stores, analyzes, and presents data through dashboards, trend plots, and automated alerts.
Enhance Your Structural Monitoring Program
Integrate aerial drone inspections with your SHM data streams for comprehensive structural assessment. TarmacView provides high-resolution visual data that complements ground-based sensor networks. Contact us to learn how our platform can strengthen your infrastructure monitoring strategy.
Acoustic Emission (AE) is a passive non-destructive testing method that detects and locates transient stress waves generated by active defect processes — crack ...
33 min read
Non-Destructive Testing
Structural Health Monitoring
+2
FWD deflection data analysis processes the measured deflection basin from FWD testing to back-calculate the elastic modulus of each pavement layer (HMA, base, s...
Non-Destructive Testing (NDT) encompasses methods to evaluate material properties, detect defects, and assess structural condition without causing damage. For i...
27 min read
Infrastructure Inspection
NDT
+4
Cookie Consent We use cookies to enhance your browsing experience and analyze our traffic. See our privacy policy.