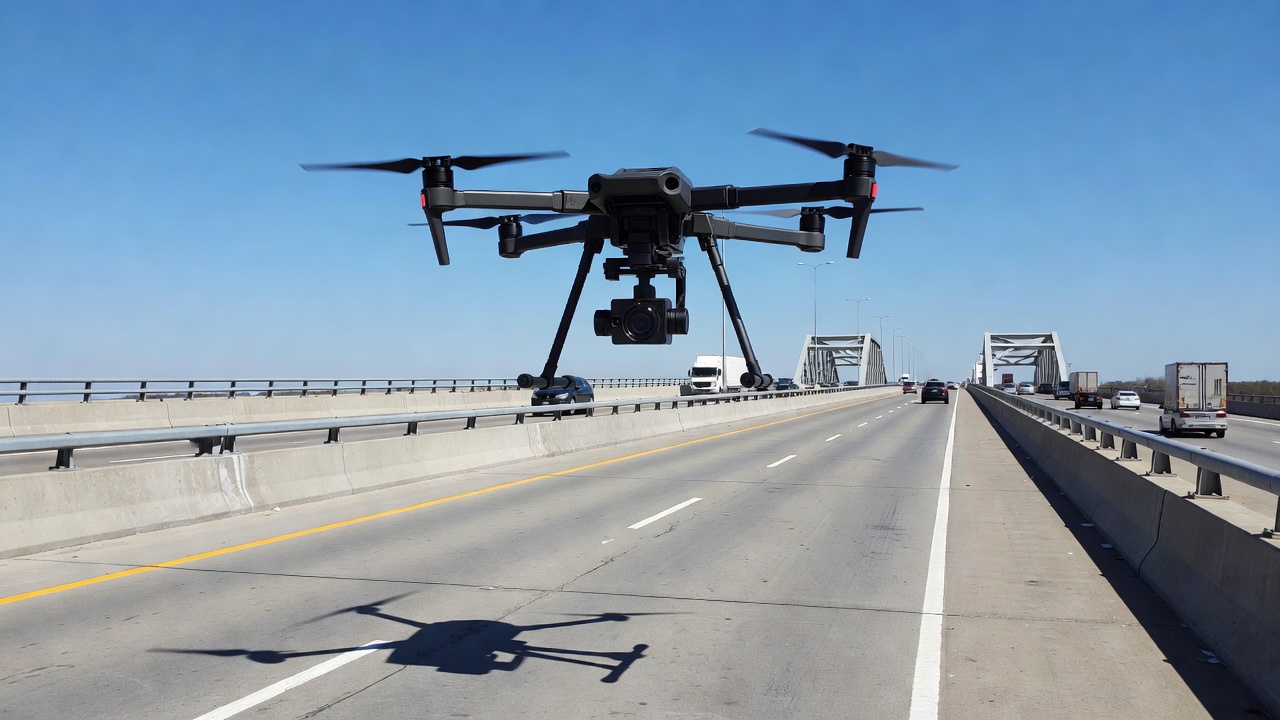
Drone-based infrared thermography mounts thermal cameras on UAVs to rapidly survey bridge decks and pavements for delamination, debonding, and moisture from the air, covering large areas without traffic disruption. AI analysis of thermal patterns automates defect detection. Covers drone IRT system design, flight planning for thermal surveys, data processing, and integration with visual RGB inspection.
Drone-Based Infrared Thermography for Bridge and Pavement Inspection
Drone IRT System Components
A drone-based infrared thermography (drone IRT) system comprises several critical subsystems that must work together to produce accurate, georeferenced thermal data suitable for subsurface defect detection. The thermal camera payload is the core sensor — typically an uncooled microbolometer-based long-wave infrared (LWIR) camera operating in the 7.5–14 µm spectral band. The most common payloads include the DJI Zenmuse H20T (640×512 pixel resolution, 12 µm pixel pitch, ≤50 mK noise equivalent temperature difference or NETD, f/1.0 aperture, ±2°C or ±2% absolute accuracy), the FLIR Vue Pro R (640×512, 12 µm, <50 mK NETD, radiometric calibration, available with 9 mm, 13 mm, or 19 mm lens options), and the Workswell WIRIS Pro (640×512, 30 mK NETD, 10× continuous optical zoom, temperature measurement range from −20°C to +1500°C). These cameras weigh between 270 g and 460 g depending on model and configuration, compatible with the payload limits of commercial multirotor drones such as the DJI Matrice 300 RTK (maximum payload 2.7 kg) or the DJI Matrice 350 RTK.
Gimbal Stabilization
The thermal camera must be mounted on a 3-axis stabilized gimbal that isolates the sensor from drone vibration, angular motion, and wind-induced oscillation. Without gimbal stabilization, vibration frequencies from the drone’s motors (typically 150–400 Hz for multirotors) and flight dynamics (pitch, roll, and yaw movements during course corrections) would introduce motion blur in the thermal images, degrading spatial resolution and thermal measurement accuracy. High-end gimbals such as the DJI Zenmuse series provide 0.01° angular stabilization accuracy, enabling sharp thermal image capture even during forward flight at speeds up to 15 m/s (54 km/h). The gimbal also enables precise camera pointing — critical for inspecting vertical bridge elements (pier faces, abutments, girder webs) where the camera must be oriented perpendicular to the target surface to avoid emissivity-related temperature measurement errors caused by off-angle viewing. Most gimbals support automated pan-and-tilt sequences that can be programmed into the flight mission for systematic multi-angle coverage of complex bridge geometries.
RTK GPS Integration
Real-Time Kinematic (RTK) GPS is the positioning backbone of a production-grade drone IRT system. RTK provides 2–5 cm horizontal and 3–7 cm vertical absolute positioning accuracy by correcting GPS signal errors using a fixed base station with known coordinates, transmitting correction data to the drone via radio link (typically 900 MHz or 2.4 GHz radio modems, or 4G/5G cellular networks for wide-area operations). The drone logs RTK position, altitude (above mean sea level), attitude (pitch, roll, yaw), and camera trigger timestamp for each thermal image — typically as EXIF metadata or in a separate telemetry log file synchronized to the image capture event. This geospatial metadata enables precise coregistration between thermal images and bridge plan drawings, GIS databases, or 3D point clouds from LiDAR or photogrammetry surveys. Without RTK, standard GPS provides only 2–5 m accuracy, which is insufficient for reliably locating defects on a bridge deck where the thermal anomaly may be only 20–30 cm in diameter. Some systems also integrate Post-Processed Kinematic (PPK) correction for operations where real-time RTK correction links are unavailable, processing base station data after the flight to achieve equivalent accuracy.
Component
Function
Typical Specification
LWIR Thermal Camera
Capture surface temperature distribution
640×512 px, 12 µm pitch, ≤50 mK NETD, 7.5–14 µm
3-Axis Gimbal
Stabilize camera, isolate vibration
0.01° stabilization accuracy, 360° continuous pan
RTK GPS Module
Geotag images with sub-10 cm accuracy
2–5 cm horizontal, 3–7 cm vertical
RGB Camera
Visual reference, data fusion
20+ MP, 1-inch sensor, mechanical shutter
Onboard Computer
Data logging, mission control
16+ GB storage, real-time telemetry downlink
Battery System
Power flight and payload
30–50 minute flight time (hybrid), 20–30 min (electric)
RGB Camera Integration
Most drone IRT payloads incorporate a high-resolution RGB camera colocated with the thermal sensor, allowing simultaneous capture of visible-spectrum and thermal imagery. The DJI Zenmuse H20T, for example, combines the thermal camera with a 20 MP wide-angle RGB camera, a 12 MP telephoto camera (2× optical zoom), and a laser rangefinder in a single gimbaled housing. Simultaneous RGB and thermal capture enables image fusion — overlaying the thermal data on the visible image to provide spatial context for anomaly interpretation. An RGB reference image helps the analyst distinguish between true defect-related thermal anomalies and false signals from surface features such as oil stains, rubber deposits, patched areas, painted markings, or debris. Post-processing pipelines can generate split-screen or blended visualization products where the thermal anomaly (displayed in false color) is semi-transparently overlaid on the high-resolution RGB image. This fused product is significantly more interpretable for bridge engineers unfamiliar with raw thermogram interpretation.
Flight Planning for Thermal Surveys
Solar Loading Timing
The single most critical factor in passive drone IRT survey success is solar loading timing — conducting the survey when the sun provides sufficient thermal energy to create measurable temperature differentials between defective and sound areas. The physics is straightforward: solar radiation penetrates the surface and conducts downward into the material. An air-filled delamination (thermal conductivity 0.026 W/mK) blocks this conductive heat flow, causing the surface above to heat up faster and reach a higher temperature than surrounding sound concrete (conductivity 1.7–2.5 W/mK). The magnitude of this differential depends on solar intensity, angle of incidence, atmospheric transmissivity, and exposure duration.
Research by the Virginia Transportation Research Council (VTRC Report 20-R22) and FHWA guidelines establish that the optimal survey window is 5–9 hours after sunrise for daytime surveys (approximately 10:00 AM–3:00 PM local time in temperate latitudes during late spring through early fall). During this window, solar radiation exceeds 600 W/m² at the surface under clear skies, and the thermal contrast between delaminated and sound concrete reaches its maximum — typically 1.0–3.0°C for uncoated concrete decks. The peak thermal contrast typically lags behind solar noon by 1–3 hours due to the thermal inertia of the concrete mass. Nighttime surveys (3–5 hours after sunset) provide inverse thermal contrast — the delaminated area is warmer than the surrounding concrete because the air gap prevents stored heat from dissipating — and avoid the shadowing artifacts caused by bridge superstructure elements, adjacent buildings, or vegetation during daytime surveys.
Factor
Favorable Condition
Unfavorable Condition
Time of day
10:00–15:00 (daytime); 20:00–00:00 (nighttime)
Dawn, dusk transition periods
Cloud cover
Clear sky (0–10% cloud cover)
Overcast (>50% cloud cover), scattered clouds
Solar irradiance
>600 W/m²
<250 W/m²
Surface condition
Dry, clean
Wet, snow-covered, debris-covered
Wind speed
<15 mph (24 km/h)
>20 mph (32 km/h)
Season
Late spring through early fall
Winter (Oct–Feb in northern hemisphere)
The Wisconsin Department of Transportation (WisDOT) and AECOM (2024 study) recommend conducting daytime thermal surveys strictly between 11:00 AM and 2:00 PM local time on clear, sunny days between May and October in northern US climates. For bridge decks with asphalt overlays, longer solar exposure is required because the overlay attenuates the thermal signal — the recommended window extends to 6–10 hours after sunrise. The Indiana DOT has determined that solar radiation must exceed 500 W-h/m² total cumulative exposure for reliable delamination detection on overlaid decks. Cloud cover, even temporary scattered clouds, dramatically reduces thermal contrast because it replaces direct-beam solar radiation (providing ~900 W/m² at solar noon) with diffuse sky radiation (typically 100–300 W/m²).
Flight Altitude and Ground Coverage
Flight altitude determines both the spatial resolution (Ground Sample Distance) and the area coverage per image. The relationship follows from basic optics geometry: a given altitude A and camera horizontal field of view (FOV) produce a ground swath width W = 2 × A × tan(FOV/2). For a DJI Zenmuse H20T with 24° horizontal FOV, at 30 m altitude the swath width is 2 × 30 × tan(12°) ≈ 12.8 m. At 60 m altitude, the swath width doubles to approximately 25.5 m. Lower altitudes provide better defect detection sensitivity but require more flight lines to cover the same area, increasing total flight time and the number of batteries needed.
The drone survey speed must be coordinated with altitude and camera frame rate to ensure sufficient image overlap. For thermal mosaic generation, 70–80% forward overlap (along-track) and 60–70% side overlap (cross-track) are recommended — the same photogrammetric best practices used for RGB orthomosaic generation. At a typical survey speed of 5 m/s (18 km/h) and a camera capture interval of 2 seconds, the forward displacement between consecutive images is 10 m. For a GSD of 3 cm/pixel and an image footprint of 640 pixels × 2.7 cm = 17.3 m, the forward overlap is 17.3 m − 10 m = 7.3 m, or 42% — below the recommended threshold. To achieve 70% forward overlap at 5 m/s, the capture interval must be reduced to approximately (17.3 × 0.30) / 5 = 1.04 seconds, requiring a camera capable of sustained 1 Hz capture rates without overheating or buffer overflow.
Overlap Requirements for Thermal Mosaics
The high overlap requirements for thermal mosaic generation present a specific challenge for drone IRT. Thermal cameras typically have lower frame rates (8–30 Hz) and slower data write speeds than RGB cameras, creating a bottleneck in achieving the 70–80% forward overlap needed for high-quality mosaic stitching. Practical solutions include:
Reduced survey speed: Lowering drone speed to 3–4 m/s (10–14 km/h) allows the thermal camera to capture images with sufficient overlap. This extends flight time per survey area but improves mosaic quality.
Multi-grid flight patterns: Flying overlapping parallel grids (e.g., alternating north-south and east-west passes) provides redundant coverage that improves the photogrammetric solution, even if individual passes have lower forward overlap. The side overlap between perpendicular passes is effectively 100%.
Adaptive capture rate: Modern flight planning software such as DJI Pilot 2, UgCS, or Pix4Dcapture can calculate terrain-aware capture intervals that adjust frame rate based on drone speed and altitude to maintain target overlap automatically.
The bridge inspection research community has established that a thermal orthomosaic with GSD of 3–5 cm/pixel and positional accuracy of 5–10 cm (relative to RTK ground truth) is sufficient for identifying delaminated areas as small as 200 mm in diameter — which corresponds to the minimum reportable defect size in most state DOT bridge inspection manuals.
Thermal Resolution and Ground Sample Distance
Pixel Pitch and Its Effect on Temperature Measurement
Ground Sample Distance (GSD) in thermal imaging defines the physical area on the target surface that corresponds to a single pixel in the thermal image array. The formula is:
GSD = (Pixel Pitch × Altitude) / Focal Length
Where pixel pitch is the center-to-center spacing of microbolometer detector elements on the sensor array, altitude is the distance from the camera to the target surface (above ground level for nadir-looking surveys), and focal length is the effective focal length of the lens system. For the DJI Zenmuse H20T (12 µm pixel pitch, 13.5 mm focal length) at an altitude of 30 m above deck surface:
GSD = (0.012 mm × 30,000 mm) / 13.5 mm = 26.7 mm ≈ 2.7 cm/pixel
Each 640×512 pixel thermal image at 30 m altitude covers an area of approximately 17.3 m × 13.8 m, with each pixel integrating the temperature of a 2.7 cm × 2.7 cm surface area. The reported temperature for each pixel is the area-weighted average temperature of everything within that ground footprint — including concrete, crack openings, surface debris, and any partial shadow or moisture. This averaging effect means that small defects (smaller than 2–3 GSD units) produce temperature readings that are partially diluted by the surrounding sound material, reducing the apparent thermal contrast.
Camera Model
Focal Length
Altitude (m)
GSD (cm/px)
Swath Width (m)
Zenmuse H20T
13.5 mm
30
2.7
17.3
Zenmuse H20T
13.5 mm
50
4.4
28.8
Zenmuse H20T
13.5 mm
75
6.7
43.1
FLIR Vue Pro R (13 mm)
13 mm
30
2.8
17.7
FLIR Vue Pro R (19 mm)
19 mm
50
3.2
20.3
Workswell WIRIS Pro
25 mm
50
2.4
15.4
For bridge deck delamination detection, a GSD of 3–5 cm/pixel is the widely recommended operating range. At GSD finer than 2 cm, the survey becomes inefficient because the narrow swath width requires many parallel flight lines, and the thermal image noise floor may limit the ability to distinguish between adjacent pixels with very small temperature differences. At GSD coarser than 8 cm, small delaminations (200–300 mm diameter) may occupy only 3–6 pixels — too few for reliable detection by either visual analysis or AI algorithms. The University of Nebraska-Lincoln drone IRT studies found that detection probability for defects smaller than 3× GSD drops below 60%, while defects covering 10+ pixels achieve detection rates above 90%.
NETD and Minimum Detectable Temperature Difference
Noise Equivalent Temperature Difference (NETD) — expressed in millikelvin (mK) — represents the smallest temperature differential the camera can distinguish from the thermal noise floor. Modern LWIR microbolometer cameras used in drone IRT achieve NETD values of 20–50 mK (0.02–0.05°C). This means the camera can reliably detect temperature differences of 0.05°C or greater between adjacent pixels, assuming sufficient signal. However, the practical minimum detectable ΔT for a defect-related thermal anomaly is higher than the NETD because:
The observed ΔT between defective and sound areas must exceed the camera NETD by a factor of at least 3–5× for reliable detection (signal-to-noise ratio >3).
Atmospheric attenuation between the camera and target (even at drone altitudes of 30–60 m) reduces the apparent thermal contrast by 2–5% depending on humidity and temperature.
Surface emissivity variations (concrete 0.85–0.95, asphalt 0.90–0.97, water 0.96, oil-stained concrete 0.92) introduce apparent temperature errors of 0.2–0.5°C even when the actual surface temperature is uniform.
Spatial averaging across the GSD footprint dilutes the thermal signal from small defects.
The practical minimum detectable ΔT for drone IRT bridge deck inspection is approximately 0.5°C under good conditions (clear sky, low wind, >600 W/m² solar irradiance, dry surface). Under marginal conditions (thin cloud cover, moderate wind, early morning or late afternoon), the minimum detectable ΔT rises to 1.0–1.5°C. FHWA guidelines state that ΔT values below 0.5°C should be considered inconclusive and require verification by other methods. Typical delamination-related ΔT values range from 0.5°C (marginal, deep defect under overlay) to 3°C+ (strong signal, shallow defect in bare deck at solar noon).
Data Processing and Thermal Mosaic Generation
Radiometric Calibration and Normalization
The raw thermal image data from drone-mounted cameras consists of 14-bit or 16-bit digital counts representing the infrared flux incident on each detector pixel. Converting these raw values to physical temperature requires radiometric calibration using the camera’s factory calibration data — a polynomial transfer function mapping digital counts to scene radiance, combined with corrections for internal camera temperature, integration time, and optical transmission. The calibration function is typically:
T = f(DN, T_housing, T_lens, R_humidity, R_distance)
Where DN is the raw digital number output, T_housing and T_lens are internal camera temperatures (measured by onboard sensors), R_humidity is relative humidity affecting atmospheric transmission, and R_distance is the range from camera to target. Modern radiometric thermal cameras (DJI H20T, FLIR Vue Pro R) perform these corrections onboard for each pixel and each frame, outputting temperature-calibrated data in radiometric JPEG formats (R-JPEG or TIFF with embedded temperature arrays).
After individual image calibration, the thermal mosaic requires temperature normalization because the thermal environment changes during the survey flight. Solar loading varies with sun angle as the drone moves across the survey area (especially for large bridge decks or pavement sections requiring 20–30 minute flights). A 15° change in solar elevation angle during a survey flight can change the absolute surface temperature by 2–4°C, creating a visible gradient across the thermal mosaic that is unrelated to subsurface defects. Normalization algorithms fit a low-order polynomial surface (typically second-order) to the background temperature distribution, then subtract this surface to isolate local thermal anomalies. Alternative approaches include histogram matching between overlapping image strips or reference plate normalization using calibrated blackbody references included in the survey field of view.
Thermal Orthomosaic Generation
Producing a georeferenced thermal orthomosaic follows the Structure-from-Motion (SfM) photogrammetric workflow, adapted to the lower contrast and higher noise characteristics of thermal imagery. The processing sequence includes:
Feature extraction: Distinctive thermal features — edges of shadow patterns, pavement markings (which have different thermal emissivity), expansion joints, lane striping, and construction joints — are detected across overlapping thermal images using algorithms such as SIFT (Scale-Invariant Feature Transform) or AKAZE (Accelerated KAZE). Thermal images have fewer and less distinctive features than RGB images, so the higher overlap (70–80%) is essential to ensure sufficient feature correspondences.
Bundle adjustment: The relative camera positions and orientations are solved using matched feature points across the image set, constrained by RTK GPS camera positions. The bundle adjustment produces a sparse 3D point cloud of tie points and refines the camera calibration (focal length, principal point, lens distortion parameters).
Dense matching and mesh generation: A dense point cloud is generated for the ground surface, and a triangulated mesh or digital elevation model (DEM) is computed. For bridge deck surveys, the surface is approximately planar, so a 2.5D DEM is typically sufficient.
Orthophoto rectification: Each thermal image is orthorectified using the DEM and camera parameters, then blended into a continuous mosaic using seamline optimization and color/thermal balance (adjusting for inter-image brightness and temperature differences). The output is a georeferenced thermal orthomosaic in GeoTIFF format with embedded temperature values.
The final thermal orthomosaic typically achieves 2–5 cm GSD and 5–10 cm absolute positional accuracy relative to RTK ground truth. File sizes for a 500 m × 20 m bridge deck at 3 cm GSD are in the range of 500–1500 MB for single-band 32-bit float temperature data, requiring substantial processing hardware and optimized tiling for web delivery.
AI-Based Thermal Anomaly Detection
Artificial intelligence and deep learning have transformed thermal anomaly detection from a subjective, experience-dependent expert analysis into an automated, quantitative, and reproducible process. The fundamental approach treats thermal anomaly detection as an image segmentation task — assigning each pixel in the thermal orthomosaic a probability of belonging to the “defect” class vs. the “sound” class.
U-Net architecture has been the most widely validated deep learning model for thermal image segmentation in civil infrastructure applications. U-Net’s encoder-decoder structure with skip connections preserves both high-level semantic features (defect type, shape) and fine-grained spatial detail (defect boundaries, edges). Research studies report U-Net segmentation accuracy of 84.7% (Dice coefficient) for bridge deck delamination detection from vehicle-mounted thermal data, with precision of 82% and recall of 87%. The U-Net was trained on 15,000+ labeled thermal image patches (128×128 pixels) extracted from daytime and nighttime surveys across 12 bridge decks in Florida and Virginia.
Transformer-based models — specifically the open-set object detection framework Grounding DINO — have achieved 70% mean Average Precision (mAP@[0.5:0.95]) on bridge deck thermal data from the University of Central Florida’s AI-integrated IRT framework (NDT-CE 2025). The model achieved a detection ratio of 78% against processed IR benchmark data with 0.89 average Intersection over Union (IoU), indicating tight alignment between predicted defect boundaries and ground truth. The model was trained on 23,000+ raw thermal images (not preprocessed) with expert-labeled defect annotations mapped to physical positions on the deck surface.
Classical machine learning approaches remain relevant for scenarios with limited training data. Feature extraction techniques compute thermal texture parameters within sliding windows — mean temperature, standard deviation, skewness (asymmetry of temperature distribution), kurtosis (peak sharpness), entropy (temperature randomness), and contrast (local temperature variation range) — and feed these feature vectors into classifiers such as Random Forest (reported 79% accuracy) or Support Vector Machines (SVM, reported 76% accuracy). Level-set methods based on active contour evolution have achieved correct positive identification rates (CPR) of 80.2% with false positive rates (FPR) of 11.5%.
Automated False Positive Reduction
False positives in drone IRT data arise from surface features that produce thermal anomalies indistinguishable from genuine defects in a single thermal image. Common false positive sources include: oil stains (low emissivity → appears hot), moisture patches (evaporative cooling → appears cold), surface texture changes (tining grooves, broom finish → minor temperature variations), debris (leaves, gravel → variable thermal signature), painted markings (different emissivity → apparent temperature offset), and shadows from bridge railings or superstructure elements (cold zones). AI models reduce false positives through multi-spectral fusion — simultaneously analyzing the registered RGB image to flag surface features and exclude them from defect classification. The UCF Grounding DINO model integrates RGB context as an additional input channel, reducing false positive rates by 35% compared to thermal-only detection. Multi-temporal analysis (comparing day and night thermal surveys of the same area) further reduces false positives as genuine defects show consistent thermal signatures while environmental artifacts change.
Bridge Deck Delamination Detection from Drone
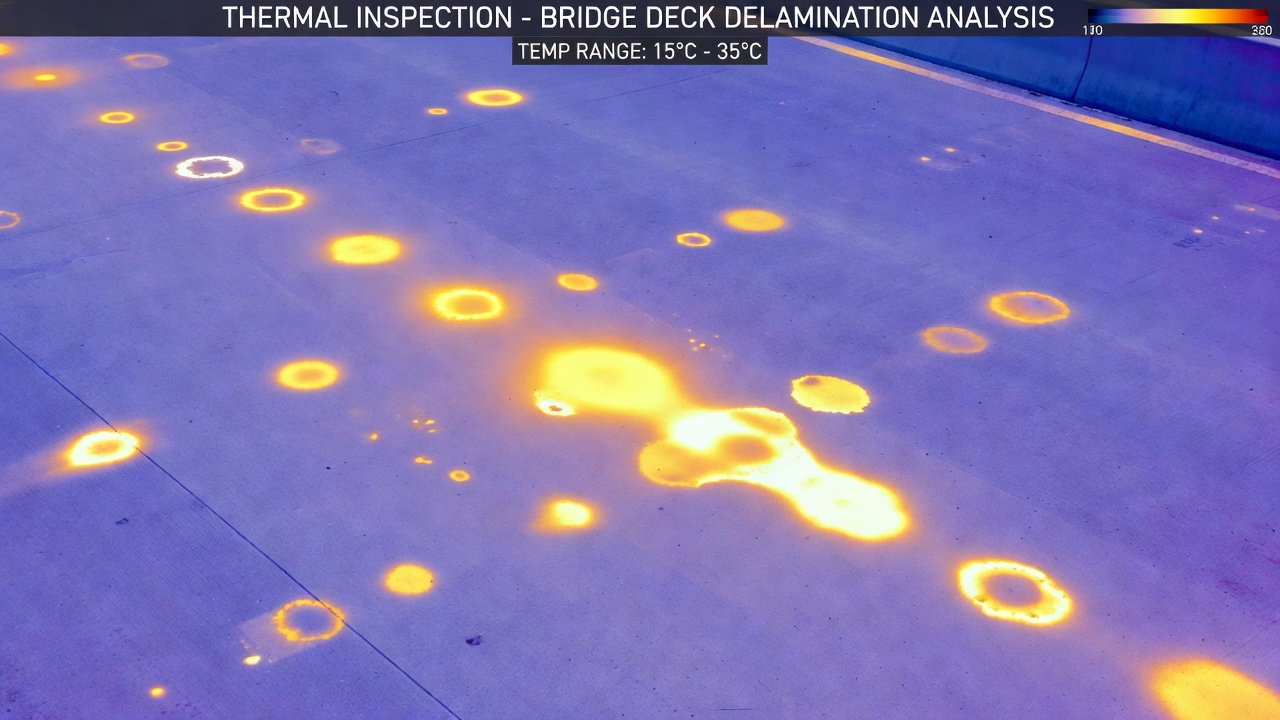
Physical Principles of Delamination Detection
Delamination in concrete bridge decks is a horizontal separation within the slab, typically occurring at or near the plane of the top reinforcing steel — approximately 50–100 mm below the deck surface in a typical 200–250 mm thick concrete bridge deck. Corrosion of the top mat of steel reinforcement produces expansive corrosion products (iron oxides and hydroxides — rust) that generate tensile stresses exceeding the concrete’s tensile strength (typically 3–5 MPa for normal-weight concrete). The resulting horizontal crack propagates along the rebar plane, creating an air-filled gap that typically ranges from 0.1 mm to 5 mm in thickness. This air gap acts as a thermal insulator — the thermal conductivity of air (0.026 W/m·K) is approximately 50–80 times lower than that of concrete (1.7–2.5 W/m·K). Even a 0.5 mm air gap provides thermal resistance equivalent to approximately 25–40 mm of solid concrete.
During solar heating of the bridge deck, heat flows into the concrete surface and conducts downward. Where a delamination exists, the heat encounters an insulative barrier that prevents further downward conduction. The concrete above the delamination continues to absorb solar energy but cannot dissipate it into the deck below, causing its temperature to rise above that of surrounding sound concrete. The temperature differential (ΔT) at the surface above a delamination follows the transient heat conduction equation:
∂T/∂t = α (∂²T/∂x² + ∂²T/∂y² + ∂²T/∂z²)
Where T is temperature, t is time, α is thermal diffusivity (α = k/ρcp, approximately 0.7 × 10⁻⁶ m²/s for concrete, 0.07 × 10⁻⁶ m²/s for asphalt). The solution to this equation with a delamination boundary condition demonstrates that surface ΔT depends inversely on defect depth — a defect at 25 mm depth produces approximately 4× the surface ΔT of a defect at 100 mm depth under identical solar loading.
Depth Limitations and Overlay Effects
The maximum depth at which a delamination can be reliably detected by passive drone IRT is approximately 100–150 mm from the surface under optimal solar loading conditions (>600 W/m², clear sky, dry surface, low wind). Beyond this depth, the thermal diffusion wave from the surface is attenuated to such an extent that the disruption caused by the delamination produces a surface ΔT below the detection threshold of 0.5°C. This means that for a standard 200–250 mm concrete bridge deck, delaminations at the full deck depth (near the bottom mat) are generally not detectable from the surface by passive thermography.
For bridge decks with asphalt overlays, the detection challenge increases significantly. An asphalt overlay of 50 mm (2 inches) thickness reduces the surface ΔT from a concrete delamination by approximately 50–60% compared to a bare deck. This attenuation occurs because the overlay adds thermal mass (absorbs heat), spreads the thermal anomaly laterally (thermal diffusion within the overlay), and introduces an additional interface (overlay-deck bond) that may have its own thermal signature. ASTM D4788 specifies that the method can be used on overlays up to 100 mm (4 inches) thickness, but the Virginia Transportation Research Council found that detection reliability decreases significantly beyond 75 mm overlays. For overlays exceeding 100 mm, IRT should be considered only as a screening tool requiring extensive verification by chain drag, impact-echo, or cores.
Drone Flight Strategy for Bridge Deck Surveys
A typical drone IRT bridge deck survey follows this operational protocol:
Pre-flight assessment: Weather conditions are verified (wind <15 mph, cloud cover <10%, no precipitation expected within ±2 hours of the planned survey window). Surface condition is confirmed dry (no standing water from rain or sprinkler systems). Solar irradiance is measured using a pyranometer at the site — or cross-referenced with local weather station data — to confirm >600 W/m².
Flight mission planning: The bridge deck is mapped in the flight planning software (Pix4Dcapture, UgCS, DJI Pilot 2). Flight parameters are set: altitude 30–50 m AGL, speed 3–5 m/s, 80% forward overlap, 70% side overlap, camera trigger interval 1–2 seconds. The flight path is designed as parallel passes aligned with the bridge longitudinal axis, starting 10 m before the bridge approach and ending 10 m beyond the opposite abutment to ensure complete coverage. Additional passes at oblique angles may be programmed for deck soffit inspection.
Thermal calibration: A reference temperature target (calibrated blackbody at ambient temperature) is placed on the deck within the survey area for in-field radiometric validation. Some protocols recommend placing several reference panels with known temperature at different locations across the deck to capture spatial thermal gradients.
Survey execution: The drone executes the autonomous flight mission while the operator monitors telemetry (battery level, signal strength, camera status, GPS accuracy). Real-time thermal video is downlinked to the operator’s tablet, allowing immediate identification of significant thermal anomalies for preliminary field notes.
Post-flight validation: Immediately after landing, a portable radiometric thermometer or thermal camera is used to verify surface temperatures at several ground-truth locations (obvious delaminations, sound concrete, known expansion joints) to confirm that the airborne thermal data aligns with surface measurements.
Studies comparing drone IRT delamination detection to chain drag ground truth (on concrete decks where chain drag is effective) report detection probabilities of 75–90% for defects >300 mm in diameter at depths <75 mm, dropping to 40–60% for defects <200 mm or >100 mm depth. False positive rates range from 10–25% depending on surface condition and environmental factors.
Pavement Debonding and Moisture Detection
Asphalt Pavement Debonding
Debonding in asphalt pavements — the loss of bond between pavement lifts (typically between a hot-mix asphalt overlay and the underlying asphalt or concrete base) — creates a horizontal separation plane that can be detected by drone IRT using the same thermal insulation mechanism as concrete delamination. When an overlay debonds: the air gap prevents heat from conducting downward during solar heating, producing a surface hot spot; during nighttime cooling, the gap prevents stored heat from rising, producing a warm anomaly. However, asphalt debonding presents unique thermal signatures compared to concrete delamination because of asphalt’s higher solar absorptivity (0.90–0.95 for aged asphalt vs 0.60–0.75 for concrete), lower thermal conductivity (0.7–1.0 W/m·K vs 1.7–2.5 W/m·K), and lower thermal mass.
The University of Nebraska-Lincoln and the Nebraska Department of Transportation conducted comprehensive studies (Report M082, ROSAP DOT 61030) evaluating drone-mounted IRT for detecting subsurface voids and interlayer debonding in roadway pavements. Results demonstrated reliable detection of debonding at depths up to 75–100 mm under optimal thermal conditions (clear summer afternoon, solar irradiance >700 W/m², dry pavement surface). The study found that debonded asphalt overlay sections exhibited surface temperature elevations of 1.5–4.0°C relative to adjacent sound sections — significantly higher than the ΔT from concrete delamination because of asphalt’s higher solar absorptivity.
Moisture Detection in Pavements
Moisture accumulation in pavements — water trapped within the pavement structure, at layer interfaces, or beneath the pavement layer — produces a thermal signature distinct from air-filled voids or delaminations. Water has thermal conductivity of 0.6 W/m·K (approximately 23× higher than air but 3–4× lower than concrete) and volumetric heat capacity of 4.18 MJ/m³·K (approximately 2× that of concrete and 3,000× that of air). These properties mean that:
During solar heating: A moisture-filled void conducts heat more efficiently than an air-filled void, so the surface above a wet area heats up more slowly than above a dry delamination — the surface may appear cooler than the surrounding pavement during the heating phase (negative thermal contrast). The water absorbs thermal energy without a proportional temperature rise because of its high specific heat capacity (4,180 J/kg·K).
During nighttime cooling: The water retains stored heat and releases it more slowly than surrounding dry materials, causing the wet area to appear warmer during the cooling phase (positive night contrast). This nocturnal signature is often more reliable for moisture detection than daytime surveys.
Evaporative cooling: If the moisture is near the surface and water can evaporate, evaporative cooling can produce a cold spot of 2–5°C below ambient temperature regardless of the diurnal heating cycle — the most definitive thermal signature of near-surface moisture.
Drone IRT moisture detection is most effective when paired with GPR data that confirms the presence and depth of water. The Nebraska DOT study found that combined IRT + GPR drone surveys achieved 88% accuracy for moisture detection in pavement subbase layers at depths up to 150 mm, compared to 62% accuracy for IRT alone.
Stripping in Asphalt Mixtures
Stripping — the loss of bond between asphalt binder and aggregate in hot-mix asphalt due to moisture damage — creates micro-scale debonding that may not produce detectable thermal anomalies individually. However, when stripping affects a substantial volume of the mixture (typically >25% of the pavement area at a given depth), the affected pavement exhibits altered thermal properties — lower thermal conductivity (because of air voids created by binder-aggregate separation) and higher moisture retention. Drone IRT can detect these thermally altered zones as areas of delayed thermal response — they heat up faster during daytime (because of air voids) but may show less pronounced daytime heating if moisture is also present. Detection of stripping requires careful multi-temporal analysis comparing the heating and cooling rates of suspect areas against known sound pavement, as the thermal signature is subtle (ΔT typically 0.5–1.0°C) and easily masked by surface emissivity variations.
Integration with RGB Visual Inspection
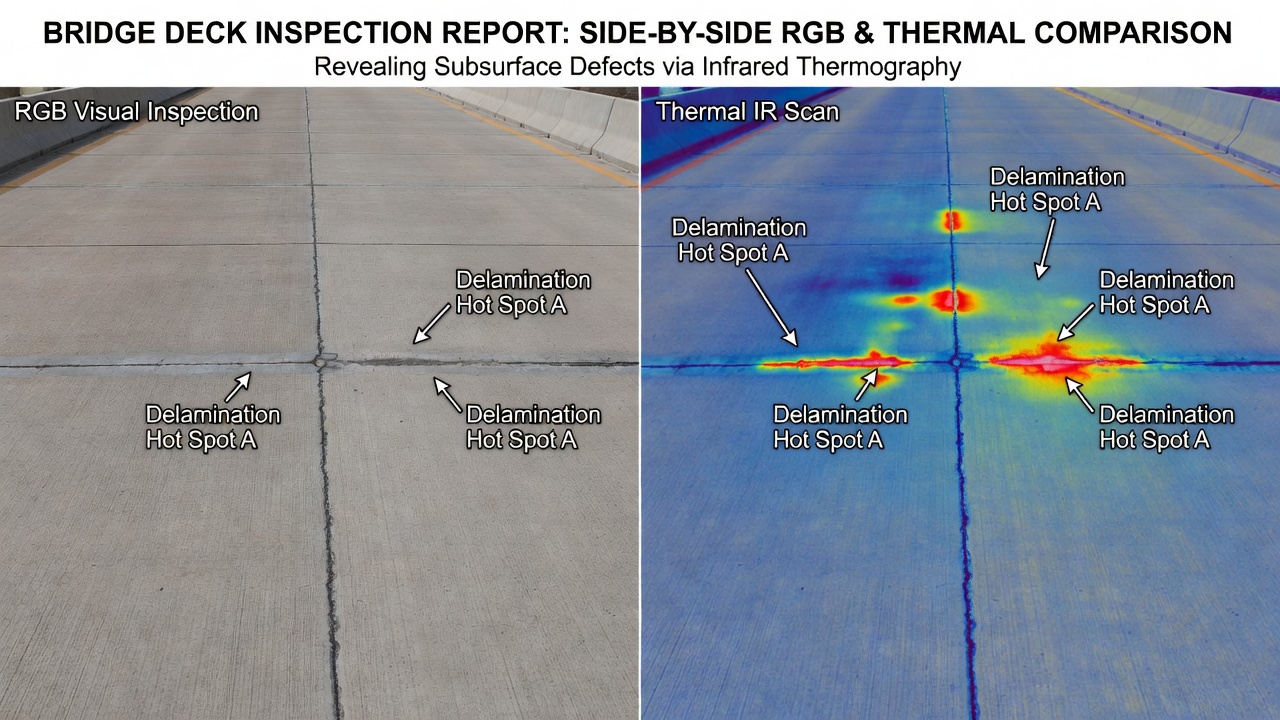
Co-Registered Thermal and Visual Data
Modern drone IRT payloads capture co-registered thermal and RGB imagery — meaning each thermal image has a corresponding RGB (visible-spectrum) image captured from the same camera position and pointing direction, with known geometric transformation between the two sensors. The DJI Zenmuse H20T achieves this by mounting the thermal sensor, wide-angle RGB sensor, and telephoto RGB sensor on a common optical bench within the gimbaled housing, calibrated at the factory so that the pixels of each sensor map to known ground coordinates. This co-registration enables:
Split-screen visualization: The operator or analyst can view the thermal image and corresponding RGB image side by side, using the visible context to interpret thermal anomalies — is that hot spot a delamination or an oil stain? The RGB image reveals surface features invisible in the thermal image.
Image fusion: Thermal data (in false color) is semi-transparently overlaid on the RGB image using alpha blending, creating a single combined image where the visual context is visible beneath the thermal anomaly overlay. This product is significantly more interpretable for bridge engineers and inspection report readers than raw thermograms.
Multi-spectral analysis: The AI detection model receives both thermal and RGB channels as input, learning to associate thermal anomaly patterns with visible surface features. This multi-spectral input reduces false positive rates by enabling the model to recognize that a circular hot spot with dark staining in the RGB channel is likely an oil stain, while a hot spot with no visible surface feature is likely a subsurface delamination.
Comparative Defect Mapping
Integration of drone IRT data with RGB visual inspection data enables comparative defect mapping — overlaying thermal anomaly polygons on the visual inspection defect map to identify relationships between surface-visible defects (cracks, spalls, patching) and subsurface defects (delamination, debonding). The Wisconsin DOT/AECOM 2024 study demonstrated that comparing drone IRT thermal anomaly maps with concurrent RGB visual crack maps revealed that 68% of thermal anomalies corresponded to areas with surface-visible cracking, while 32% represented delaminations with no surface expression — the most dangerous type because they cannot be detected by visual inspection alone. Conversely, 23% of areas with surface cracking showed no thermal anomaly, indicating surface-only deterioration without subsurface delamination — areas that may not require structural repair.
TarmacView Integration
TarmacView’s visual inspection platform can ingest drone IRT thermal orthomosaics as additional data layers within the bridge inspection database. Thermal anomaly polygons — generated by AI analysis of the thermal mosaic and exported as GeoJSON or shapefile format — are imported as overlaid defect layers. Each thermal anomaly carries attributes: ΔT (temperature differential in °C), area (m²), centroid coordinates (latitude, longitude in NAD83 or WGS84), detection confidence (from AI model output), severity classification (based on ΔT thresholds), and the source thermal image filename for traceability. The TarmacView interface enables inspectors to:
Query thermal anomalies: Click on any thermal anomaly polygon to view its temperature differential, the raw thermal image clip, the corresponding RGB image, and any visual inspection data (crack maps, spall areas, patch records) in that location.
Temporal comparison: Overlay thermal surveys from different years to track delamination propagation — a delamination that grew from 0.3 m² to 1.2 m² between 2024 and 2025 surveys clearly indicates active deterioration requiring intervention.
Multi-method correlation: Compare drone IRT thermal anomalies with ground-truth data from ultrasonic tomography, hammer sounding, or core samples that were collected at the flagged locations, building a calibration database that improves future detection model accuracy.
Drone IRT vs Vehicle IRT
Coverage Speed Comparison
Vehicle-mounted IRT (per ASTM D4788) and drone-mounted IRT differ fundamentally in survey speed and area coverage rate. Vehicle systems are designed for high-speed through traffic — capturing thermal images at driving speeds of 50–70 mph (80–113 km/h) with a swath width of approximately 4.6 m (15 feet) per pass. A standard 2-lane bridge deck (30 m length × 12 m width = 360 m²) can be covered in a single 30-second pass at 60 mph, with two additional passes for the opposing lane and shoulders adding perhaps 3 minutes total deck survey time. Including setup, approach/exit, and one additional cool-down pass, the entire deck survey takes 5–10 minutes — completed without any traffic disruption since the survey vehicle moves with normal traffic flow.
Drone IRT covers the same bridge deck at a significantly slower rate. At a survey altitude of 40 m (providing ~3.5 cm GSD), the thermal image swath width is approximately 16 m. With 70% side overlap, the effective coverage swath per flight line is 4.8 m. For the same 12 m wide deck, 3 flight lines are needed. At 5 m/s flight speed over 35 m per pass (including buffer beyond each end), each pass takes 7 seconds. Three passes plus turnarounds, altitude stabilization, and system checks equals approximately 3–5 minutes for the deck data collection — comparable to vehicle speed for this small area. However, the drone must be deployed, batteries verified, pre-flight checks completed, and the launch point established before the survey. For large-area pavement surveys (e.g., 1 km × 8 m runway), the comparison shifts dramatically: vehicle IRT covers 1 km in 30–40 seconds at 60 mph; drone IRT at 5 m/s with 4.8 m effective swath requires 11 flight lines of 200 seconds each = 2,200 seconds = 37 minutes of flight time, requiring 2–3 battery swaps.
Metric
Drone IRT
Vehicle IRT
Survey speed
3–8 m/s (10–28 km/h)
22–31 m/s (80–113 km/h)
Swath width
12–20 m (depends on altitude)
4.6 m (fixed)
Coverage rate
~475 m²/hour
~18,000 m²/hour
Typical deck survey time
15–30 min (including setup)
5–10 min (from approach roll)
Coverable area per shift
~15,000 m²
~50,000 m²
Traffic disruption
None
None
Need for bridge access from below
No
No
Access Advantage of Drone IRT
The primary advantage of drone IRT over vehicle IRT is access to bridge elements beyond the deck surface. Drones can inspect:
Deck soffits: The underside of bridge decks — critical for detecting spalling and delamination that may not yet be visible from the top surface. Drones fly beneath the bridge, using upward-looking or oblique camera angles to capture thermal data from the soffit. The thermal challenge: the deck soffit receives no direct solar radiation, so passive thermal contrast must come from the conduction of heat through the deck thickness — requiring daytime surveys when the top surface is heated and the heat gradient propagates through the deck. Active thermography with supplemental lighting may be needed for shaded soffits.
Vertical elements: Bridge pier columns, pier caps, abutment walls, stem walls, wing walls, and retaining walls can be inspected with the drone flying alongside the element at a standoff distance of 5–15 m. The thermal camera is pointed horizontally (or slightly down-tilted) to capture the vertical surface. Solar loading on vertical surfaces is less intense than on horizontal decks (cosine of the angle between sun and surface normal), so vertical element thermography requires midday surveys when the sun angle is highest.
Constrained spaces: Drone IRT can inspect under-bridge areas, culvert interiors, tunnel linings, and confined structural elements where vehicle-mounted systems cannot reach and where manned inspection would require scaffolding, under-bridge inspection vehicles (snooper trucks), or rope access.
Bridges over obstacles: Drones can inspect bridges over water, deep valleys, environmentally sensitive wetlands, active railways, or urban canyons where vehicle access for deck-top scanning is impossible. The drone operates from a safe launch point outside the obstacle area and flies the complete inspection mission autonomously.
Cost Comparison
The University of Nebraska-Lincoln and Nebraska DOT study provided detailed cost comparisons for quality-related defect identification (QRDI) methods. Drone IRT achieved a cost of approximately $0.06 per square foot ($0.65/m²), compared to $0.15–$0.30 per square foot for vehicle IRT including mobilization and data processing. Chain drag — the baseline method — costs $0.60–$1.00 per square foot ($6.50–$10.75/m²) but requires lane closures and multiple inspectors. The cost advantage of drone IRT becomes more significant for bridges in remote locations or over obstacles where vehicle access would require extensive site preparation. However, vehicle IRT maintains a per-area cost advantage for large, easily accessible bridge decks where high-speed data collection is feasible. The optimal strategy from a cost perspective: vehicle IRT for rapid deck-level screening of accessible bridges, drone IRT for bridges with access challenges, vertical elements, soffits, and targeted follow-up of anomalies identified in the vehicle survey.
Regulatory Considerations
FAA Part 107 for Drone Thermography
In the United States, commercial drone IRT operations are governed by FAA Part 107 (Code of Federal Regulations Title 14, Chapter I, Subchapter F, Part 107) — Small Unmanned Aircraft Systems. Key requirements applicable to thermography operations:
Remote Pilot Certificate: The drone operator must hold a Remote Pilot Certificate issued by the FAA, obtained by passing the Aeronautical Knowledge Test (Part 107 initial exam) and completing a recurrent knowledge test every 24 months. The certificate requires a minimum age of 16 years and TSA security vetting.
Aircraft Registration: The drone must be registered with the FAA if it weighs more than 0.55 lb (250 g). All drones used for bridge thermography exceed this threshold. Registration costs $5 and is valid for 3 years. The registration number must be displayed on the aircraft.
VLOS Requirement: The drone must be operated within visual line of sight (VLOS) of the remote pilot or a visual observer — meaning the aircraft must be visible without binoculars at all times. For bridge deck surveys, this restricts the continuous inspection range to approximately 400–500 m from the pilot station. Large bridge decks (e.g., 1,200 m long Chesapeake Bay Bridge) require repositioning the pilot station along the deck or using multiple visual observers.
Maximum Altitude: 400 ft (120 m) AGL, unless the drone is within 400 ft of a structure, in which case the altitude may exceed 400 ft AGL by up to 400 ft above the structure’s top. This is sufficient for bridge deck surveys (typically 30–60 m AGL) but may restrict inspection of the tops of very tall bridge towers.
Daylight Operations: Part 107 historically restricted operations to daylight hours (30 minutes before official sunrise to 30 minutes after official sunset). The 2021 Part 107 night operations rule allows nighttime flights without a waiver, provided the drone has anti-collision lighting visible for 3 statute miles and the remote pilot has completed updated recurrent training covering night operations. This is significant for thermography because nighttime surveys often provide superior thermal contrast for certain defect types.
Operation Over People: Part 107 generally prohibits flight over people not directly participating in the operation, unless the drone meets specific weight and safety requirements (Category 1–4). For bridge thermography over active roadways with traffic below, the drone does not fly over vehicles (the deck surface is above the drone at typical survey altitudes), but operations over populated areas near bridge approaches may require compliance with over-people provisions.
BVLOS and Special Authorizations
Beyond Visual Line of Sight (BVLOS) operations — where the drone flies beyond the remote pilot’s unaided visual range — are relevant for drone IRT inspection of long pavement sections (highway stretches, runways) or large bridge decks where continuous VLOS coverage is impractical. FAA BVLOS waivers (Part 107.31) require a detailed safety case demonstrating equivalent or greater safety than VLOS operations. The safety case must address detect-and-avoid capability (radar, ADS-B, or electro-optical sensors that detect other aircraft), reliable C2 link (with latency and redundancy specifications), lost link procedures (fail-safe behavior: return-to-home, hover, or continue mission), and airspace monitoring. As of 2025, the FAA has granted BVLOS waivers to several drone inspection operators for infrastructure inspection, but the waiver process remains case-by-case and may require 60–120 days for approval.
For drone IRT operations near airports or in controlled airspace (Class B, C, D, or E surface areas), operators must obtain airspace authorization through the FAA’s LAANC (Low Altitude Authorization and Notification Capability) system. LAANC provides near-real-time authorization for Part 107 operations in controlled airspace up to 400 ft AGL. Most bridge decks in urban areas fall within controlled airspace, and LAANC authorization is typically obtainable within minutes for standard operations during daylight hours. Nighttime operations in controlled airspace require manual coordination with the air traffic control facility.
International Regulatory Frameworks
International Civil Aviation Organization (ICAO) provides the overarching regulatory framework through ICAO Circular 328 (Unmanned Aircraft Systems, 2011) and the ICAO Model UAS Regulations (2020). Circular 328 established the foundational principles of UAS regulation — including the concept that UAS must be operated with an equivalent level of safety to manned aircraft. The Model UAS Regulations provide a framework for national regulators to adopt, covering aircraft registration, operator certification, operational limitations, and airspace integration. ICAO Annex 6, Part IV (2022) provides Standards and Recommended Practices (SARPs) for international RPAS operations.
European Union Aviation Safety Agency (EASA) Regulation 2019/947 classifies UAS operations into three categories based on risk: Open (low risk, <25 kg, VLOS, <400 ft, no authorization needed but subject to operational limitations), Specific (increased risk, requiring operational authorization from the national aviation authority based on a SORA risk assessment), and Certified (equivalent to manned aircraft requirements, for operations over assemblies of people, transport of people, or dangerous goods). Drone IRT for infrastructure inspection typically falls under the Specific category, requiring the operator to submit a SORA (Specific Operations Risk Assessment) or obtain a pre-defined risk assessment (PDRA) declaration. EASA has published standard scenarios (STS-01 and STS-02 for VLOS operations under Specific category) that simplify the authorization process.
Region
Regulation
Key Requirements for Drone IRT
United States
FAA Part 107
Remote Pilot cert, registration, VLOS, 400 ft AGL, night ops (with lights)
European Union
EASA 2019/947
Specific category authorization, SORA risk assessment, operator cert
United Kingdom
CAA CAP 722
Operational authorization, UAS operator registration, pilot competency
Canada
Transport Canada CAR 901
Special flight ops certificate, VLOS, 400 ft AGL except with SFOC
Registration required (100g+), operating permits for specific airspace
Night Flight Operations
Nighttime drone IRT surveys are increasingly common because they offer inverse thermal contrast — delaminations appear as warm anomalies against cooler sound concrete — and avoid shadow artifacts, traffic glare, and thermal reflections from adjacent structures. FAA regulations for Part 107 night operations (effective April 2021) require:
Anti-collision lighting: The drone must have an anti-collision light visible for 3 statute miles (4.8 km). The light must be strobe or flashing and can be either the drone’s integral navigation lights or an added LED strobe. This is primarily for collision avoidance with manned aircraft.
Recurrent training: The remote pilot must complete updated recurrent training that covers night operations, including physiological factors (night vision, spatial disorientation), lighting requirements, and operational considerations.
VLOS requirement: Night operations are still subject to VLOS — the drone must be visible to the remote pilot at all times. This requires a drone with adequate lighting or use of a visual observer with night vision equipment.
Nighttime thermal surveys present additional operational challenges: reduced situational awareness (difficulty seeing obstacles like bridge railings and guy wires), no visual reference for depth perception, colder temperatures reducing battery performance (battery capacity decreases 10–20% in cold weather), and potential condensation on the thermal camera lens. However, the thermal data quality is often superior to daytime data — thermal contrast can reach 1.5–4.0°C (compared to 1.0–3.0°C daytime), and solar reflection artifacts (glint off vehicle windshields, sun glare off wet pavement) are absent.
Reporting Thermal Inspection Results
Deliverable Specifications
Drone IRT inspection results are delivered as a comprehensive inspection report package comprising georeferenced thermal data products, detected anomaly databases, severity classifications, and recommendations. Standard deliverables include:
Thermal orthomosaic (GeoTIFF): A single-file, georeferenced thermal image of the entire inspected surface, with each pixel storing a calibrated temperature value (32-bit float, units of °C or K). The GeoTIFF includes embedded CRS (Coordinate Reference System) definition — typically NAD83 (2011) for US state plane coordinates or WGS84 for lat/lon. Spatial resolution matches the ground sample distance of the survey (typically 3–5 cm).
Thermal anomaly map (GeoJSON or shapefile): Polygons delineating each detected thermal anomaly, with attributes: anomaly ID, ΔT (°C), area (m²), perimeter (m), centroid coordinates, detection confidence (0–1 scale from AI model), severity classification, inspection date, and source data reference.
Defect severity classification follows the widely used FHWA/NACE system adapted for thermal anomalies:
Severity Level
ΔT Range
Action Required
Example Area
Low (monitor)
0.5–1.0°C
Include in next routine inspection cycle
Small, shallow delamination
Moderate
1.0–3.0°C
Schedule repair within 1–2 years
Typical delamination, 0.5–1 m²
High
3.0–10.0°C
Repair within 6 months
Large delamination, structural concern
Critical
>10.0°C
Immediate repair action
Active spalling, safety hazard
RGB orthomosaic (GeoTIFF): High-resolution visual image of the inspected area, georeferenced and aligned to the thermal mosaic for overlay visualization.
Interactive web viewer: Many survey providers deliver results through web-based GIS platforms (ArcGIS Online, Cesium, Potree) where inspectors can toggle between thermal and RGB layers, zoom to individual anomalies, view attribute data, and measure distances or areas. The interactive viewer enables bridge engineers to query any location on the bridge and retrieve the surface temperature at the time of survey.
Anomaly Documentation Standards
Each detected thermal anomaly should be documented with sufficient detail for follow-up inspection, repair planning, and long-term condition monitoring. The American Association of State Highway and Transportation Officials (AASHTO) Manual for Bridge Element Inspection provides the framework for defect documentation. For thermal anomalies, the documentation includes:
Location: GPS coordinates (latitude, longitude, elevation), bridge element (deck, soffit, girder, pier), and structure-specific reference (girder line, bay number, station number based on bridge plans).
Geometry: Length, width, area, and orientation (relative to bridge longitudinal axis). For irregular anomalies, the minimum bounding box and convex hull polygon are recorded.
Temperature data: Maximum surface temperature within the anomaly, minimum temperature, ΔT relative to adjacent sound material (mean temperature of a 1 m buffer zone around the anomaly), and the temperature gradient (ΔT/distance) at the anomaly boundary — sharp gradients indicate distinct defect edges.
Confidence level: Based on AI detection output and analyst review: High (clear thermal signature, confirmed by RGB context, ΔT > 2°C), Medium (moderate signature, some ambiguity, ΔT 1–2°C), or Low (subtle signature, possible false positive, ΔT 0.5–1.0°C) — requiring verification by another NDT method.
Recommended action: Specific recommendation for each anomaly: monitor, verify by UT/sounding, core sample, schedule repair, or immediate repair.
Quality Assurance and Verification
The drone IRT inspection report must include quality assurance documentation demonstrating the accuracy and reliability of the data. The QA/QC package should include:
Calibration certificates: Current (within 12 months) calibration certificates for the thermal camera, traceable to NIST or equivalent national metrology institute. The calibration document establishes the camera’s accuracy (typically ±2°C or ±2%) and NETD (≤50 mK).
Ground truth verification: Temperature measurements collected at 3–5 ground-truth points across the surveyed area using a calibrated contact thermometer (type-K thermocouple or surface probe) or calibrated radiometer. The difference between airborne and ground temperatures should be documented; discrepancies exceeding 2°C should be investigated.
GSD verification: The actual GSD is verified by measuring known dimensions in the thermal orthomosaic (expansion joint spacing, lane width, known structural dimensions) and comparing to the nominal survey design GSD.
Positional accuracy: RTK GPS accuracy is verified by comparing the measured coordinates of 3–5 ground control points (surveyed with total station or RTK rover) against their coordinates measured from the thermal orthomosaic. Root mean square error (RMSE) should be <10 cm for horizontal and <15 cm for vertical.
Detection validation: For bridges where destructive testing or other NDT is performed, a confusion matrix is generated comparing IRT-detected anomalies against verified defects. Metrics include true positive rate (recall), false positive rate, precision, and F1 score. These metrics are reported for the overall survey and broken down by severity level and defect depth.
Integration with Bridge Management Systems (BMS)
The ultimate output of a drone IRT inspection is not the thermal data itself but the integration of thermal anomaly data into the bridge management system (BMS) that drives maintenance planning, repair prioritization, and budget allocation. Most US state DOTs use AASHTOWare Bridge Management or Pontis-based BMS platforms. Drone IRT anomaly data feeds into these systems through:
Condition State assignment: Each bridge element receives a condition state (1–4 scale per AASHTO Manual for Bridge Element Inspection) based on the extent and severity of detected defects. For example, a bridge deck with <2% delamination area (determined from drone IRT thermal anomaly area divided by total deck area) would receive Condition State 1 (Good); 2–10% delamination = Condition State 2 (Fair); 10–25% = Condition State 3 (Poor); >25% = Condition State 4 (Severe).
Deterioration modeling: Comparing successive drone IRT surveys enables development of element-level deterioration curves — the rate of delamination area growth over time. A deck showing delamination propagation from 5% to 12% over 3 years indicates accelerated deterioration requiring intervention within 1–2 years to prevent Condition State 4.
Repair prioritization: Thermal anomaly severity, extent, and location are integrated with other bridge inspection data (load rating, ADT traffic, scour condition, fracture-critical member status) to generate a numerical priority score for each repair action. Drones enable this multi-source data integration by providing a georeferenced, quantified defect database that can be directly ingested into the BMS.
Frequently Asked Questions
Drone-based infrared thermography (drone IRT) is an NDT method that mounts a thermal imaging camera on an unmanned aerial vehicle (UAV) to detect subsurface defects in bridge decks, pavements, and concrete structures. The drone flies over the target surface while the thermal camera records surface temperature variations. Subsurface defects — delaminations, debonding, voids, and moisture pockets — have different thermal properties than sound material. During solar heating, air-filled gaps (delaminations) act as thermal insulation, causing the surface above the defect to heat up faster and become 0.5–3°C warmer than surrounding sound concrete. The thermal camera captures these temperature differentials as thermal anomalies visible in false-color thermograms. Drone IRT enables inspection of bridge decks, pier caps, abutments, pavement sections, and elevated structures without traffic closure, scaffolding, or under-bridge access equipment.
Typical drone IRT payloads use uncooled microbolometer LWIR cameras in the 7.5–14 µm spectral band. Common models include the DJI Zenmuse H20T (640×512 resolution, 12 µm pixel pitch, ≤50 mK NETD, f/1.0, ±2°C accuracy, ~$12K), FLIR Vue Pro R (640×512, 12 µm, <50 mK NETD, 9 mm or 13 mm lens options, radiometric calibration, ~$6K–$9K), and Workswell WIRIS Pro (640×512, 30 mK NETD, 10× optical zoom, temperature range up to 1500°C, onboard data recording). These cameras need to weigh under 500 g for typical multirotor payload limits and must be mounted on a 3-axis stabilized gimbal to isolate them from drone vibration and motion. RTK GPS integration is essential for accurate geotagging of each thermal image, enabling precise defect localization on bridge plans.
Passive drone IRT surveys for bridge decks and pavements must be conducted during periods of adequate solar loading. The optimal window is 5–9 hours after sunrise (peak heating phase, typically 10:00 AM–3:00 PM in temperate climates) or 3–5 hours after sunset (peak cooling phase, typically 8:00 PM–midnight). Solar irradiance should exceed 250 W-h/m² for reliable thermal contrast. Cloud cover, even scattered cloud cover, dramatically reduces thermal contrast because it replaces direct-beam solar radiation with diffuse sky radiation. Wind speeds above 15 mph (24 km/h) degrade thermal contrast through enhanced convective cooling. The surface must be dry — standing water or moisture creates false cold spots due to evaporative cooling. Surveys are ineffective during rain, fog, or overcast conditions, and during winter months (October–February at northern latitudes) where solar radiation is insufficient. Some DOTs recommend surveying between 11:00 AM and 2:00 PM local time on clear, sunny days from late spring through early fall for optimal results.
Flight altitude directly determines Ground Sample Distance (GSD) for thermal imagery — the physical size each pixel represents on the surveyed surface. GSD = (Pixel Pitch × Altitude) / Focal Length. For a DJI Zenmuse H20T camera (12 µm pixel pitch, 13.5 mm focal length) at 30 m altitude: GSD = (0.012 × 30) / 13.5 = 0.027 m = 2.7 cm/pixel. At 75 m altitude: GSD = 6.7 cm/pixel. Higher altitude covers more area per image but reduces spatial resolution, potentially causing small defects to go undetected. For bridge deck delamination detection, a GSD of 3–5 cm/pixel is recommended, corresponding to flight altitudes of 30–60 m depending on camera specifications. Lower altitudes (15–25 m) are used when inspecting for small defects or when higher thermal contrast is needed. The drone's speed must be coordinated with altitude and camera frame rate to avoid motion blur — typical survey speeds are 3–8 m/s (10–28 km/h).
Drone IRT detects subsurface defects that create thermal barriers or alter heat flow. In concrete bridge decks: delaminations (horizontal separations within concrete, typically at the rebar plane), overlay debonding (loss of bond between asphalt/concrete overlay and structural deck), and near-surface voids. In asphalt pavements: interlayer debonding (separation between pavement lifts), subsurface voids from consolidation issues or culvert failures, and moisture accumulation. The thermal signature: hot spots during solar heating (positive contrast) as air gaps insulate the surface from heat flow into deeper material, or warm areas during nighttime cooling (inverse contrast) as defects retain heat longer. Typical detectable ΔT ranges from 0.5°C for deep defects (>75 mm) to 3°C or more for shallow defects. Minimum detectable delamination area is approximately 150×150 mm under good thermal conditions. Depth limitation is typically 100–150 mm from the surface — defects deeper than this produce thermal contrast below the camera NETD threshold.
Drone IRT and vehicle-mounted IRT are complementary methods with different strengths. Vehicle-mounted IRT (per ASTM D4788) captures thermal data at speeds up to 70 mph (113 km/h) with a 15-foot (4.6 m) swath width, covering a typical bridge deck in 30 minutes without traffic closure. Drone IRT is slower — typical coverage rate is ~475 m²/hour (about 51,000 sq ft per day) at survey speeds of 3–8 m/s — but provides access to bridge elements unreachable by vehicles: deck soffits, vertical pier faces, abutments, girder ends, bearings, and culvert interiors. Drone IRT also enables inspection from multiple angles (top-down, oblique, vertical) and can access bridges over water, deep valleys, or environmentally sensitive areas where vehicle access is impossible. Cost per square foot for drone IRT is approximately $0.06–$0.12 vs $0.15–$0.30 for vehicle IRT including mobilization, though drone surveys require more flights for equivalent deck coverage. The optimal approach uses vehicle IRT for rapid deck screening and drone IRT for targeted inspection of inaccessible elements.
Several deep learning architectures have been applied to drone IRT data for automated defect detection. U-Net convolutional neural networks achieve pixel-level semantic segmentation of thermal anomalies, producing accurate defect boundary maps with ~84% classification accuracy reported in research. Transformer-based object detection models like Grounding DINO have achieved 70% mean Average Precision (mAP@[0.5:0.95]) on bridge deck thermal data with 0.89 average Intersection over Union (IoU). YOLO variants (You Only Look Once) enable real-time detection during flight for immediate operator feedback. CNN-based classifiers distinguish delamination from false positives (surface features, moisture, debris) by learning characteristic thermal signatures — size, shape, edge sharpness, ΔT magnitude, and spatial context. Feature extraction methods analyze thermal texture parameters including mean temperature, standard deviation, skewness, kurtosis, and entropy within sliding windows. The University of Central Florida demonstrated an AI-IRT framework using a Transformer model trained on 23,000+ drone/vehicle IR images from three Florida bridges across daytime and nighttime conditions.
Drone IRT operations must comply with national aviation authority regulations. In the United States, FAA Part 107 governs commercial drone operations requiring Remote Pilot certification, aircraft registration (250 g+), visual line of sight (VLOS), maximum 400 ft (120 m) AGL altitude, and no flight over people unless waivered. Nighttime IRT surveys require a Part 107 night waiver or compliance with the 2021 night operations rule (anti-collision lighting, updated remote pilot certificate). Beyond visual line of sight (BVLOS) operations — needed for long pavement stretches or large bridge decks — require a Part 107 BVLOS waiver with approved safety case. In Europe, EASA Regulation 2019/947 classifies infrastructure inspection as Specific category, requiring operational authorization, risk assessment per SORA methodology, and a UAS operator certificate. ICAO Circular 328 (2011) and the ICAO Model UAS Regulations (2020) provide a regulatory framework framework adopted by many countries. Drone operators must also comply with local airspace restrictions (airport proximity, controlled airspace authorizations via LAANC in the US), privacy laws, and data protection regulations.
Drone IRT data processing begins with radiometric calibration of raw thermal image sequences, converting detector counts to physical temperature values using factory calibration data and atmospheric transmission corrections. Individual georeferenced thermal images are stitched into orthomosaics using Structure-from-Motion (SfM) photogrammetry — requiring 70–80% forward overlap and 60–70% side overlap between images. The thermal mosaic is aligned to bridge plans or GIS data using RTK GPS coordinates and ground control points for absolute accuracy of 2–5 cm. Temperature normalization corrects for spatial variations in solar loading, camera response, and ambient temperature across the mosaic. AI detection models scan the normalized mosaic for thermal anomalies, which are exported as georeferenced shapefiles or GeoJSON polygon layers. Each anomaly is classified by severity based on ΔT magnitude: ΔT < 1°C (monitor, low priority), ΔT 1–3°C (schedule repair, moderate priority), ΔT 3–10°C (repair soon, high priority), ΔT > 10°C (immediate repair, critical priority). Results are compiled into inspection reports with thermal maps overlaid on bridge schematics, anomaly tables with coordinates and dimensions, severity ratings, and recommended follow-up actions. Integration with TarmacView visual inspection data provides a comprehensive defect database for bridge management systems.
Drone IRT has several important limitations. (1) Environmental dependence: requires clear skies, ≥250 W-h/m² solar radiation, low wind (<15 mph), dry surface — survey windows are restricted to ~30% of daylight hours in temperate climates. (2) Depth limitation: reliably detects defects only within 100–150 mm of the surface; deeper defects produce thermal contrast below detection threshold. (3) Overlay attenuation: asphalt or concrete overlays reduce thermal contrast by 50% or more at 50 mm thickness; overlays beyond 100 mm may preclude detection. (4) No inherent depth measurement: conventional drone IRT cannot determine defect depth without time-lapse methods or complementary NDT. (5) Flight endurance: typical battery-limited flights of 20–30 minutes restrict per-flight coverage to ~2–4 hectares (5–10 acres). (6) False positives: surface features — oil stains, rubber deposits, moisture, shadows, surface texture variations, debris — create thermal anomalies that can be mistaken for defects. (7) Regulatory constraints: VLOS requirement limits continuous inspection range; BVLOS waivers require extensive safety documentation. (8) Surface emissivity variability: concrete and asphalt emissivity varies with aggregate type, surface texture, moisture content, and weathering, affecting temperature measurement accuracy.
Deploy Drone IRT for Bridge Inspections
Combine UAV-mounted thermal imaging with AI-driven analysis for rapid, non-contact delamination detection on bridge decks and pavements. Get automated thermal anomaly reports with GIS integration — no lane closures needed.
Infrared Thermography (IRT) is a non-contact, non-destructive testing method that detects surface temperature variations caused by subsurface defects such as de...
Automated drone inspection uses pre-programmed flight paths, computer vision, and AI analysis to survey infrastructure assets including runways, bridges, roads,...
Gimbal – Camera Stabilization System for Drone Inspection
A gimbal is a motorized, stabilized mount that isolates a camera or payload from drone movement and vibration, maintaining steady orientation for sharp, consist...
27 min read
Technology
Drone Inspection
+4
Cookie Consent We use cookies to enhance your browsing experience and analyze our traffic. See our privacy policy.