Visual Proxy in Image-Based Infrastructure Assessment
Visual proxies are image-observable surface indicators that approximate material properties or structural conditions typically requiring laboratory testing or instrumented measurements. Covers FHWA LTPP methodology, validation protocols, honest communication of limitations, and the boundary between image-assessable and lab-only properties in pavement and concrete infrastructure inspection.
Definition and Rationale
A visual proxy is an observable surface characteristic captured through image-based inspection that serves as a surrogate indicator for a material property, structural condition, or degradation mechanism that cannot be directly measured from visual data alone. The concept is borrowed from the medical imaging field, where observable features on radiographs or MRIs stand in for physiological conditions that are not directly visible — a bone fracture line on an X-ray is a visual proxy for structural discontinuity, just as pavement cracking on a surface image is a visual proxy for tensile stress exceedance or structural fatigue. In civil infrastructure assessment, the distinction between what can be directly observed in an image and what must be inferred through proxy relationships is fundamental to honest, scientifically defensible condition reporting.
The rationale for using visual proxies in infrastructure assessment rests on four practical considerations. First, image-based inspection is orders of magnitude faster and less expensive than instrumented testing — a vehicle-mounted camera system can survey hundreds of lane-kilometers per day, whereas Falling Weight Deflectometer (FWD) testing covers perhaps 10-20 test points per day at comparable cost. Second, visual proxies provide continuous spatial coverage rather than discrete point measurements, enabling detection of localized deterioration that might be missed between instrumented test locations. Third, the distress-proxy relationships have been codified in internationally recognized standards — the FHWA LTPP Distress Identification Manual, ASTM D5340 (PCI), ICAO Annex 14, and FAA Advisory Circulars — providing a common language for condition assessment across organizations and jurisdictions. Fourth, visual proxy data can be archived and re-reviewed, enabling longitudinal comparisons over time and independent verification of assessments, neither of which is possible with subjective walk-down inspections that cannot be reproduced.
However, the use of visual proxies comes with inherent epistemic limitations. A visual proxy is always an approximation — a correlation between an observable feature and a target condition, never a direct measurement. The strength of that correlation varies by proxy type, pavement construction, environmental conditions, and the experience of the inspector. The FHWA LTPP program, which has collected standardized distress data from over 2,500 test sections across North America since 1987, explicitly recognizes these limitations by requiring severity-level assignments based on measurable criteria (crack width, spalling extent, area affected) rather than subjective judgment alone. TarmacView builds on this foundation by maintaining explicit traceability between each observable proxy and the engineering inferences drawn from it, with clear disclosure of confidence levels and uncertainty bounds.
Visual Proxies in FHWA LTPP
The FHWA Long-Term Pavement Performance (LTPP) Distress Identification Manual (DIM) , now in its fifth edition (FHWA-HRT-13-092, revised May 2014), is the authoritative reference for standardized pavement distress identification in North America. The DIM defines specific distress types for three pavement categories: asphalt concrete-surfaced pavements (ACP), jointed portland cement concrete pavements (JCP), and continuously reinforced concrete pavements (CRCP). Each distress type in the DIM functions as a visual proxy for specific material or structural conditions. The manual provides standardized nomenclature, measurement protocols, severity level definitions, and photographic references to ensure consistent data collection across thousands of inspectors and millions of lane-kilometers surveyed.
Surface Defects in Asphalt Concrete Pavements (ACP)
The DIM defines three surface defect distress types for asphalt concrete-surfaced pavements, all of which function as visual proxies. These are distinct from cracking distresses (fatigue, block, edge, longitudinal, reflection, transverse) and surface deformation distresses (rutting, shoving) in that they represent material surface characteristics rather than structural discontinuities.
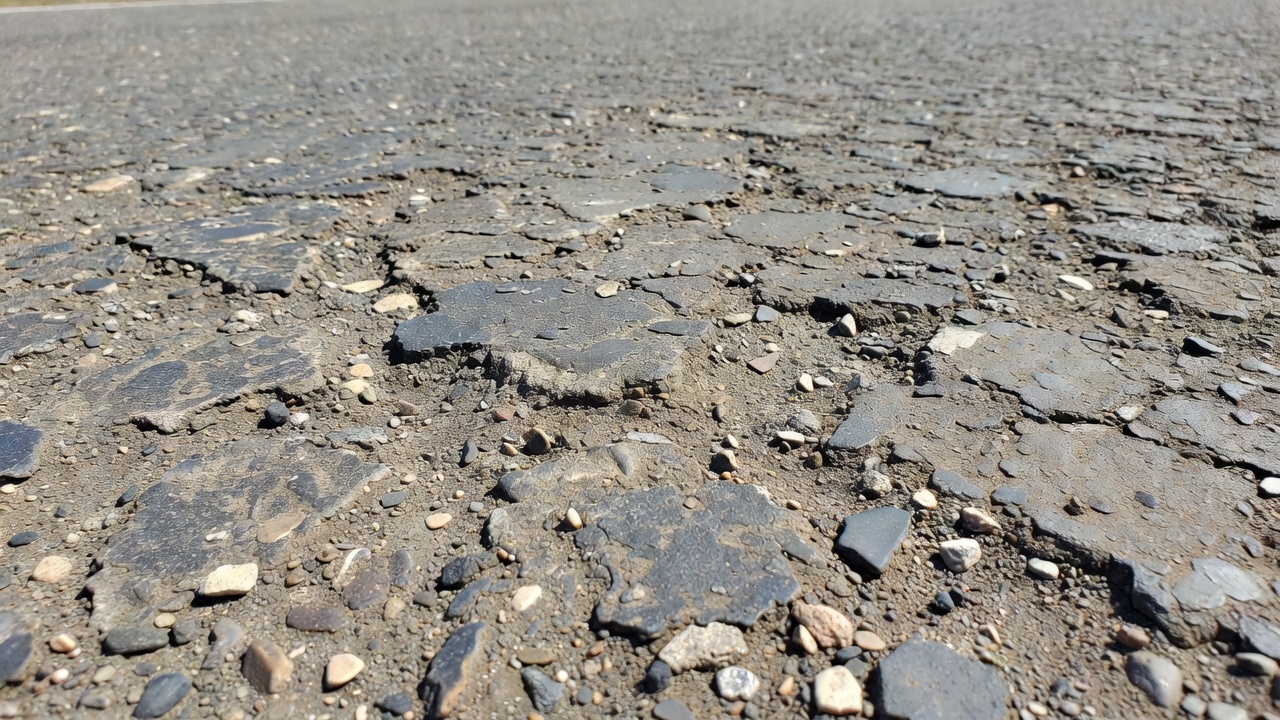
Bleeding (ACP Distress Type 11) is a visual proxy for excess asphalt binder migration to the pavement surface. The DIM describes bleeding as a film of asphalt binder on the pavement surface that creates a shiny, glass-like, reflective surface that may become sticky when temperatures are high. Bleeding is caused by: excessive asphalt binder content in the mix, low air void content (below 2-3%), over-asphalting during construction, or binder migration due to high temperatures combined with traffic densification. The visual observation of bleeding serves as a proxy for three engineering conditions: the binder content exceeds the optimum for the given aggregate gradation, the air void content has fallen below the minimum required for binder accommodation, or the binder grade is too soft for the prevailing temperature conditions. The DIM assigns three severity levels for bleeding based on the area affected and the degree of surface coverage.
Polished Aggregate (ACP Distress Type 12) is a visual proxy for surface friction degradation. The DIM defines polished aggregate as the wearing away of the surface texture of the aggregate particles exposed at the pavement surface, resulting in a smooth surface that reduces skid resistance. The visual observation of polished aggregate — identifiable by the rounded, smooth appearance of exposed aggregate particles — serves as a proxy for the reduction in surface friction coefficient (μ) below acceptable thresholds. The AASHTO T 242 (skid tester) and ASTM E274 (locked-wheel friction tester) provide direct friction measurement, but these require specialized equipment and traffic control. The polished aggregate visual proxy allows network-level screening for friction-deficient locations that warrant detailed friction testing. Severity in the DIM is assessed based on the percentage of surface area affected.
Raveling (ACP Distress Type 13) is a visual proxy for binder-aggregate adhesion loss and progressive surface disintegration. The DIM describes raveling as the wearing away of the pavement surface caused by the dislodging of aggregate particles and loss of asphalt binder. The visual observation of raveling — characterized by a rough, pitted surface with loose aggregate particles — serves as a proxy for multiple potential underlying conditions: oxidative hardening of the binder (age embrittlement), moisture-induced stripping of the binder-aggregate bond, inadequate binder content, insufficient compaction during construction, or aggregate degradation (friable particles breaking under traffic). The DIM assigns three severity levels based on the depth of aggregate loss and the extent of surface area affected.
LTPP Surface Defect
Distress Type
Primary Visual Proxy For
Severity Criteria
Bleeding (ACP 11)
Surface defect
Excess binder content; low air voids; binder migration
Surface coverage and degree of binder film
Polished Aggregate (ACP 12)
Surface defect
Friction coefficient reduction
Percentage of area affected
Raveling (ACP 13)
Surface defect
Binder-aggregate adhesion loss; aggregate loss
Depth of aggregate loss; area affected
Proxies for Binder and Aggregate Loss
Binder and aggregate loss in asphalt pavements manifests through a cascade of visual proxies that progress from subtle texture changes to complete surface disintegration. Understanding the proxy relationships between these visual observations and the underlying material conditions is essential for accurate condition assessment and appropriate maintenance decision-making.
Raveling is the primary visual proxy for binder-aggregate adhesion loss. The FHWA LTPP DIM defines raveling as a surface defect characterized by the progressive loss of aggregate particles from the pavement surface downward. However, raveling encompasses a spectrum of severity that corresponds to different stages of binder-aggregate separation. At Low Severity (LTPP Level L), the pavement surface exhibits loss of fine aggregate only — the surface texture becomes slightly rough but coarse aggregate particles remain firmly embedded. This serves as a proxy for the early stages of binder oxidative hardening, where the asphalt binder has stiffened and lost some adhesive capacity but the aggregate structure remains intact. At Moderate Severity (LTPP Level M), both fine and some coarse aggregate particles are lost, producing a distinctly rough, pitted surface texture. This serves as a proxy for advanced binder embrittlement or the onset of moisture-induced stripping. At High Severity (LTPP Level H), coarse aggregate particles are lost across a substantial area, the surface texture is deeply pitted and may exhibit isolated to moderately interconnected aggregate loss that may eventually form potholes. This serves as a proxy for near-complete binder adhesive failure or significant moisture damage.
The Georgia Department of Transportation (GDOT) has developed a finer-grained raveling assessment methodology using 3D pavement surface imaging technology. GDOT research found that the conventional three-level severity classification (L, M, H) was too coarse for tracking raveling progression over time, particularly for preventive maintenance applications where early detection is critical. The GDOT approach quantifies raveling as the percentage of aggregate loss per unit area, measured through 3D profilometry that distinguishes between intact surface and areas where aggregate has been dislodged. This percentage aggregate loss serves as a more sensitive visual proxy for binder condition than the conventional severity classification, enabling detection of raveling progression long before it reaches Moderate or High severity thresholds.
Stripping is distinguished from raveling in that stripping specifically refers to the loss of adhesion between the asphalt binder and aggregate due to the presence of moisture — whereas raveling can result from any mechanism that causes aggregate dislodgement, including binder aging, construction deficiencies, or aggregate degradation. The visual manifestation of moisture-induced stripping often appears first at the bottom of the asphalt layer (where water accumulates) and progresses upward, meaning that surface raveling may be a late-stage proxy for stripping that has been ongoing within the pavement structure for some time. Research published by the AMAP (Asphalt Materials and Pavements) organization notes that moisture damage can manifest as stripping, raveling, and potholes — with stripping representing the internal delamination, raveling representing the surface expression of that delamination, and potholes representing the complete loss of material where raveling has penetrated the full depth of the surface layer.
Bleeding serves as a visual proxy for the opposite condition — excess binder rather than binder loss. When the asphalt binder content exceeds the voids in the mineral aggregate (VMA) capacity, or when the air void content drops below approximately 2-3% due to traffic densification, the excess binder is forced to the pavement surface where it forms a visible film. The visual observation of bleeding is a proxy indicator that the asphalt binder content is above optimum for the mixture’s VMA, or that further densification under traffic will continue to force binder to the surface. The engineering implication is that bleeding reduces surface friction (creating a safety hazard) and can lead to flushing and shape loss in wheel paths. However, bleeding alone cannot quantify the magnitude of binder content excess — that determination requires laboratory extraction testing per AASHTO T 164 (Quantitative Extraction of Asphalt Binder from Hot-Mix Asphalt) or ignition oven testing per AASHTO T 308 (Determining Asphalt Binder Content of Hot-Mix Asphalt by the Ignition Method).
Proxies for Structural Degradation
Structural degradation of pavements — the progressive loss of load-carrying capacity due to repeated traffic loading, environmental cycling, and material deterioration — produces characteristic surface distress patterns that serve as visual proxies for the structural condition of the pavement layers below. The relationship between surface observations and structural condition is the most technically complex proxy mapping in pavement assessment, requiring careful interpretation of crack patterns, deformation modes, and distress progression over time.
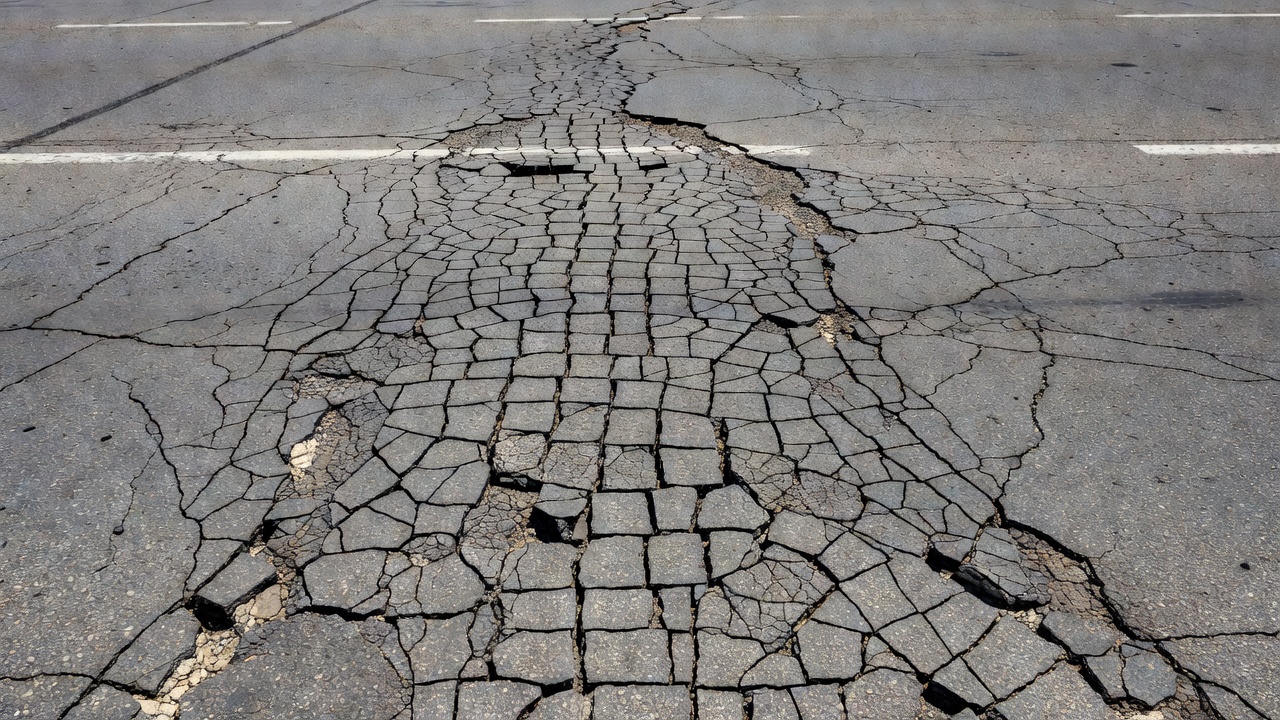
Fatigue Cracking (ACP Distress Type 1) , also known as alligator cracking or load-associated cracking, is the most significant visual proxy for structural degradation in flexible pavements. The FHWA LTPP DIM defines fatigue cracking as interconnected cracks forming a pattern resembling chicken wire or alligator hide, occurring initially in the wheel paths and propagating outward as structural deterioration progresses. The mechanism is well understood: repeated traffic loading generates tensile strains at the bottom of the asphalt layer that exceed the fatigue endurance limit of the asphalt mixture, initiating cracks that propagate upward through the layer. The surface expression of these cracks — their density, width, interconnectivity, and extent — serves as a proxy for the cumulative fatigue damage sustained by the pavement structure.
The proxy relationship between fatigue cracking and structural condition is graded by severity level in the DIM. Low Severity fatigue cracking (LTPP Level L) is defined by fine longitudinal hairline cracks running parallel to each other with no or only light spalling, covering less than 30% of the affected area. This serves as a proxy for early-stage fatigue damage where the crack initiation phase has occurred but significant structural degradation has not yet developed. Moderate Severity fatigue cracking (Level M) features a well-defined pattern of interconnected cracks that may exhibit light spalling and cover 30-50% of the affected area. This serves as a proxy for advanced fatigue damage where crack propagation is significant, load distribution efficiency is reduced, and water infiltration is occurring through the interconnected crack network. High Severity fatigue cracking (Level H) exhibits a severely interconnected crack pattern with significant spalling, loss of material, and potential pumping of fines through the cracks under traffic. This serves as a proxy for near-complete structural failure where the pavement section has lost most of its load-carrying capacity and requires major rehabilitation.
The correlation between fatigue cracking extent and structural capacity has been validated through extensive research. The FHWA LTPP Seasonal Monitoring Program collected FWD deflection data alongside distress surveys at test sections across North America and found that areas with High Severity fatigue cracking showed 40-60% higher maximum deflections compared to uncracked areas on the same pavement section, indicating significant structural degradation. However, the relationship is not linear — a pavement can exhibit substantial fatigue cracking while still maintaining adequate structural capacity if the cracking is confined to the surface layer (e.g., thin surfacing over a structurally sound base). This is why the DIM distinguishes between fatigue cracking in the wheel path (load-associated) versus fatigue cracking outside the wheel path (which may be due to non-load factors such as material shrinkage or construction deficiencies), and why the crack pattern — the characteristic alligator pattern — is specifically diagnostic of structural fatigue.
Rutting (ACP Distress Type 9) is a visual proxy for structural deformation of the pavement under traffic loading. The DIM defines rutting as a longitudinal surface depression in the wheel path. Rutting can result from two distinct mechanisms: structural rutting caused by deformation of the subgrade or unbound base layers, and instability rutting caused by shear flow within the asphalt layer itself. The visual observation of rutting — measurable as the maximum vertical depression relative to the surrounding surface — serves as a proxy for these mechanisms, but distinguishing between structural and instability rutting from visual observation alone requires additional information. Rut depth measurement is specified in the DIM using a straightedge and wedge, with severity levels defined as Low (6-13 mm), Moderate (13-25 mm), and High (>25 mm). However, the rut depth itself is a direct observation — it is the interpretation of that depth as an indicator of structural adequacy or mixture stability that constitutes the proxy inference.
Edge Cracking (ACP Distress Type 3) is a visual proxy for loss of lateral support at the pavement edge. The DIM defines edge cracking as longitudinal cracks occurring within 0.6 m of the pavement edge, typically parallel to the edge and often crescent-shaped. Edge cracking serves as a proxy for inadequate shoulder support, base drainage problems at the pavement edge, or subgrade weakness extending from the shoulder area. The severity of edge cracking — measured by crack width, spalling, and the extent of cracking along the edge — correlates with the degree of edge support loss and the urgency of shoulder rehabilitation.
Faulting (JCP Distress Type 12) is a visual proxy for load transfer degradation at transverse joints and cracks in concrete pavements. The DIM defines faulting as the difference in elevation across a joint or crack, caused by pumping of fine material from beneath the slab under traffic loading. Faulting is measured using a faultmeter per the procedures specified in Appendix B of the DIM, with severity levels defined as Low (3-6 mm), Moderate (6-10 mm), and High (>10 mm for jointed PCC; >6 mm for CRCP). The faulting measurement is a direct observation, but its interpretation as a proxy for load transfer efficiency (LTE) between adjacent slabs is an engineering inference. Research has shown that faulting of 5 mm or greater typically corresponds to LTE values below 60%, indicating that the joint no longer provides effective load transfer and the slabs are behaving independently under traffic — significantly increasing tensile stresses and accelerating cracking.
Proxies for Water Damage
Water damage in pavements manifests through multiple visual proxies that indicate the presence, movement, or effects of moisture within the pavement structure. Understanding these proxy relationships is critical because water damage is one of the most pervasive and costly deterioration mechanisms in both asphalt and concrete pavements, yet the water itself is rarely visible from the surface.
Water Bleeding and Pumping (ACP Distress Type 15) is the most direct visual proxy for the presence of free water within the pavement structure. The DIM defines this distress as the ejection of water and fine material from the pavement layers through cracks under traffic loading. The visual observation of water pumping through cracks — typically identifiable by the presence of stained areas or fine material deposits on the pavement surface adjacent to cracks — serves as a proxy for several conditions: the existence of free water within the pavement structure, the loss of fine aggregate from the base or subgrade (erosion of support), the presence of interconnected void spaces that allow water movement, and high pore water pressures generated by traffic loading. The DIM notes that water bleeding and pumping can coexist with other distress types — particularly fatigue cracking (because the cracks provide the pathway for water egress) and faulting (because pumping removes the fine material that provides joint support in concrete pavements).
Pumping in concrete pavements (also addressed within JCP Distress Type 16 — Water Bleeding and Pumping) is a visual proxy for the erosion of subbase material from beneath the concrete slab. The visual indicators include: soil stains on the pavement surface at joints and cracks, fine material deposits extending from joints, slab edge settlements, and faulting development. Pumping occurs when water enters the joint or crack system, becomes trapped beneath the slab under traffic loading, and is ejected at high velocity as the slab deflects — carrying fine subbase particles with it. Over repeated load applications, this pumping action erodes the subbase, creating voids beneath the slab that lead to loss of support, increased slab deflection, accelerated fatigue cracking, and eventually slab corner breaks. The visual observation of pumping is thus a proxy for subbase erosion rates and the progressive loss of slab support.
Stripping — the loss of adhesion between asphalt binder and aggregate due to moisture — is a critical water damage mechanism that has limited surface visibility in its early stages. As noted in the AMAP moisture damage white paper, stripping typically initiates at the bottom of the asphalt layer where water accumulates, and progresses upward through the layer thickness. The surface visual proxy for stripping is raveling — but only after the stripping has progressed to the point where surface aggregate particles are being dislodged. By the time raveling is visible on the surface, the stripping damage within the pavement depth is likely already substantial. This temporal lag between internal damage onset and surface expression is a fundamental limitation of surface visual proxies for moisture damage.
The Hamburg Wheel Tracking Test (AASHTO T 324) provides laboratory validation of the raveling-stripping proxy relationship. In the Hamburg test, compacted asphalt specimens are submerged in hot water (50°C) and subjected to repeated steel wheel loading. The test records rut depth as a function of wheel passes and identifies the stripping inflection point — the number of passes at which the rutting rate accelerates due to moisture-induced binder-aggregate bond failure. Research using Hamburg testing has demonstrated that mixtures susceptible to stripping can show no surface distress for thousands of load cycles in the test, then exhibit rapid raveling and material loss once the stripping inflection point is reached. This nonlinear behavior underscores the importance of understanding that the absence of surface raveling does not guarantee the absence of moisture damage — it may simply mean the stripping has not yet propagated to the surface.
Water Damage Proxy
Distress Type
Observable Indicator
Underlying Condition Inferred
Water bleeding/pumping
ACP 15 / JCP 16
Water ejection through cracks; stained surface; fine material deposits
Free water in pavement structure; base erosion
Raveling (moisture-related)
ACP 13
Aggregate dislodgement; pitted surface
Moisture-induced binder-aggregate adhesion loss
Pumping stains
JCP 16
Soil stains at joints/cracks
Subbase erosion; loss of slab support
Rutting with raveling
ACP 9 + 13
Deformation + aggregate loss in wheel path
Moisture weakening of asphalt layer
D-cracking
JCP 2 / CRCP 1
Cracking pattern adjacent to joints/cracks
Freeze-thaw deterioration of coarse aggregate
What is NOT Image-Assessable
The honest practice of visual proxy assessment requires explicit acknowledgment of what cannot be determined from surface images. TarmacView distinguishes between image-assessable properties — those for which validated visual proxies exist with known confidence intervals — and lab-only properties that require laboratory testing or instrumented measurement regardless of image quality or assessment methodology. This distinction is fundamental to the credibility of image-based inspection.
Asphalt Binder Content cannot be determined from surface images. The percentage of asphalt binder by weight of the total mixture is a laboratory property determined by extraction (AASHTO T 164) or ignition oven (AASHTO T 308) testing. While bleeding is a visual proxy for excess binder, and raveling is a visual proxy for binder deficiency, neither provides quantitative binder content. A pavement exhibiting bleeding could have binder content anywhere from slightly above optimum to significantly excessive, depending on the aggregate gradation, VMA, and construction history. Similarly, a raveling pavement could have adequate total binder content but suffer from binder oxidation, aggregate absorption, or moisture damage that renders the binder ineffective. The visual proxy indicates the presence of a condition consistent with binder content deviation, but it cannot quantify that deviation.
In-Place Density and Air Voids cannot be assessed from surface images. The density of the compacted pavement — expressed as a percentage of the theoretical maximum density (Gmm) — requires nuclear gauge testing (AASHTO T 310) or core sampling with bulk specific gravity measurement (AASHTO T 166). The air void content, which directly controls the pavement’s resistance to moisture damage, rutting, and fatigue cracking, cannot be inferred from surface appearance. Bleeding may indicate low air voids, but only if the bleeding is caused by traffic densification rather than construction over-asphalting. A pavement with 2% air voids and a pavement with 6% air voids can appear identical from the surface if neither exhibits visible distress.
Binder Performance Grade (PG) verification cannot be performed visually. The binder grade — e.g., PG 64-22, PG 70-28 — is determined through laboratory testing of binder samples using the Dynamic Shear Rheometer (DSR, AASHTO T 315), Bending Beam Rheometer (BBR, AASHTO T 313), and Rolling Thin-Film Oven (RTFO, AASHTO T 240). While certain distress patterns — rutting at moderate temperatures, thermal cracking in cold climates — may serve as gross indicators of binder grade inadequacy, they cannot confirm the actual grade. A pavement with PG 58-28 binder could exhibit the same distress patterns as one with PG 64-22 if the traffic loading or climatic conditions exceed the design assumptions for either grade.
Stripping Progression within the Pavement Depth is not discernible from surface images. As established in the water damage discussion, stripping initiates at the bottom of the asphalt layer and progresses upward. Surface raveling is an indicator that stripping may have reached the surface, but it cannot indicate the depth of stripping penetration within the layer. Determining the vertical extent of stripping requires coring and visual inspection of the core cross-section, which is destructive and point-specific.
Concrete Compressive Strength cannot be assessed from surface images of concrete pavements or structures. While scaling, spalling, and D-cracking may indicate concrete deterioration, they do not provide quantitative strength data. Compressive strength requires cylinder testing (ASTM C39), core testing (ASTM C42), or nondestructive testing such as the Schmidt rebound hammer (ASTM C805) or ultrasonic pulse velocity (ASTM C597). The visual appearance of concrete — color, surface texture, cracking pattern — provides qualitative indications of material quality but cannot substitute for strength testing.
Structural Layer Moduli cannot be determined from surface images. The resilient modulus of the asphalt layer, the modulus of the base and subbase, and the subgrade modulus are structural properties determined through back-calculation from FWD deflection data (ASTM D4694, D4695) or through laboratory repeated-load triaxial testing (AASHTO T 307). While extensive fatigue cracking is a visual proxy for structural degradation, it cannot provide the layer-specific modulus values required for mechanistic-empirical pavement design or remaining life analysis.
Bond Between Pavement Layers cannot be verified from surface images. Debonding between the asphalt surface layer and the underlying pavement — also known as delamination — may not produce any surface distress until the debonded area is large enough to cause the surface layer to crack and deflect independently under traffic. Ground Penetrating Radar (GPR, ASTM D4748) or coring is required to detect interlayer debonding. By the time surface cracking reveals the debonding, the area affected is typically already extensive.
Property
Assessment Method
Why Not Image-Assessable
ASTM/AASHTO Standard
Binder content
Ignition oven; extraction
No surface indicator quantifies binder %
AASHTO T 308; AASHTO T 164
Density / Air voids
Nuclear gauge; cores
Surface appearance unrelated to density
AASHTO T 310; AASHTO T 166
Binder PG grade
DSR; BBR; RTFO
Distress patterns are non-specific
AASHTO M 320; AASHTO T 315
Stripping depth
Coring; Hamburg test
Stripping initiates at bottom, propagates upward
AASHTO T 283; AASHTO T 324
Compressive strength
Cylinder; core; rebound hammer
No visual proxy for concrete strength
ASTM C39; ASTM C42; ASTM C805
Layer moduli
FWD back-calculation
Surface condition does not equal modulus
ASTM D4694; AASHTO T 307
Interlayer bond
GPR; coring
Debonding may have no surface expression
ASTM D4748
Reinforcement corrosion
Half-cell; GPR; chloride sampling
Surface cracking is a late-stage indicator
ASTM C876; AASHTO T 260
Validation of Visual Proxies
The reliability of visual proxy assessment depends on rigorous validation — the process of demonstrating that a visual observation consistently and accurately correlates with the target condition it purports to represent. Without validation, a visual proxy is merely an untested hypothesis. The structured validation framework applied to pavement visual proxies draws from established practices in medical diagnostic imaging, nondestructive evaluation (NDE), and psychometric measurement theory.
Face Validity is the most basic level of validation: does the visual proxy logically correspond to the target condition? Face validity is established through engineering reasoning and professional consensus. The proposition that extensive fatigue cracking is a proxy for structural damage has high face validity because the crack formation mechanism (tensile strain at the bottom of the asphalt layer under traffic loading) is physically linked to structural degradation. The proposition that a single surface crack is a proxy for structural failure has lower face validity because many non-structural factors (thermal contraction, reflection from underlying joints, construction shrinkage) can produce individual cracks without structural significance.
Concurrent Validity is established by comparing visual proxy ratings against independent measurements of the target condition obtained simultaneously. For pavement visual proxies, concurrent validity studies typically involve selecting test sections spanning a range of condition states, conducting independent visual distress surveys and instrumented measurements on the same sections, and statistically analyzing the agreement between the two assessment methods. A study validating fatigue cracking extent as a proxy for structural condition might compare visual crack area percentages against FWD deflection measurements on the same pavement sections. A strong correlation (e.g., R² > 0.7 between crack extent and deflection) provides evidence of concurrent validity.
Inter-Rater Reliability is a critical component of proxy validation because the value of a visual proxy depends on different assessors producing consistent results when evaluating the same pavement section. Inter-rater reliability is quantified using Cohen’s Kappa coefficient for categorical severity ratings (Low, Moderate, High) or the Intraclass Correlation Coefficient (ICC) for continuous measurements (crack area percentage, rut depth). The FHWA LTPP program has conducted extensive inter-rater reliability studies, with the DIM training and certification program requiring raters to achieve minimum agreement thresholds before being authorized to collect LTPP distress data. ASTM D5340 (Standard Test Method for Airport Pavement Condition Index Surveys) requires that PCI inspectors pass a certification exam demonstrating proficiency in consistent distress identification and severity rating.
Predictive Validity is the most demanding level of validation: does the visual proxy measurement at time T correlate with actual performance deterioration observed at time T+1, T+2, etc.? Predictive validity studies require longitudinal data — repeated distress surveys and performance measurements on the same pavement sections over multiple years. The LTPP program’s 30+ years of data from over 2,500 test sections provides the most comprehensive source of predictive validity evidence for pavement visual proxies. Studies using LTPP data have demonstrated, for example, that the initial crack extent in a pavement section is a statistically significant predictor of future crack progression rates and rehabilitation timing. Predictive validity coefficients in these studies typically range from r = 0.4 to r = 0.7 depending on the proxy type, pavement construction characteristics, and environmental conditions — indicating moderate to strong predictive capability but also confirming that visual proxies are not perfect predictors.
Validation Type
Definition
Pavement Proxy Example
Assessment Metric
Face validity
Logical correspondence between proxy and target
Fatigue cracking → structural damage
Engineering consensus
Concurrent validity
Agreement with independent measurement
Crack extent vs. FWD deflection
Correlation coefficient (R²)
Inter-rater reliability
Consistency across different assessors
Severity ratings by multiple inspectors
Cohen’s Kappa; ICC
Predictive validity
Correlation with future performance
Initial crack extent → future progression
Regression coefficient (r)
Content validity
Coverage of all relevant aspects
Multiple distress types → comprehensive condition
PCI deduct value coverage
Communicating Proxy Limitations
The ethical practice of visual proxy assessment requires transparent communication of what proxy observations can and cannot tell the infrastructure owner. TarmacView implements a structured communication framework that ensures every assessment output includes explicit metadata on proxy confidence, assessment boundaries, and measurement limitations — following the principles established in ASTM E2544 (Standard Terminology for Nondestructive Examinations) for reporting examination results with defined detection probabilities and false-positive rates.
Confidence Intervals are assigned to every visual proxy measurement based on validation study data. For example, a fatigue cracking extent measurement might be reported as “22% of wheel path area ± 4% (95% confidence level)” based on inter-rater reliability studies showing that experienced raters agree within ±4% for Moderate severity fatigue cracking. The confidence interval communicates the inherent uncertainty in the proxy measurement without implying false precision. ASTM E2544 Section 6.3 specifies that NDE results should include “the uncertainty associated with the measurement” and that “the examination method, technique, and acceptance criteria shall be documented.”
Explicit Proxy Mapping documents the relationship between each observable indicator and the condition it represents. The TarmacView assessment framework includes a metadata field for each distress classification that records: the direct observation (crack type, extent, severity), the engineering inference (structural fatigue, binder aging, moisture damage), the confidence level in that inference (High, Medium, Low, or Not Applicable), and the applicable standard reference (FHWA LTPP DIM distress type number, ASTM D5340 deduct value curve reference). This explicit traceability enables the infrastructure owner to understand exactly what each observation means and what it does not mean.
Lab-Only Designation clearly marks properties that cannot be assessed from visual data. When an assessment report indicates that the surface condition is consistent with potential stripping, the report must also explicitly state: “Stripping progression within the pavement depth cannot be confirmed from surface images. Core sampling and laboratory analysis (AASHTO T 283) are required to determine the vertical extent of moisture damage within the pavement structure.” Similarly, a report noting extensive raveling must clarify: “Binder content cannot be determined from surface observations. Laboratory extraction testing (AASHTO T 308) is required to confirm whether binder content is within specification limits.”
False Positive and False Negative Rates are documented for each proxy type based on validation studies. The false positive rate — the probability that the proxy indicates a condition that is not actually present — and the false negative rate — the probability that the proxy fails to detect a condition that is present — provide critical context for interpreting assessment results. For example, if polished aggregate visual assessment has a documented false positive rate of 15% (meaning 15% of sections identified as polished aggregate do not have friction values below the threshold), the assessment report should communicate this to prevent over-reaction to marginal observations.
Visual proxies form the foundation of the major pavement condition rating systems used worldwide. The most widely implemented of these is the Pavement Condition Index (PCI) , standardized in ASTM D5340 (Standard Test Method for Airport Pavement Condition Index Surveys) and ASTM D6433 (Standard Practice for Roads and Parking Lots Pavement Condition Index Surveys). The PCI system is a proxy-based assessment methodology in which every distress type observed on the pavement surface is a visual proxy for specific deterioration mechanisms, and the composite PCI score is itself a proxy for overall pavement condition.
The PCI methodology uses deduct value curves — empirical relationships between distress severity (Low, Moderate, High), distress extent (measured as area percentage, linear meters, or count depending on distress type), and a numerical deduct value that represents the impact of that distress on overall pavement condition. Each distress type has its own set of deduct value curves developed through expert panel studies and field validation. For example, the deduct value for Moderate severity fatigue cracking affecting 20% of the section area is approximately 40 points — meaning this distress alone would deduct 40 points from a perfect PCI score of 100. The deduct value curves embody the proxy relationship: they translate visual observations (crack extent, severity) into condition impact scores without requiring any instrumented measurements.
The corrected deduct value (CDV) procedure in ASTM D5340 accounts for the cumulative effect of multiple distress types on the same pavement section. The CDV recognizes that the presence of multiple visual proxies on the same section has a synergistic effect — the combined condition impact of fatigue cracking plus rutting plus raveling is greater than the sum of the individual deduct values because the interaction of multiple distress mechanisms accelerates overall deterioration. The CDV procedure applies a correction factor derived from the number of individual deduct values exceeding 5 points, with higher deductions for sections exhibiting multiple distress types.
TarmacView’s PCI Proxy methodology extends this framework by maintaining explicit traceability between each observable proxy and its deduct value contribution. The platform computes PCI using the same ASTM D5340 deduct value curves but adds confidence intervals to each deduct value based on the reliability of the visual proxy assessment for that specific distress type on that specific pavement construction. A section where fatigue cracking severity is assessed with High confidence receives a narrow confidence interval on the deduct value; a section where severity assessment is uncertain (e.g., due to lighting conditions or surface moisture obscuring fine cracks) receives a wider confidence interval. This approach provides the infrastructure owner with an honest representation of both the condition assessment result and the reliability of that assessment.
Condition Rating System
Visual Proxies Used
Output
Proxy Relationship
PCI (ASTM D5340/D6433)
All distress types by severity/extent
PCI score (0-100)
Deduct value curves translate observations to score
PASER (Asphalt)
Surface condition description
PASER rating (1-10)
Descriptive condition levels mapped to maintenance
FHWA LTPP
Distress type/severity/extent
Distress quantity data
Direct data collection, no composite score
ICAO Annex 14 / PCR
Surface condition for PCN reporting
Pavement Classification Rating
Visual + structural data combined
ASTM E3033 (Index for Bridge)
Concrete defects by type/severity
Bridge element condition index
Element-level condition proxy scoring
When Proxies Are Sufficient vs When Measurements Are Required
The decision to rely on visual proxies or require instrumented measurements depends on the assessment objective, the consequences of error, and the regulatory or contractual requirements governing the inspection. TarmacView provides decision framework guidance to infrastructure owners based on industry standards and best practices.
Visual proxies are sufficient when the assessment objective is: network-level condition screening and prioritization (PCI-based ranking across hundreds or thousands of pavement sections), identification of distress type and extent for treatment selection (fatigue cracking indicates structural overlay requirement; raveling indicates surface treatment requirement), routine condition monitoring to track deterioration rates over time (year-over-year comparison of crack extent progression), pre-screening to target detailed investigations (identifying the 10% of the network that warrants FWD testing), or maintenance program planning (budget allocation based on condition distribution across the network). These applications benefit from the speed, spatial coverage, and cost-effectiveness of visual proxy assessment, and the inherent uncertainty of proxy measurements is acceptable within the decision framework.
Instrumented measurements are required when the assessment objective demands: absolute material property values (modulus, binder content, density) for design or specification compliance verification, legal or forensic documentation requiring quantitative proof of condition at a specific point in time, structural capacity verification for load rating or pavement classification rating (PCR/PCN), quality assurance and quality control acceptance testing for new construction or rehabilitation, performance model calibration requiring lab-measured inputs for mechanistic-empirical design, or investigation of subsurface conditions not manifesting surface expression (base layer stripping, subgrade weakening, debonding). These applications require the quantitative precision that only instrumented methods can provide, and the cost and time of these methods are justified by the consequences of decision error.
The ASTM D5340 PCI procedure itself provides guidance on when instrumented measurements should supplement visual assessment. The standard notes that when the PCI is below 40 (Poor or Very Poor condition), FWD testing should be conducted to evaluate the structural capacity of the pavement and determine whether rehabilitation requires structural strengthening or can be limited to surface restoration. This guidance recognizes that at low PCI levels, the visual proxy assessment has confirmed the presence of significant deterioration, but the determination of the appropriate rehabilitation strategy requires quantitative structural information that visual proxies cannot provide.
Assessment Objective
Proxies Sufficient
Measurements Required
Rationale
Network screening
Yes
No
Speed and coverage prioritized over precision
Maintenance priority ranking
Yes
No
Ranking requires relative comparison, not absolute values
Treatment selection
Yes (type)
Yes (depth/thickness)
Distress type identifies treatment class; measurements size the treatment
Structural capacity determination
No
Yes (FWD, coring)
Visual condition does not equal structural capacity
The TarmacView platform implements a tiered assessment framework that guides users through the proxy-to-measurement decision process. Tier 1 assessment uses visual proxies exclusively for rapid network screening and condition ranking. Tier 2 assessment adds targeted instrumented measurements (FWD deflection testing, coring) on sections identified by Tier 1 as warranting detailed investigation — typically those in Poor or Very Poor condition, those exhibiting distress patterns consistent with structural failure, or those on critical routes where failure consequences are severe. Tier 3 assessment provides comprehensive laboratory and field testing for project-level design, specification compliance verification, or forensic analysis. Each tier builds on the previous one, ensuring that instrumented measurements are applied where they provide the greatest value while visual proxy assessment covers the network at the lowest sustainable cost. This tiered approach follows the principle of proportionate assessment — the level of assessment effort and precision is matched to the importance and condition of the asset being evaluated.
Frequently Asked Questions
A visual proxy is an observable surface characteristic captured through image inspection that serves as a surrogate indicator for a material property or structural condition that cannot be directly measured from visual data alone. For example, raveling — the dislodgement of aggregate particles from the pavement surface — is a visual proxy for loss of binder-aggregate adhesion. Crack area and pattern are visual proxies for structural fatigue damage. Bleeding is a visual proxy for excess binder migration to the surface. The FHWA LTPP Distress Identification Manual formalizes these relationships by defining standard distress types that correlate with specific failure mechanisms.
The FHWA LTPP DIM defines 19 distress types for asphalt concrete surfaces that function as visual proxies. Surface defect proxies include: bleeding (proxy for excess binder), polished aggregate (proxy for friction loss), and raveling (proxy for binder-aggregate loss). Cracking proxies include: fatigue cracking (proxy for structural failure under repeated loading), block cracking (proxy for age-hardened binder shrinkage), edge cracking (proxy for base/subbase support loss), longitudinal cracking (proxy for construction joint failure or subgrade movement), reflection cracking (proxy for underlying PCC slab movement), and transverse cracking (proxy for thermal contraction stress). Surface deformation proxies include: rutting (proxy for structural consolidation or shear flow) and shoving (proxy for lateral instability).
Several critical pavement properties cannot be assessed from surface images alone and require laboratory or instrumented measurement. These lab-only properties include: asphalt binder content (requires ignition oven or extraction testing per AASHTO T 308 or T 164), in-place density and air voids (requires nuclear gauge or core sampling per AASHTO T 166), binder performance grade verification (requires DSR, BBR testing per AASHTO M 320), moisture damage and stripping progression within the pavement depth (requires AASHTO T 283 or Hamburg wheel tracking), base and subgrade layer conditions (requires FWD or GPR), and concrete compressive strength (requires cylinder testing per ASTM C39). TarmacView explicitly distinguishes these as lab-only parameters.
Visual proxy validation follows a structured methodology adapted from medical diagnostic imaging standards and ASTM E2544 (Standard Terminology for Nondestructive Examinations). The four-tier framework includes: face validity — does the proxy logically correspond to the target condition (e.g., raveling logically indicates aggregate-binder separation); concurrent validity — comparison of visual proxy ratings against independent measurements (e.g., crack area proxy vs. FWD deflection measurements); inter-rater reliability — multiple raters produce consistent proxy assessments using Cohen's Kappa or ICC statistics; and predictive validity — the proxy's ability to predict future performance deterioration. ASTM D5340 (Standard Test Method for Airport Pavement Condition Index Surveys) incorporates inter-rater reliability checks within its certified PCI inspector training program.
Visual proxies are sufficient when the assessment objective is network-level condition screening, maintenance prioritization (PCI-based ranking), identification of distress type and extent for treatment selection, routine condition monitoring over time, or pre-screening to target detailed investigations. Instrumented measurements are required when the assessment objective demands absolute material property values (modulus, binder content, density), legal or forensic documentation requiring quantitative proof, structural capacity verification for load rating, quality assurance/quality control acceptance testing, performance model calibration requiring lab-measured inputs, or investigation of subsurface conditions not manifesting surface expression. The ASTM D5340 PCI procedure combines both: visual distress survey for deduct value calculation supplemented by FWD testing for structural capacity when PCI indicates poor condition.
TarmacView communicates proxy limitations through explicit metadata tagging on every assessment output. Each detected distress indicator is labeled with confidence intervals derived from validation studies. Assessment reports include a clear statement of what can and cannot be inferred from image-based observations, with references to FHWA LTPP standards. The platform distinguishes between observable proxies (directly measurable from images — crack width, area, type classification) and inferred conditions (deduced from proxy patterns — structural adequacy, remaining life estimates). All assessment outputs include measurement uncertainty quantification where applicable. TarmacView follows the ASTM E2544 standard for reporting nondestructive examination results, including detection probability and false-positive rates for each proxy type.
A direct observation is a physical characteristic that can be measured directly from an image with minimal inference — for example, crack width measured in millimeters, crack length in meters, or the area of a patch. A visual proxy is an observed characteristic that stands in for a condition that cannot be directly observed — for example, the extent of a polished aggregate surface is a proxy for friction coefficient (which requires a friction tester to measure directly), or the density of fatigue cracking is a proxy for the number of load cycles the pavement has experienced relative to its fatigue life. However, the boundary between direct observation and proxy can blur. A crack width measurement is a direct observation, but interpreting that width as an indicator of structural adequacy or load transfer efficiency is a proxy inference.
The Pavement Condition Index (PCI) per ASTM D5340 is fundamentally a proxy-based assessment system. PCI does not directly measure material properties, structural capacity, or remaining service life. Instead, PCI uses visual distress observations — each of which is a proxy for specific deterioration mechanisms — and combines them through a deduct value system to produce a numerical condition rating. The deduct value curves in ASTM D5340 were developed empirically from expert panels correlating visual distress severity/extent with perceived condition. The PCI score (0-100) is itself a composite proxy for overall pavement condition. TarmacView's approach extends this framework by maintaining explicit traceability from each observable proxy to its deduct value contribution, enabling users to understand which specific proxies drive the condition rating.
For portland cement concrete (PCC) pavements, the FHWA LTPP DIM defines these visual proxies: corner breaks (proxy for load-induced tensile stress at slab corners), durability cracking or D-cracking (proxy for freeze-thaw deterioration of coarse aggregate), longitudinal cracking (proxy for joint faulting, subgrade loss, or construction weakness), transverse cracking (proxy for restrained thermal or moisture shrinkage), joint seal damage (proxy for water infiltration and pumping potential), spalling of longitudinal and transverse joints (proxy for incompressible material infiltration or dowel bar corrosion), map cracking and scaling (proxy for surface freeze-thaw damage or improper finishing), polished aggregate (proxy for surface friction degradation), popouts (proxy for reactive aggregate or expansive particles), blowups (proxy for joint closure compressive failure), and faulting (proxy for load transfer degradation and pumping). Each serves as a visual indicator measurable from surface images.
Surface raveling — the progressive dislodgement of aggregate particles from the pavement surface — is a visual proxy for binder-aggregate adhesion deficiency. However, raveling cannot directly indicate the absolute binder content of the mixture. A pavement with adequate binder content can still exhibit raveling if the binder has aged and become brittle (oxidative hardening), if the aggregate surface chemistry is incompatible with the binder (moisture-induced stripping), if construction temperatures were too low (inadequate coating or compaction), or if the binder film thickness is non-uniform due to aggregate absorption. Research by GDOT (Georgia Department of Transportation) has developed raveling detection algorithms using 3D pavement surface data that quantify aggregate loss percentage as a finer proxy indicator than the conventional three-level severity classification. However, the definitive determination of binder content still requires ignition oven testing per AASHTO T 308.
Need Professional Pavement Condition Assessment?
TarmacView provides image-based infrastructure assessment using validated visual proxy methodology. Our platform identifies, quantifies, and reports observable distress indicators with clear communication of assessment boundaries and limitations.
A PCI proxy is a transparent, ordinal condition grade (1-5, Good-to-Serious) derived from visible image features — quality grade, crack geometry, and defect pre...
A pavement distress survey systematically identifies, classifies, and measures each distress type, severity, and extent on a pavement section following standard...
19 min read
Pavement Condition
PCI Survey
+2
Cookie Consent We use cookies to enhance your browsing experience and analyze our traffic. See our privacy policy.