Scaling (Concrete)
Concrete scaling is the deterioration of the upper pavement surface in Portland Cement Concrete (PCC) slabs, typically 3-13 mm deep, caused by freeze-thaw cycle...
17 min read
Concrete
Pavement
+4
Slab warping/curling is the upward (curling) or downward deflection of concrete slab corners and edges due to temperature and moisture gradients through the slab thickness. Curling reduces subgrade contact and increases corner stresses, contributing to corner breaks. Covers curling mechanism, seasonal effects, measurement (dipstick; LiDAR; profilometer), and detection in PCC inspection.
Curling and warping are two closely related but mechanically distinct forms of slab deformation in Portland cement concrete (PCC) pavements. Both describe the deviation of a concrete slab from its original flat geometry, resulting in a curved or distorted surface shape. The distinction lies in the driving mechanism.
Curling is the curvature induced in a concrete pavement slab as a result of a temperature gradient through the slab depth. The term specifically refers to deformation caused by differential thermal expansion or contraction between the top and bottom surfaces of the slab. When the top of the slab is warmer than the bottom (positive temperature gradient), the top expands relative to the bottom, causing the slab edges to curl downward. When the top is cooler than the bottom (negative temperature gradient), the top contracts relative to the bottom, causing the slab edges to curl upward.
Warping is the curvature caused by a moisture gradient through the slab depth, producing differential volume changes from drying shrinkage or moisture swelling. The top surface, exposed to ambient air and solar radiation, dries and shrinks relative to the bottom of the slab which remains moist from contact with the subgrade or a vapor retarder. Conversely, if the bottom of the slab absorbs moisture from a wet subbase while the top remains dry, the bottom expands relative to the top. In both cases, the differential volume change creates a warping moment that bends the slab.
| Feature | Curling | Warping |
|---|---|---|
| Driving mechanism | Temperature gradient | Moisture gradient |
| Primary cause | Thermal expansion/contraction | Drying shrinkage / wetting expansion |
| Time scale | Diurnal (daily cycles), rapid response | Long-term (months to years) |
| Reversibility | Largely reversible with temperature changes | Partially irreversible (drying shrinkage is permanent) |
| Magnitude contribution | 40–60 percent of total measured deflection | 40–60 percent of total measured deflection |
| Sensitivity to weather | High — responds to solar radiation, cloud cover, wind | Moderate — responds to ambient RH, rainfall, drainage |
In field practice, the measured slab deflection is almost always a combination of both temperature and moisture effects. The American Concrete Institute (ACI) and the National Ready Mixed Concrete Association (NRMCA) note that the terms curling and warping are often used interchangeably in field practice, with “curling” used generically to describe upward vertical deflections at slab edges regardless of the driving mechanism. However, proper engineering analysis requires distinguishing between the two because the mitigation strategies differ — thermal curling is addressed through joint spacing and slab thickness, while moisture warping requires mix design optimization and proper curing.
A third concept, built-in curling, refers to curvature that becomes locked into the slab during construction. This occurs because the concrete sets and hardens while a temperature gradient or moisture differential exists through the slab depth. The heat of hydration during cement curing creates an internal temperature rise, and if the surface cools faster than the interior (which is typical in most placements), a temperature differential develops while the concrete is still plastic. When the concrete gains sufficient strength to resist further deformation, the existing curvature is “frozen” into the slab. This built-in curl then combines with diurnal thermal curl and long-term moisture warp to create the total measured slab curvature. The FHWA Long-Term Pavement Performance (LTPP) studies have identified built-in curling as a significant contributor to early-age cracking and reduced pavement life.
The curling phenomenon is fundamentally governed by the thermo-mechanical behavior of concrete as a material. Concrete has a coefficient of thermal expansion (CTE) typically ranging from 6 to 13 microstrain per degree Celsius (με/°C), depending on aggregate type. Limestone aggregates produce lower CTE values (6–8 με/°C), while quartzite and siliceous aggregates produce higher values (10–13 με/°C). When a temperature differential exists through the slab depth, the warmer side expands more than the cooler side, creating a differential strain that forces the slab to curve.
The governing equation for curling deflection at the slab edge, based on the Westergaard curling theory (1927) as modified by Bradbury and implemented in the FHWA HIPERPAV model, is:
Ye = (1 + ν) × α × ΔT × ℓ² / h
Where:
The radius of relative stiffness (ℓ) is a fundamental parameter that describes the slab’s resistance to bending under load:
ℓ = ⁴√[E × h³ / (12 × (1 − ν²) × k)]
Where:
The Westergaard equation shows that curling deflection increases with the square of the radius of relative stiffness (ℓ²), meaning that stiffer subgrades (higher k-value) reduce curling by decreasing ℓ. The deflection is also directly proportional to the temperature differential (ΔT) and the CTE (α), and inversely proportional to slab thickness (h). A positive temperature gradient (daytime — top warmer than bottom) produces a positive ΔT, causing the slab to curl downward at the edges with the center lifting upward. A negative temperature gradient (nighttime — top cooler than bottom) produces a negative ΔT, causing upward curling at the edges.
The daily cycle of curling follows a predictable pattern. During the afternoon peak solar radiation (typically 1:00–3:00 PM), the positive temperature gradient reaches its maximum, often ranging from 5°C to 15°C (9°F to 27°F) depending on ambient temperature, solar intensity, wind speed, and slab color. As the sun sets, the surface begins to cool, and the gradient decreases. By late evening, the gradient reverses as the surface continues to radiate heat while the slab interior retains warmth from the day’s solar gain. The maximum negative gradient (maximum upward curling) typically occurs 2–3 hours before sunrise, when the surface has cooled to its minimum temperature while the slab bottom remains at near-constant temperature from the ground heat sink.
The FHWA TechBrief on Curling and Warping (FHWA-HIF-10-010) reports that the diurnal temperature gradient in typical PCC pavements ranges from −0.3°C/cm to +1.0°C/cm (−1.6°F/in to +5.5°F/in) through the slab depth. The magnitude of daily curling deflection is typically 15–25 percent of the total slab curvature, with the remainder attributed to built-in curl and moisture warping.
Moisture warping is driven by differential drying shrinkage through the slab depth. When the top surface of a concrete slab is exposed to ambient air with relative humidity (RH) lower than the internal RH of the concrete (which is near 100 percent in fresh concrete), moisture evaporates from the surface. This moisture loss causes the surface layer to shrink. However, the bottom of the slab remains in contact with either the subgrade or a vapor retarder, maintaining near-saturated conditions. This differential creates a shrinkage gradient that produces a warping moment, curling the slab edges upward.
Research by Carlson (1934) established that moisture loss in concrete slabs is significant only in the top approximately 50 mm (2 in) of the slab, regardless of total slab thickness. The shrinkage gradient is therefore concentrated near the surface. The magnitude of the warping moment depends on several factors:
Research by Nagataki demonstrated that the largest shrinkage gradient occurs when the slab bottom rests on a wet subgrade while the top dries — the bottom absorbs moisture and expands while the top shrinks, creating a compounded warping moment. Janssen calculated that differential shrinkage alone produces an applied curling moment of approximately 2,500 in-lb per inch of slab width for an 200 mm (8 in) thick pavement, which is comparable to the moment produced by a moderate temperature gradient.
The subbase moisture condition is critical to warping behavior. Slabs placed on vapor retarders (polyethylene sheets) develop larger shrinkage gradients than those placed on absorptive subgrades because the bottom of the slab cannot lose moisture downward through the vapor barrier. The sealed bottom remains fully saturated while the top dries, maximizing the differential. This is why the ACI and NRMCA caution against placing vapor retarders directly beneath interior slabs on grade without a granular blotter layer.
The direction of slab deflection — upward or downward — depends on the sign of the gradient (temperature or moisture) through the slab depth. Understanding which condition prevails and when is essential for pavement evaluation because the two conditions produce fundamentally different effects on pavement performance.
| Condition | Gradient Sign | Top vs Bottom | Result | Critical Period |
|---|---|---|---|---|
| Nighttime / early morning | Negative (−) | Top cooler than bottom | Upward curling — edges lift | 2–3 hours before sunrise |
| Daytime (sunny afternoon) | Positive (+) | Top warmer than bottom | Downward curling — center lifts | 1:00–3:00 PM |
| Dry climate / low RH | Moisture gradient | Top drier than bottom | Upward warping — adds to thermal | Continuous (long-term) |
| Wet surface / rain event | Moisture gradient | Top wetted | Downward warping — may offset thermal | During and after precipitation |
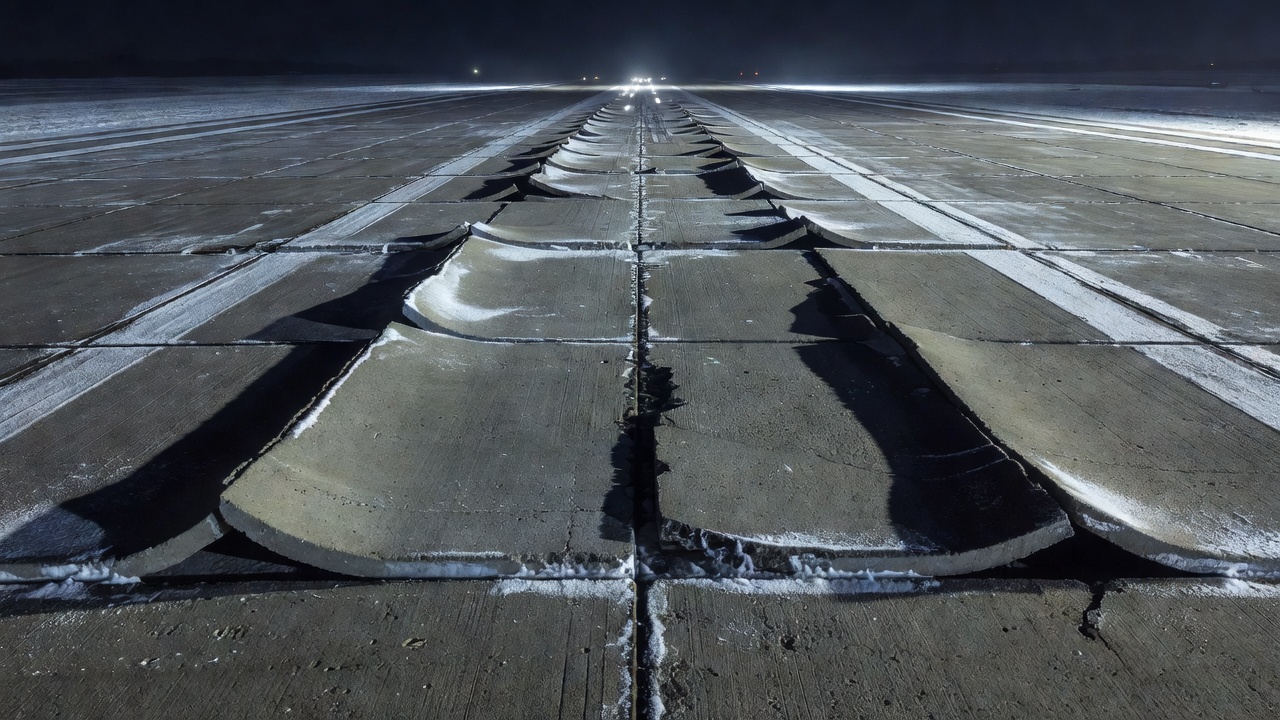
Upward curling is the more critical condition for pavement performance and distress development. When slab edges curl upward:
Downward curling produces different but also significant effects:
The criticality of upward curling versus downward curling explains why pavement condition surveys are often conducted during early morning hours — this is when upward curling is at its maximum, making loss of support, joint opening, and slab instability most visible to the inspector. Many airport pavement condition index (PCI) surveys following ASTM D5340 are performed in the morning specifically to capture the pavement in its most vulnerable state.
Curling directly degrades load transfer efficiency (LTE) across transverse and longitudinal joints. The upward deflection of slab corners reduces the contact area between adjacent slabs at the joint interface. For aggregate interlock joints (non-doweled), this reduction in contact area means fewer aggregate particles are engaged in shear load transfer from the loaded slab to the unloaded slab. When the joint opening exceeds 0.6 mm, aggregate interlock is effectively lost, and the joint behaves as if it has no load transfer mechanism.
For doweled joints, curling is less detrimental but still significant. Dowel bars provide positive mechanical load transfer regardless of joint opening, so doweled joints maintain higher LTE even under significant curling. However, the dowels can become locked if the curling creates binding at the dowel-concrete interface, or the dowels can become ineffective if the curling lifts the slab so much that the dowel is no longer properly engaged within the dowel socket. The FHWA Second-Generation Curvature Index (2GCI) method developed specifically to identify joints that are “working” versus “locked” based on the curvature-induced forces at the joint.
The combination of curling and traffic loading produces critically high tensile stresses at slab corners. When a slab corner curls upward, it becomes an unsupported cantilever projecting from the slab body. When a traffic load (aircraft landing gear or truck axle) is applied to this unsupported corner, the bending stress at the top surface of the slab at the corner is the sum of:
The total stress can exceed the concrete’s flexural strength (modulus of rupture) under a single heavy load application, or more commonly, exceed the fatigue strength under repeated load applications, leading to progressive crack development. The FHWA LTPP studies have shown that curling and warping stresses contribute significantly to the fatigue damage accumulation in PCC pavements and must be accounted for in mechanistic-empirical design procedures such as AASHTOWare Pavement ME Design and the FAA FAARFIELD program.
The void created beneath a curled slab corner alters the pavement’s structural behavior fundamentally. Instead of a slab supported on a continuous elastic foundation (the Westergaard model), the curled slab behaves as a slab with a discontinuous support condition — supported at the interior but unsupported at the edge and corner.
This unsupported condition enables pumping — the ejection of water and fine subbase material from beneath the slab through the joint. The mechanism operates as follows:
With each load application, more subbase material is removed. The void grows larger, the slab loses more support, and the corner stress increases further. This self-perpetuating cycle is one of the most damaging consequences of curling in PCC pavements.
The void detection protocol in FAA Advisory Circular 150/5320-6G Appendix C.15.6 uses the ISM ratio (Impulse Stiffness Modulus ratio) from Heavy Weight Deflectometer (HWD) testing. The ISM ratio compares the stiffness measured at the slab center to the stiffness measured at the slab corner. An ISM ratio (center/corner) greater than 3 indicates poor durability and significant loss of support beneath the corner. A ratio between 1.5 and 3 indicates questionable support, while a ratio below 1.5 indicates good support conditions.
Accurate measurement of slab curling is essential for pavement evaluation, condition assessment, and research into pavement behavior. Several measurement methods exist, each with different capabilities, resolution, and applicability.
The Dipstick is a manual walking profiler that measures the elevation difference between its front and rear footpads at each step. The footpad spacing is 304.8 mm (12 in), and the footpad diameter is approximately 32 mm (1.25 in). The operator walks the profiler along a planned path — typically along the slab edge parallel to the joint — and the instrument records the relative elevation at each step.
The Dipstick has specific gain characteristics that affect its measurement capability. It has zero gain at a wavelength of 0.305 m (1 ft), meaning features at this wavelength are invisible to the instrument. It has 0.63 gain at 0.61 m (2 ft) and 0.95 gain at 2 m (7 ft). The Nyquist limit — the shortest wavelength that can be reliably measured — is approximately 0.61 m (2 ft). Wavelengths shorter than the Nyquist limit are subject to aliasing, where short-wavelength features fold into longer wavelengths and create a 7–9 percent upward bias in the International Roughness Index (IRI).
The Dipstick is suitable for small-area, low-traffic, research-grade measurements where high precision is required. It can measure curling profiles along slab edges with sub-millimeter accuracy. However, it is too slow for network-level surveys and cannot be used on active runways during operations.
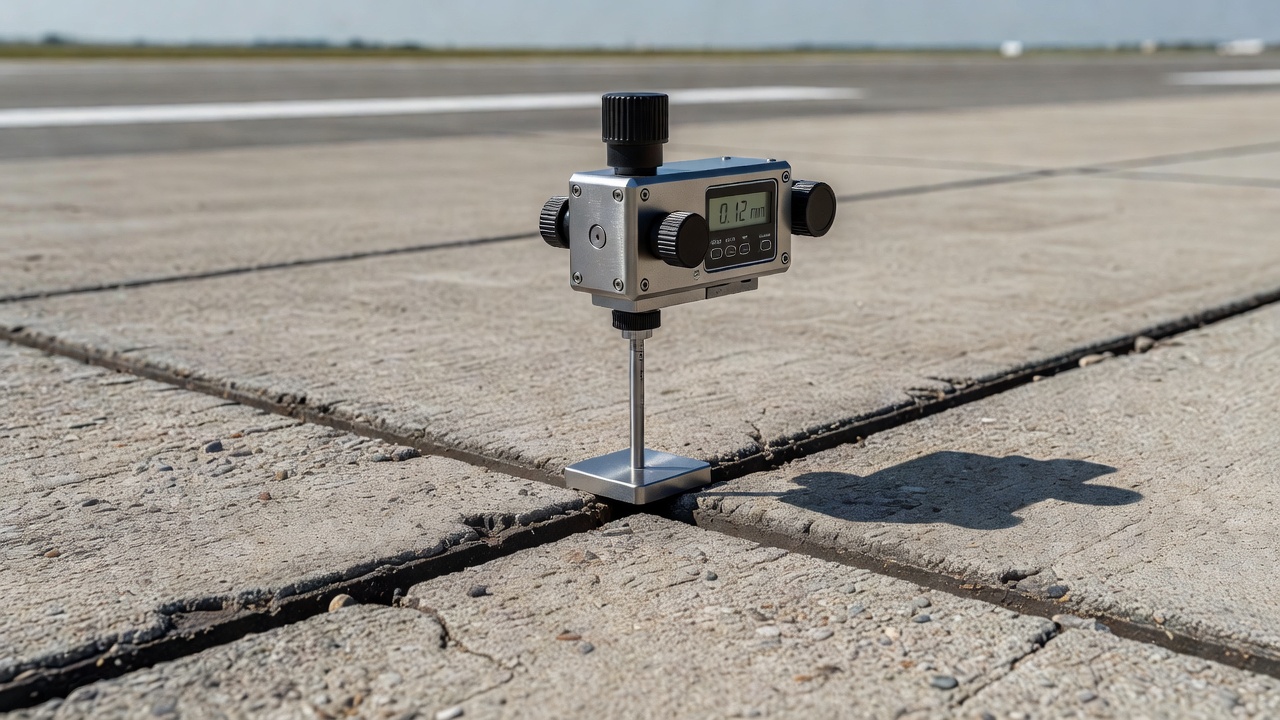
Traditional surveying methods using an automatic or digital level and graduated rod can measure slab edge elevations with sub-millimeter accuracy. The survey establishes a temporary benchmark and measures elevations at specified points — typically at slab corners, mid-edge, and slab center. The difference between the measured elevation profile and the theoretical flat plane defines the curling magnitude.
This method is time-consuming and limited to small areas (typically 10–50 slabs per survey day). It is best suited for research studies and forensic investigations rather than routine pavement management.
Inertial profilers mounted on survey vehicles measure pavement elevation profiles at traffic speed. These instruments comply with AASHTO M 328 and ASTM E950 standards and record elevation data at 25 mm (1 in) intervals — approximately 12 times more data points than the Dipstick within the same 304.8 mm distance. This higher resolution enables detection of narrow cracks and joints that the Dipstick bridges over due to its larger footpad spacing.
The key application of inertial profiler data for curling analysis is the Second-Generation Curvature Index (2GCI) method developed by the FHWA under the Accelerated Pavement Testing Program (Chang et al. 2008). The 2GCI method:
The testing protocol for 2GCI data collection requires a minimum of 5 consecutive passes at consistent speed, conducted on a clear sunny day following a clear night to maximize the thermal gradient signal. The 2GCI method captures both diurnal and seasonal curvature variations and has been validated through the FHWA/IPCC Phase I and Phase II studies conducted in Iowa.
LiDAR technology provides the most comprehensive measurement of slab curling by capturing three-dimensional surface topography at millimeter-scale resolution. Two LiDAR deployment methods are used for curling measurement:
Stationary LiDAR (tripod-mounted terrestrial laser scanning) is used for detailed, small-area investigations. A single scanner setup can capture the full surface of 5–15 slabs with point spacing of 2–5 mm. The resulting point cloud is processed to create a digital surface model, from which curling can be quantified by comparing the measured slab surface to a best-fit plane. The FHWA/IPCC Phase I study in Iowa used stationary LiDAR to develop the field measurement protocol for slab curling.
Mobile LiDAR (vehicle-mounted) and drone LiDAR (UAV-mounted) systems enable network-level surveys covering entire runways or taxiways in a single pass. Mobile LiDAR systems mounted on survey vehicles at 60–80 km/h can capture 100–500 points per square meter, sufficient to detect differential slab movement, edge lift, and support loss. Drone-based LiDAR provides access to areas that are difficult to reach with ground vehicles and can capture multiple flight lines for complete coverage.
The Falling Weight Deflectometer (FWD) for highways or Heavy Weight Deflectometer (HWD) for airports is used for void detection beneath curled slabs. The device drops a mass (typically 4,500–27,000 kg for HWD) onto a 300 mm or 450 mm diameter plate and measures the resulting pavement surface deflection using velocity transducers placed at radial distances from the load center.
The ISM ratio method compares the Impulse Stiffness Modulus measured at the slab center to that measured at the slab corner. A higher ratio indicates greater loss of support at the corner from upward curling. The FAA protocol in Appendix C.15.6 specifies that ISM ratios exceeding 3.0 indicate poor durability from loss of support and warrant further investigation.
The FWD/HWD is also used for backcalculation of layer moduli. However, the presence of curling significantly affects backcalculation results because the slab is not in full contact with the supporting layers. The backcalculated modulus of subgrade reaction (k-value) is typically underestimated for curled slabs because the effective support area is reduced. This must be accounted for in the analysis through appropriate correction factors or temperature-gradient-specific testing protocols.
The Rolling Wheel Deflectometer is a continuous deflection measurement device that operates at traffic speed. While still in the research stage for curling-specific measurement, the RWD has shown promise for identifying slabs with poor support conditions due to curling. The device measures the pavement surface deflection under a loaded truck tire using scanning laser sensors, providing continuous deflection profiles that can indicate areas of support loss.
The magnitude of slab curling varies widely depending on slab geometry, climate, material properties, and age. Documented field measurements from FHWA and ACI research provide the following ranges:
| Source | Measured Curl | Conditions |
|---|---|---|
| Suprenant (ACI Concrete International, 2002) | Up to 25 mm (1 in) at slab corners | Maximum observed field value |
| Suprenant (ACI Concrete International, 2002) | Typically 6 mm (1/4 in) | Typical field values for 8 in slab |
| FHWA 2GCI Study (2008) | Extreme PSG: −12.6 μstrain/cm (curled up) to +15.7 μstrain/cm (curled down) | All 38 test sites nationwide |
| FHWA 2GCI Study | Seasonal variation ≤ 8 μstrain/cm for mean PSG values | Less than diurnal range |
| FHWA TechBrief HIF-10-010 | Diurnal IRI impact up to 0.63 m/km; average 0.16 m/km | Curling effect on pavement roughness |
| FHWA faulting research | Daily expansion/contraction cycles: up to 0.5 mm faulting per year | From curling-induced joint movements |
| Joint opening threshold | 0.6 mm (0.024 in) | Opening at which aggregate interlock is lost |
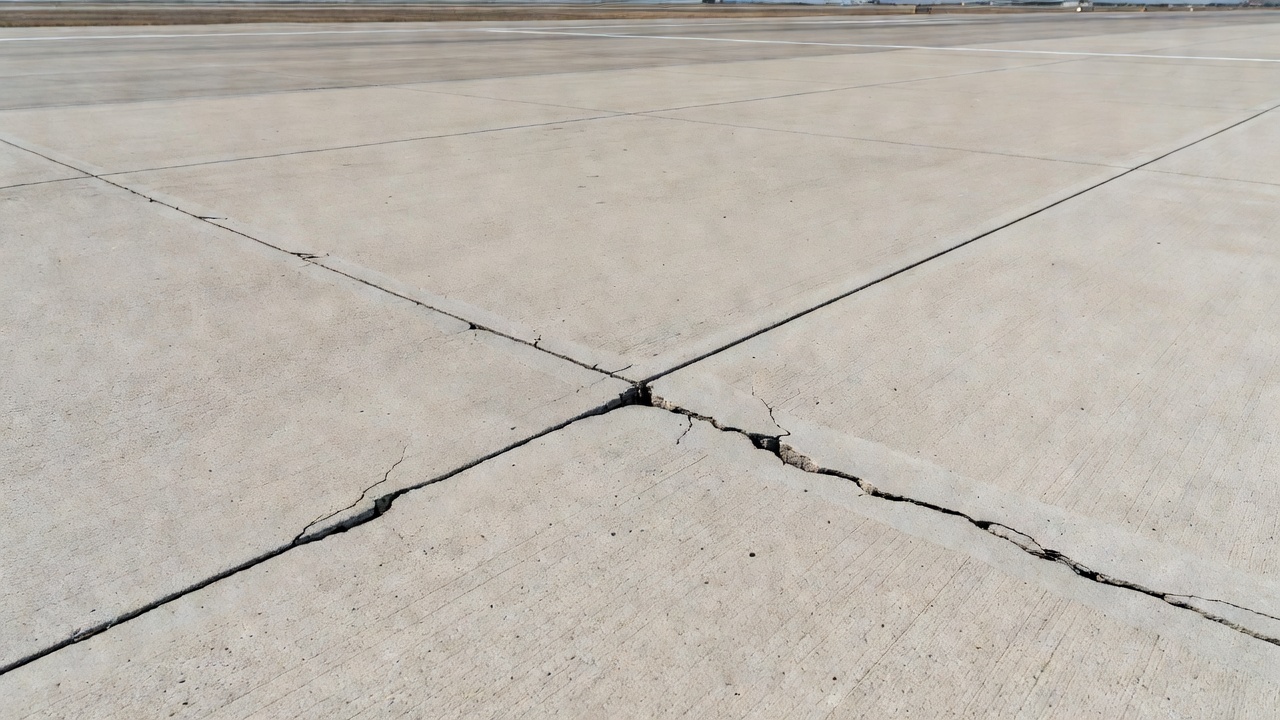
Corner breaks (Distress Type JCP 3 in the FHWA LTPP Distress Identification Manual) are diagonal cracks that intersect the PCC slab joints near the corner, typically within approximately 2 m (6 ft) of the corner intersection point, and extend through the full slab depth. The relationship between curling and corner breaks is direct and causal — curling is a primary contributing factor to corner break formation.
The mechanism of corner break formation under curling conditions follows a predictable sequence:
The contributing factors to corner break formation, as identified by the FHWA and Pavement Interactive, include:
The probability of corner breaks increases significantly with built-in upward curling. FHWA HIPERPAV studies have demonstrated that slabs with high built-in curl develop corner breaks at a much faster rate than slabs with low built-in curl, even under identical traffic loads.
The ASTM D5340 and ASTM D6433 PCI survey standards distinguish corner breaks from other cracking types by several features: corner breaks are always diagonal (not longitudinal or transverse), they intersect the joint at the corner (not a random location), they extend through the full slab depth (not surface-only), and the broken corner piece may be visibly displaced or loose. The severity classification depends on the crack width and whether the corner piece is loose or has been patched.
For airport pavements, corner breaks are a significant operational concern because the broken corner piece can become Foreign Object Debris (FOD) if it becomes completely detached. The FAA requires prompt repair of corner breaks that create FOD hazards, typically through full-depth slab replacement for high-severity breaks.
Curling and warping are specifically addressed in the FAA Advisory Circular 150/5320-6G (Airport Pavement Design and Evaluation, 2021) and the ICAO Aerodrome Design Manual Part 3 (Doc 9157) as fundamental considerations in rigid pavement design.
The FAA AC directly references curling and warping in three contexts: joint spacing rationale, void analysis protocol, and design procedures.
Joint spacing (Section 3.16) is explicitly based on the need to control cracking from temperature curling and moisture warping. The FAA states that joints are designed to “control cracking that develops due to … temperature curling and moisture warping.” The maximum joint spacing limits in Table 3-7 are derived from curling considerations:
Without Stabilized Base:
| Slab Thickness | Maximum Joint Spacing |
|---|---|
| ≤ 152 mm (6 in) | 3.8 m (12.5 ft) |
| 165–229 mm (6.5–9 in) | 4.6 m (15 ft) |
| > 229 mm (> 9 in) | 6.1 m (20 ft) |
With Stabilized Base (Cement-Treated or Lean Concrete):
| Slab Thickness | Maximum Joint Spacing |
|---|---|
| 203–254 mm (8–10 in) | 3.8 m (12.5 ft) |
| 267–330 mm (10.5–13 in) | 4.6 m (15 ft) |
| 343–406 mm (13.5–16 in) | 5.3 m (17.5 ft) |
| > 406 mm (> 16 in) | 6.1 m (20 ft) |
The FAA notes that joint spacing exceeding 6.1 m (20 ft) requires a technical analysis demonstrating that the panel size does not exceed 5 times the radius of relative stiffness. This limit ensures that curling stresses remain within acceptable bounds.
Void analysis (Appendix C.15.6) explicitly recognizes that “loss of support may exist … due to temperature curling or moisture warping.” The HWD testing protocol with ISM ratio analysis (described earlier in Section 5.5) is the standard method for detecting curling-induced voids beneath airport PCC slabs.
FAARFIELD design — the FAA’s rigid pavement thickness design procedure — uses three-dimensional finite element analysis (3D-FE) that implicitly accounts for curling effects through calibration from full-scale accelerated pavement testing at the National Airport Pavement Test Facility (NAPTF). The cumulative damage factor (CDF) calculated by FAARFIELD includes the effects of combined thermal and load-induced stresses based on the full-scale test results.
The ICAO Aerodrome Design Manual Part 3 (Doc 9157, 3rd Edition) provides pavement design guidance that references national standards (including FAA AC 150/5320-6G) for detailed curling and warping provisions. ICAO does not have a dedicated chapter on curling but manages curling effects through:
The ACR-PCR method (Aircraft Classification Rating — Pavement Classification Rating), adopted in FAA AC 150/5320-6G 2021 and standardized by ICAO for bearing strength reporting, uses a simplified structural analysis that accounts for pavement condition but does not explicitly model curling. However, the pavement condition surveys (PCI) that feed into the ACR-PCR rating include curling-induced distresses such as corner breaks, faulting, and pumping in the overall condition assessment.
Curling in airport PCC pavements has specific operational implications that differ from highway applications:
Mitigation of curling and warping requires a multi-faceted approach addressing design, materials, and construction. The most effective strategies are implemented during the design and construction phases because retrofitting curling mitigation after construction is difficult and expensive.
The most direct method for controlling curling is to limit the distance between contraction joints. The curling deflection at the slab edge is proportional to the square of the slab length (ℓ² term in the Westergaard equation). Halving the joint spacing reduces curling deflection by a factor of four. The NRMCA recommends a rule-of-thumb maximum joint spacing of 24 times the slab thickness (e.g., a 200 mm slab → 4.8 m joint spacing). The FAA Table 3-7 provides specific limits based on slab thickness and base type. Shorter joint spacing is particularly important for slabs on stabilized bases because the higher friction between slab and base increases restraint stresses.
Thicker slabs curl less because the self-weight of the slab provides a restoring moment that counteracts the curling moment from temperature and moisture gradients. The curling deflection in the Westergaard equation is inversely proportional to slab thickness (h). For airport pavements, the FAA minimum thickness is 150 mm (6 in) for aircraft under 60,000 lbs, with thicker sections required for heavier aircraft. However, increasing slab thickness also increases the radius of relative stiffness, which can partially offset the benefit — the relationship is complex and is best analyzed using mechanistic-empirical design software such as FAARFIELD or AASHTOWare Pavement ME Design.
Cement-treated bases (CTB) and lean concrete bases (LCB) provide stiffer support that reduces differential deflection under curling. The higher modulus of subgrade reaction (k-value) reduces the radius of relative stiffness (ℓ), which in turn reduces edge deflection. However, stabilized bases come with a trade-off: higher friction between the slab and the stabilized base increases restraint stresses, which can lead to increased cracking if joint spacing is not reduced accordingly. This is why the FAA Table 3-7 specifies tighter joint spacing for stabilized bases (12.5 ft for 8–10 in slabs) compared to unstabilized bases (20 ft for slabs > 9 in).
Concrete mix design has a significant impact on both curling and warping. The following mix design strategies reduce curling magnitude:
It is important to note that low water-to-cementitious materials ratio (w/cm) does NOT guarantee low shrinkage if the paste volume is high. A low w/cm mix with high paste content can exhibit greater shrinkage than a higher w/cm mix with lower paste content. Both w/cm and paste volume must be optimized.
Curing directly affects the moisture gradient that drives warping. Moist curing (wet burlap, fogging, ponding) or high-solids curing compound (minimum 25 percent solids per ASTM C309 Type 2) should be applied immediately after finishing to minimize the moisture differential through the slab depth. Delayed or inadequate curing allows the top surface to dry while the bottom remains moist, establishing a permanent shrinkage gradient that manifests as built-in warping. The ACI 308 Guide to Curing Concrete provides detailed recommendations for curing duration based on ambient conditions.
Several construction practices influence the magnitude of built-in curling:
While curling is a volume change phenomenon that cannot be prevented by reinforcement alone, properly designed reinforcement can distribute curling stresses and control crack widths:
Modern pavement inspection technologies enable detection and quantification of slab curling at network scale, providing data that was previously only available through labor-intensive manual surveys. Drone-based and LiDAR-based inspection methods are transforming how airport operators assess curling in their PCC pavements.
Unmanned Aerial Vehicles (UAVs) equipped with high-resolution cameras capture overlapping imagery of the pavement surface, which is processed through Structure-from-Motion (SfM) photogrammetry to create orthorectified mosaic images and digital surface models (DSMs). The DSM provides elevation data at 1–5 cm resolution across the entire pavement surface, from which curling can be detected:
LiDAR point cloud data provides the highest resolution measurement of slab curling. The point cloud is processed to extract individual slab surfaces, and a best-fit plane is computed for each slab. The deviation of each point from the best-fit plane defines the curling magnitude. Key indicators derived from LiDAR data include:
The FHWA IPCC Phase I study established that stationary LiDAR can detect curling with an accuracy of ±1 mm and a precision of ±0.5 mm, sufficient to quantify even low-severity curling that is not visible to the human eye.
Advanced pavement inspection systems (including TarmacView) use machine learning algorithms trained on LiDAR and photogrammetry data to automatically detect and classify curling severity. The classification criteria are based on the magnitude of edge lift or corner lift:
| Curling Severity | Corner/Edge Lift | Visual Detection | Pavement Management Action |
|---|---|---|---|
| None / Low | < 3 mm | Not visible to naked eye | Monitor during routine PCI surveys |
| Moderate | 3–6 mm | Slightly visible at joints under favorable lighting | Include in condition assessment; evaluate load transfer |
| High | 6–12 mm | Clearly visible; gap visible under slab edge | Schedule for evaluation; consider load transfer restoration |
| Severe | > 12 mm | Large gap visible; slab visibly dislodged | Priority repair; likely corner break formation |
LiDAR and drone survey data are most valuable when integrated with HWD testing. The LiDAR-identified curling locations guide the HWD testing program, ensuring that test points are placed at slabs with known curling rather than at random locations. The combination of surface geometry data (from LiDAR) and structural response data (from HWD) provides a complete picture of curling’s effect on pavement structural capacity. The FAA ISM ratio threshold of 3.0 can be correlated with the LiDAR-derived curling magnitude to establish site-specific criteria for void identification and repair prioritization.
Thermal imaging cameras mounted on drones add another dimension to curling detection. Infrared thermography captures the surface temperature of each slab, revealing the temperature gradient pattern that drives curling. Slabs with anomalous temperature distributions (hot spots at joints, non-uniform cooling patterns) may be more susceptible to curling damage. The combination of thermal data with LiDAR geometry data enables a comprehensive curling assessment that considers both the cause (temperature gradient) and the effect (edge lift).
| Parameter | Value Range | Notes |
|---|---|---|
| Concrete CTE | 6–13 με/°C | Depends on aggregate type; limestone: 6–8, quartzite: 10–13 |
| Typical temperature gradient | −0.3 to +1.0°C/cm | Diurnal variation through slab depth |
| Radius of relative stiffness (ℓ) | 500–2000 mm | Depends on E, h, and k |
| Typical edge lift (field) | 3–6 mm | 6 mm typical, up to 25 mm maximum observed |
| Joint opening for interlock loss | > 0.6 mm | Total loss of aggregate interlock |
| Dipstick sampling interval | 304.8 mm (12 in) | Also the Nyquist wavelength limit |
| Inertial profiler interval | 25 mm (1 in) | 12× Dipstick resolution |
| LiDAR curling accuracy | ±1 mm | Stationary terrestrial laser scanning |
| ISM ratio threshold (poor) | > 3.0 | FAA void detection criterion |
| IRI impact from curling | Up to 0.63 m/km | Average 0.16 m/km per FHWA study |
| Max joint spacing (FAA) | 3.8–6.1 m | Depending on thickness and base type |
| Corner break crack angle | 30–45° | Diagonal from joint intersection |
| Critical monitoring time | 2–3 hours before sunrise | Maximum upward curling period |
TarmacView provides AI-powered pavement inspection solutions that automatically detect and classify distresses like curling, warping, corner breaks, and joint deterioration in concrete airport pavements using LiDAR and high-resolution imaging. Schedule a demonstration to see how our technology can enhance your pavement management program.
Concrete scaling is the deterioration of the upper pavement surface in Portland Cement Concrete (PCC) slabs, typically 3-13 mm deep, caused by freeze-thaw cycle...
A blowup is a localized upward buckling or shattering of concrete pavement at a transverse joint or crack during hot weather, caused when compressive stresses f...
Map cracking (also called crazing) is a network of shallow, fine, interconnected cracks on the concrete surface forming an irregular pattern. In FHWA LTPP, map ...