What is Candlepower Distribution?
Candlepower Distribution – Pattern of Luminous Intensity Variation in Photometry
Definition and Overview
Candlepower distribution describes how the luminous intensity of a light source or luminaire varies with direction in three-dimensional space. Measured in candelas (cd), it quantifies the visible light emitted in specific directions. Candlepower distribution is typically visualized with polar graphs or tables that display how intensity changes as you move around the light source, enabling lighting professionals to predict and control illumination patterns, uniformity, glare, and efficiency in real environments.
This concept is essential in lighting design for spaces such as airports, terminals, hangars, and architectural interiors, where the spatial delivery of light impacts both functionality and user comfort. Two fixtures with the same lumen output may perform very differently if their candlepower distributions vary, affecting how well a space is illuminated or how visible key features are. Candlepower distribution is also foundational in regulatory standards and lighting simulation software, guiding compliance and optimal design.
The term “candlepower” has historical roots in the intensity of a standard candle. Today, the SI unit “candela” is used, but “candlepower” persists in industry references.
Fundamental Concepts
Luminous Intensity (Candela)
Luminous intensity is the core photometric quantity for candlepower distribution, representing the amount of visible light emitted in a particular direction, measured in candelas (cd). One candela equals one lumen per steradian. Unlike total luminous flux, which sums light in all directions, intensity is strictly directional, a key distinction when modeling how fixtures illuminate specific areas or tasks.
The candela is precisely defined by the SI as the luminous intensity, in a given direction, of a source emitting monochromatic radiation at 540 × 10¹² Hz with a radiant intensity of 1/683 watt per steradian. This ensures consistency in measurement and fixture comparison worldwide.
Candlepower Distribution Curve
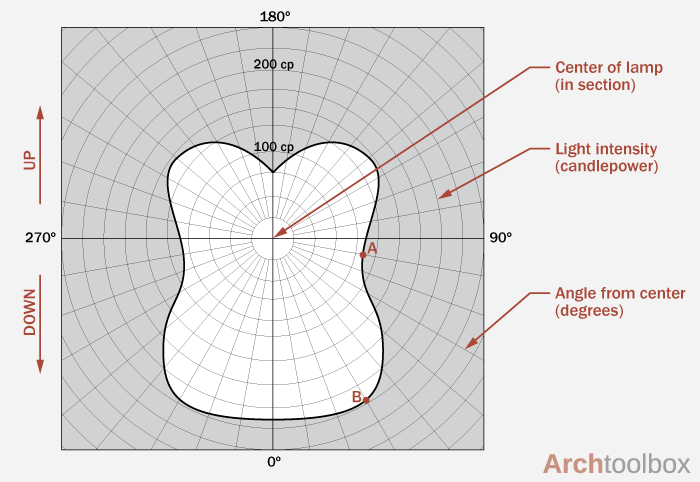
A candlepower distribution curve graphically displays how luminous intensity from a light source changes with observation angle. Most often plotted in polar coordinates, the curve’s radius at any angle represents the intensity in candelas in that direction. The curve’s shape reveals how focused or diffuse the light is, and whether it’s symmetric or asymmetric.
- Narrow, tall peak: Focused beam (spotlight)
- Broad, flat curve: Diffuse, general illumination
- Asymmetric: Directional emphasis, e.g., wall washing
Manufacturers provide these curves and accompanying tables for each luminaire, enabling designers to visually and numerically assess performance.
Light Distribution Patterns
Distribution patterns describe how a fixture emits light, determined by its optical design. Patterns can be narrow or wide, symmetric or asymmetric, and are shaped by reflectors, lenses, and diffusers. Symmetric patterns suit general lighting, while asymmetric patterns direct light for specific tasks (e.g., wall washing or signage). In aviation, precise patterns ensure safety and operational efficiency, such as wide, uniform apron lighting or tightly controlled approach lights.
Measurement Methods
Goniophotometry
Goniophotometry is the primary technique for measuring candlepower distribution. A goniophotometer rotates the light source or detector in precise increments, recording luminous intensity at each angle around the fixture. The instrument can scan both vertical and horizontal planes, compiling a full three-dimensional map of intensity.
Types of goniophotometers (per CIE classification) vary in axis arrangement, but Type C (with stationary light source) is most common for general lighting. The collected data forms the basis for candlepower curves, tables, and digital photometric files.
Industry Standards: IES LM-79-08
IES LM-79-08 sets the industry protocol for measuring photometric performance of solid-state lighting, including candlepower distribution. It prescribes measurement methods, angular resolution, environmental conditions, and data formats, ensuring results are accurate and comparable across manufacturers and markets. LM-79 compliance is mandatory for product certification and often referenced in procurement, especially for safety-critical environments like aviation.
Data Representation: Polar Graphs and Tables
Candlepower distribution data is typically shown as:
- Polar graphs: Circular plots with radius indicating intensity at each angle.
- Tabular data: Lists of intensity values at regular angular increments.
These formats allow visual assessment and computational modeling, supporting simulation, design, and compliance.
Interpretation and Use
Reading Candlepower Distribution Curves
Interpreting a candlepower curve involves understanding its axes and shape. The center of the polar plot represents the light source, the distance to the curve at any angle shows intensity in that direction.
- 0° (reference axis): Usually vertical or nadir
- Shape: Indicates beam width (narrow/focused vs. wide/diffuse)
- Symmetry: Shows whether distribution is even in all directions
- Upper/lower halves: Upward (indirect) vs. downward (direct) light
Designers use these conventions to select and aim fixtures for optimal effect and regulatory compliance.
Key Parameters: CBCP, Beam Angle, Symmetry
- CBCP (Center Beam Candlepower): Maximum intensity, usually on-axis.
- Beam Angle: Angle between directions where intensity falls to 50% of CBCP, defines the main beam’s spread.
- Field Angle: Where intensity drops to 10% of CBCP, defines total spread.
- Symmetry: Whether the pattern is identical in all directions.
These parameters help compare fixtures and design lighting layouts for specific needs.
Photometric Data Files: IES, EULUMDAT
Photometric files store detailed candlepower data for use in simulation software:
- IES files (.ies): Standard in North America, widely used globally.
- EULUMDAT files (.ldt): European standard.
- Both formats enable accurate modeling, design, and compliance verification.
Practical Applications
Lighting Design and Fixture Selection
Candlepower distribution data guides fixture selection, layout, and performance analysis. Two fixtures with the same lumen output can create different effects if their distributions differ.
- Fixture Comparison: Assess beam focus and coverage.
- Spacing/Layout: Ensure uniformity and minimize shadows.
- Aiming/Orientation: Achieve desired effects, avoid glare.
- Glare Control: Analyze high-angle values to reduce visual discomfort.
Incorporating this data ensures efficient, comfortable, and compliant lighting systems.
Use Cases and Examples
- Spotlight vs. Area Light: Spotlights have high CBCP and narrow beams for accent lighting, area lights have lower CBCP and wide beams for general illumination.
- Batwing Distribution: Fixtures with peak intensity off-axis (batwing shape) maximize uniformity and minimize glare, ideal for offices.
- Asymmetric Distribution: Wall washers direct light mostly to one side for vertical surface illumination.
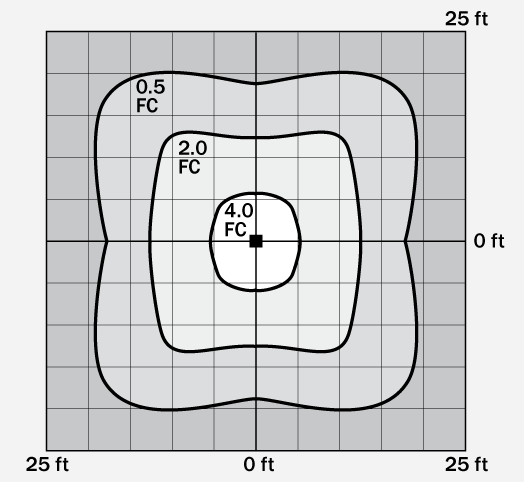
- Outdoor Area Lighting: Isocharts derived from candlepower data help achieve uniform outdoor lighting for safety and operations.
Common Light Distribution Patterns
- Spot: High CBCP, narrow beam (<20–40°), focused illumination for accents or precise tasks.
- Flood: Lower CBCP, wide beam (>40–120°), uniform area lighting.
- Batwing: Off-axis peaks, minimizes glare, maximizes uniformity.
- Asymmetric: Directs light primarily in one direction for specialized tasks.
Summary
Candlepower distribution is a vital concept in lighting, describing how intensity varies with direction and enabling designers to optimize both the technical and experiential quality of illumination. By understanding and applying candlepower curves, goniophotometry, industry standards, and photometric files, professionals ensure that lighting systems are safe, efficient, visually comfortable, and tailored to each environment’s unique requirements.
Frequently Asked Questions
- What does candlepower distribution show in lighting?
- Candlepower distribution shows how the intensity of light (in candelas) varies with the angle around a fixture. It helps lighting designers and engineers understand where light is concentrated, identify beam focus or spread, and select fixtures that provide the desired illumination pattern for specific applications.
- How is candlepower distribution measured?
- Candlepower distribution is measured using a goniophotometer, which records luminous intensity at various angles around a light source. Data is presented as polar graphs or tables, often following industry standards like IES LM-79-08, ensuring accuracy and consistency for product comparison and compliance.
- Why are candlepower distribution curves important in aviation lighting?
- In aviation, precise control of light distribution is crucial for safety, visibility, and operational efficiency. Candlepower curves ensure that runway, apron, and terminal lighting meets regulatory and performance requirements, minimizing glare, maximizing uniformity, and enhancing visual cues for pilots and ground crews.
- What is the difference between beam angle and field angle?
- The beam angle is the width of the main beam where intensity is at least 50% of the peak (CBCP), while the field angle extends to where intensity drops to 10% of peak. Beam angle defines the primary illuminated area, and field angle indicates total light spread including spill.
- What are IES files and how are they used?
- IES files (.ies) are digital files containing detailed candlepower distribution data for luminaires, standardized by the Illuminating Engineering Society. Designers use IES files in simulation software to model light distribution, verify compliance, and optimize layouts for real-world lighting projects.
This is a reference entry. TarmacView provides drone inspection services and doesn't sell the equipment or materials described in this glossary.