products
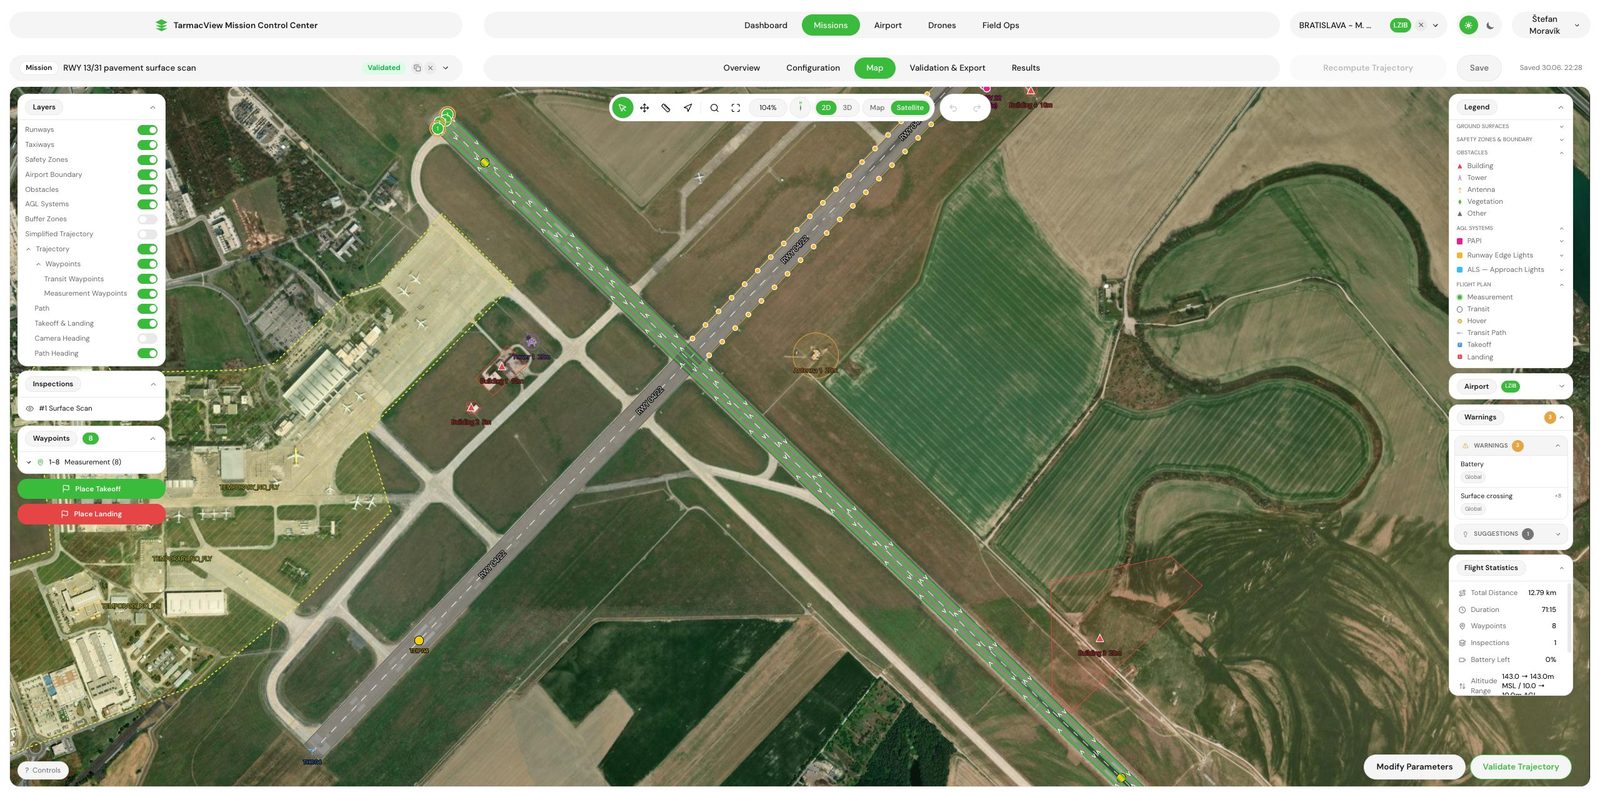
Runway Surface Scan by Drone at a Known Resolution
Runway and taxiway pavement scan by drone at a known ground resolution, in active development. The platform already plans flights and georeferences…
AUG 03 2026
11 MIN
The service is in active development. The platform already plans the flights and captures drone and ground imagery over a window of one to two hours, georeferenced and retained. Crack detection is close to a first MVP and finds cracks only.
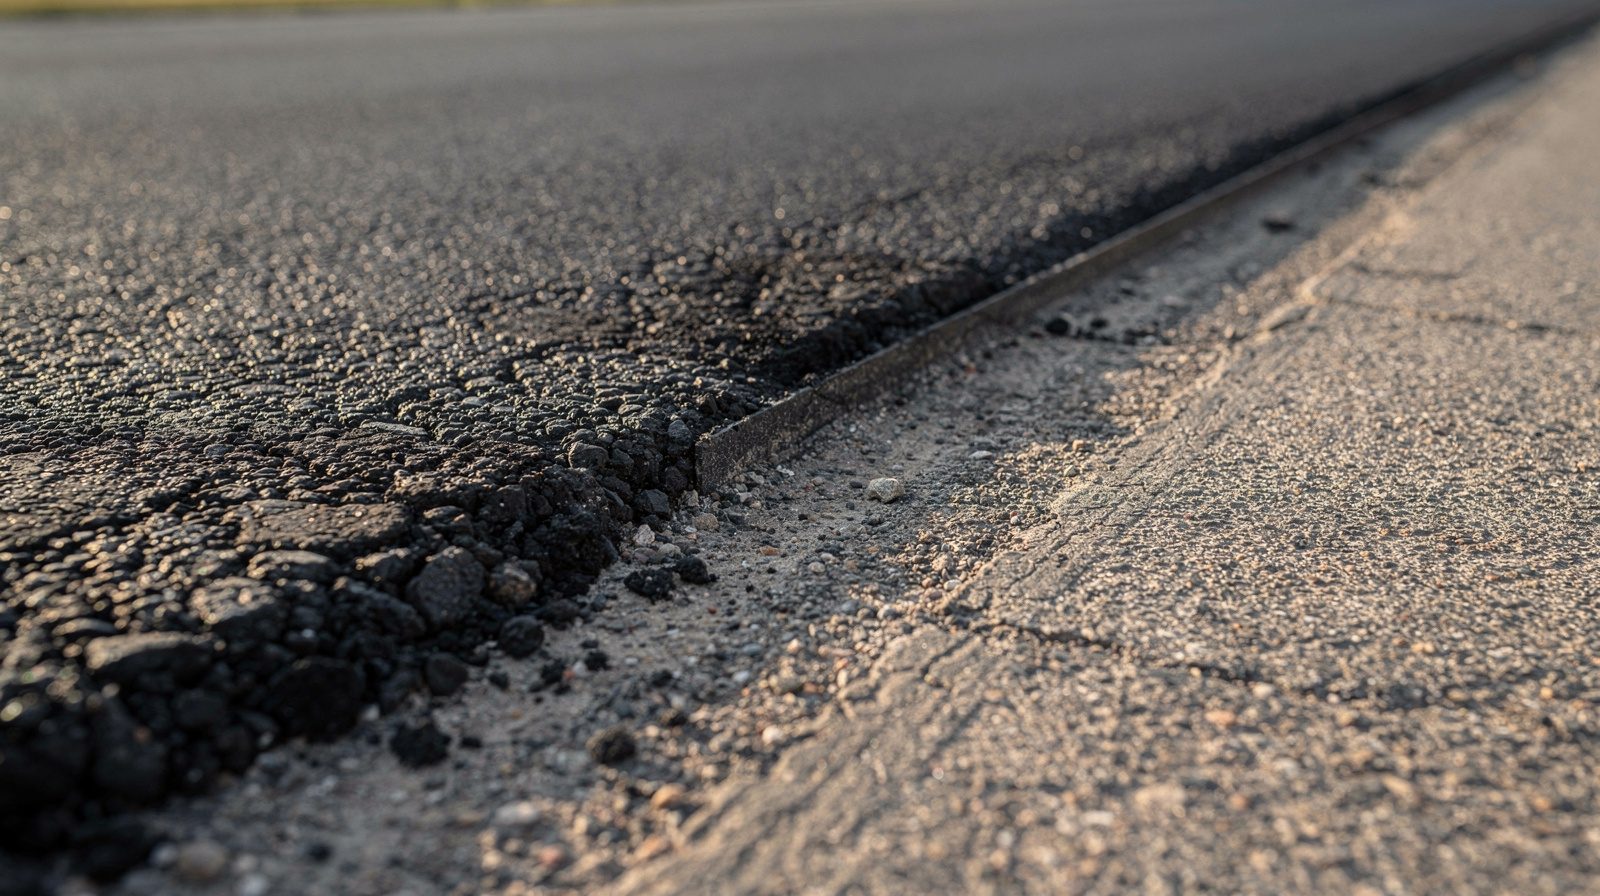
A road department knows which streets are bad. What it usually cannot produce on demand is the evidence, in the same form, for the whole network, updated this year.
The survey exists to replace an opinion with a record. Three outcomes carry that, and each can be checked on the day it is delivered.
The agreed streets come back as georeferenced imagery from drone and ground capture, taken in a window of one to two hours for the agreed area.
Crack detection on the imagery is in development, close to a first MVP. It finds cracks as one class and nothing else, and no ASTM D5340 codes are claimed for roads.
Imagery is retained, so a survey can be re-run on a newer model. The re-run is manual today.
A condition rating, a priority list and a 3D model of the surface are not part of this service. Comparing one year with the next is done by your engineer on the retained, georeferenced imagery.
What the survey does not produce is a repair design, a bill of quantities or a cost estimate. Those belong to your designer. A condition survey that quietly becomes a works specification is one nobody can hold to account.
Each deliverable with what it contains and who owns it, including the parts that are deliberately outside the scope.
Drone and ground imagery of the agreed streets, retained so that it can be re-examined.
In development, close to a first MVP. Cracks only, as one class, run on a separate GPU machine. No distress codes are claimed for roads.
In development. A section and sample-unit inventory as GeoJSON plus a JSON and Markdown report, keyed by section and sample-unit ID.
Retained imagery lets a survey be re-run on a newer model. The re-run is manual today.
One to two hours for the agreed area, drone and ground imagery, no closure booked beyond that window.
Arranged before the date where local rules require a permit for the drone flight.
The network split into sections, agreed before capture and reused on later surveys.
Not included. The service does not produce a rating, a ranked list or a surface model.
Not included. The survey records the roads, it does not specify works.
Not included. Bearing capacity needs coring or deflection testing.
Not included. Signs, markings and drainage assets are a separate inventory task.
You send the streets you have in mind and, if you have one, your centreline layer. We agree the section split, how results are handed over and the capture windows. Output is a written pilot scope. Without an agreed section split the pilot does not start, because results against boundaries nobody accepts cannot be defended.
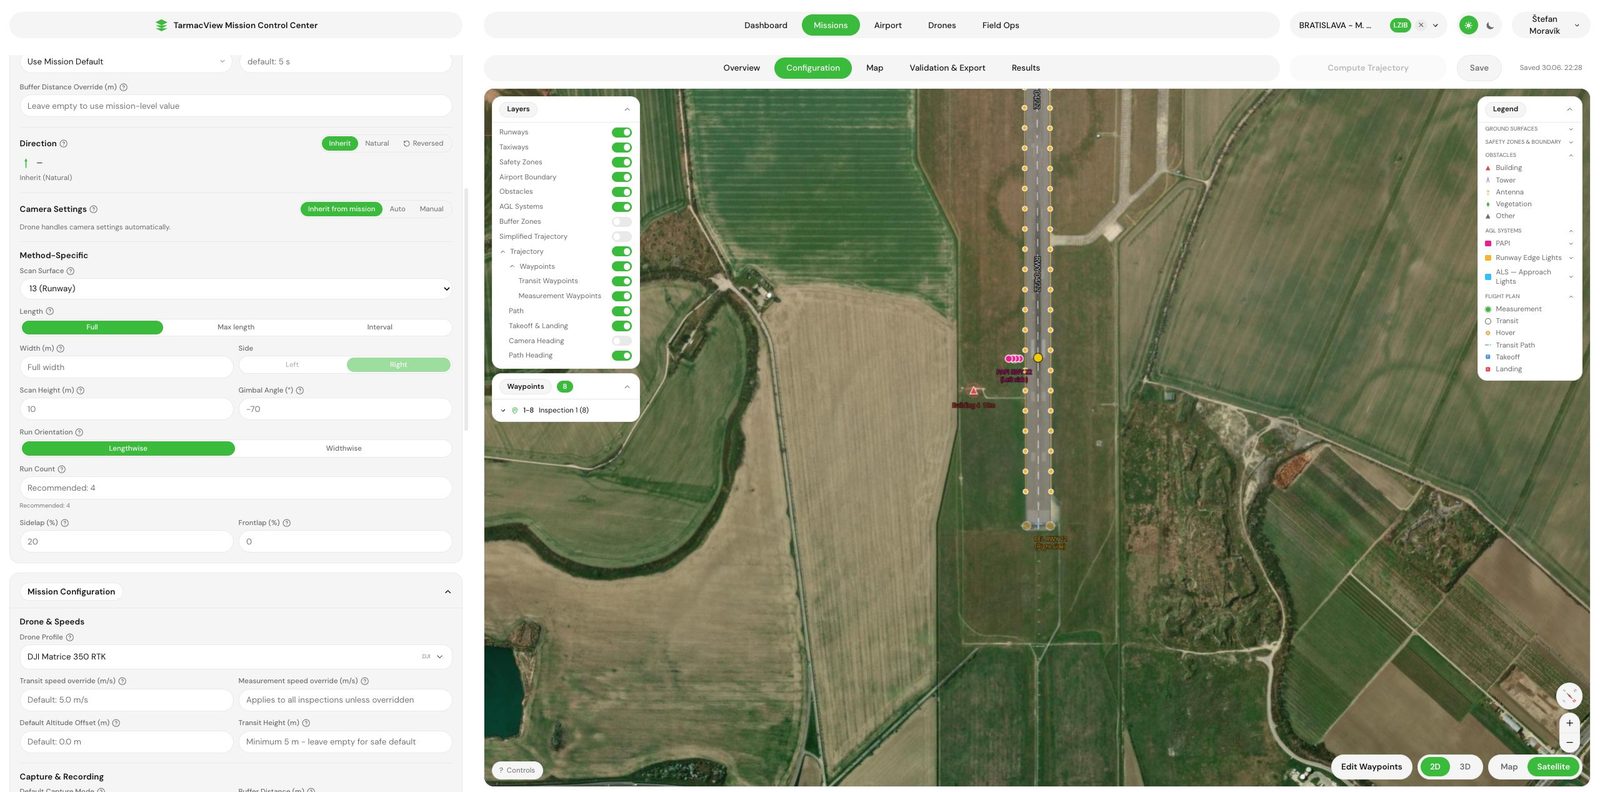
Flight permissions are arranged where local rules need them, and the capture is planned from the road geometry and the camera optics so that coverage is computed rather than assumed. Output is a validated plan and confirmed dates.
Drone and ground imagery over one to two hours for the agreed area, with traffic moving through it. Larger networks are captured across several windows. If weather stops a window, that window is reflown rather than the plan rebuilt.
Imagery is built into an orthomosaic and run through the crack model on a separate GPU machine. This step is close to a first MVP and finds cracks only. No distress codes are claimed for roads.
In the prototype output, detected cracks are grouped by agreed section and sample unit as GeoJSON, with a JSON and Markdown report. No rating per section and no priority ranking is produced.
The imagery and the outputs agreed in the pilot scope land together, and we walk your engineer through them. Anything disputed is re-examined against the retained imagery.
The part of this service worth understanding before buying it is the detector, because it is the part still in development.
Images are passed through self-supervised vision transformer backbones, DINOv2 and DINOv3, which are used for different purposes. They were trained without labels on a very large image corpus, and it turns every small patch of an image into a high-dimensional embedding that carries texture and structure rather than a category name. A lightweight head sits on top of those embeddings and does the one job in scope, segmenting a crack from the surface around it. Finding a pothole , telling longitudinal cracking apart from a sealed joint and grading alligator cracking are not in scope. The method page is DINOv3 for infrastructure surface analysis , which goes into the newer of the two backbones properly.
What matters operationally is not the architecture but the consequence. Frozen backbones with a trained head apply the same decision boundary to every metre of every survey. A crew driving a network applies a threshold that drifts with fatigue, weather and who is in the vehicle. The machine is not more perceptive than a good engineer standing on the road. It is more consistent than the same engineer on the twentieth kilometre, and consistency is what a time series needs.
No rating is built on those detections. A Pavement Condition Index is a statement about a defined section, and ASTM D6433 asks an inspector to walk sample units and read deduct curves by hand. TarmacView does not produce a PCI or a proxy for one. Where a funding programme names the standard, the formal survey is what satisfies it.
The retained imagery is the record. It lets a survey be re-run on a newer model, which is manual today, and lets your engineer compare one year with the next. A pavement management system can load GeoJSON, but no direct export to one is built, and the hand-over format is agreed before capture.
This service is in active development and is not offered yet, so there is no price, rate or quote. Four things shape a pilot instead.
Four things can stop a survey or weaken its result, and each has an owner.
Standing water, snow and heavy leaf cover hide the surface from a camera. Results are best on a calm, sunny day, because high wind blurs images and low light forces a high ISO. The affected window is recaptured rather than analysed through the obstruction, and this is the most common reason a date moves.
Parked cars, overhanging trees and narrow streets with tall buildings block a view from above. This is why ground imagery is in scope for some networks and not others, and it is decided at scoping rather than discovered on the day.
Urban drone flight is regulated, and a permit that does not arrive is a date that does not happen. That work sits with us, but it depends on the authority granting it.
Results describe a defined stretch of road. If section boundaries move between surveys, the comparison breaks. Boundaries are frozen at scoping, and changing them later is a decision with a cost rather than an edit.
Runway and taxiway pavement scan by drone at a known ground resolution, in active development. The platform already plans flights and georeferences…
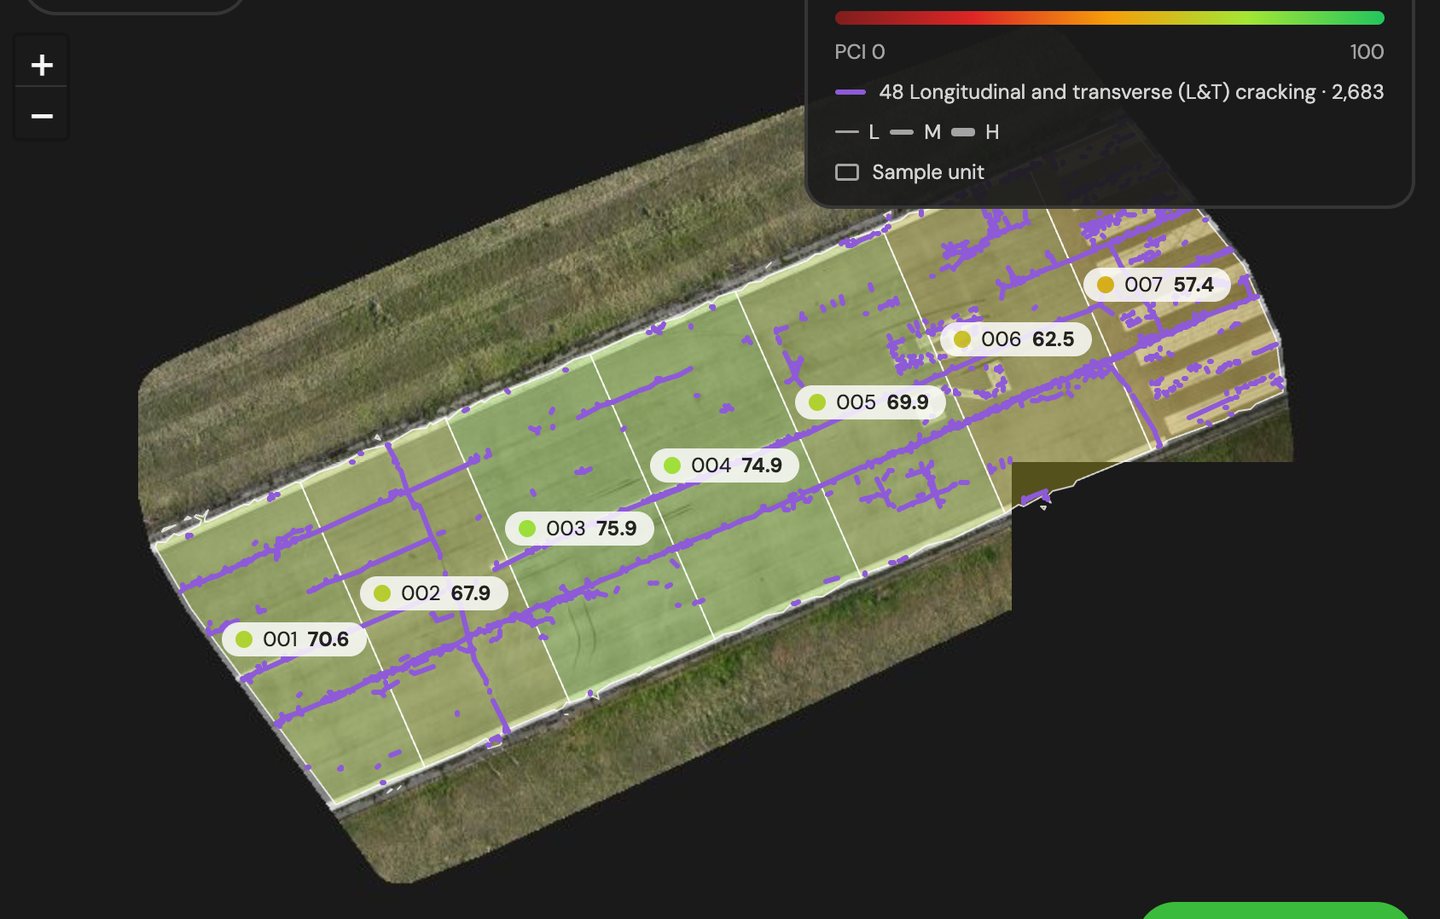
A drone survey to an ASTM D5340 distress inventory and a PCI for every sample unit of the airfield, with every crack measured, rated and shown on one…
A PCI for every sample unit of a US military airfield, from drone imagery and the D5340 definitions. Early access, in development, with the limits…
This service is in active development and is not offered yet. If you want to follow it or try it early on your own roads, tell us the streets you have in mind and we will talk it through. Nothing is binding.
Cookie Consent
We use cookies to enhance your browsing experience and analyze our traffic. See our privacy policy.