Airfield Marking Inspection: What a Drone Survey Actually Measures
Presence, geometry and conspicuity fail separately. What a nadir drone survey measures on airfield markings, and what needs a ground instrument.
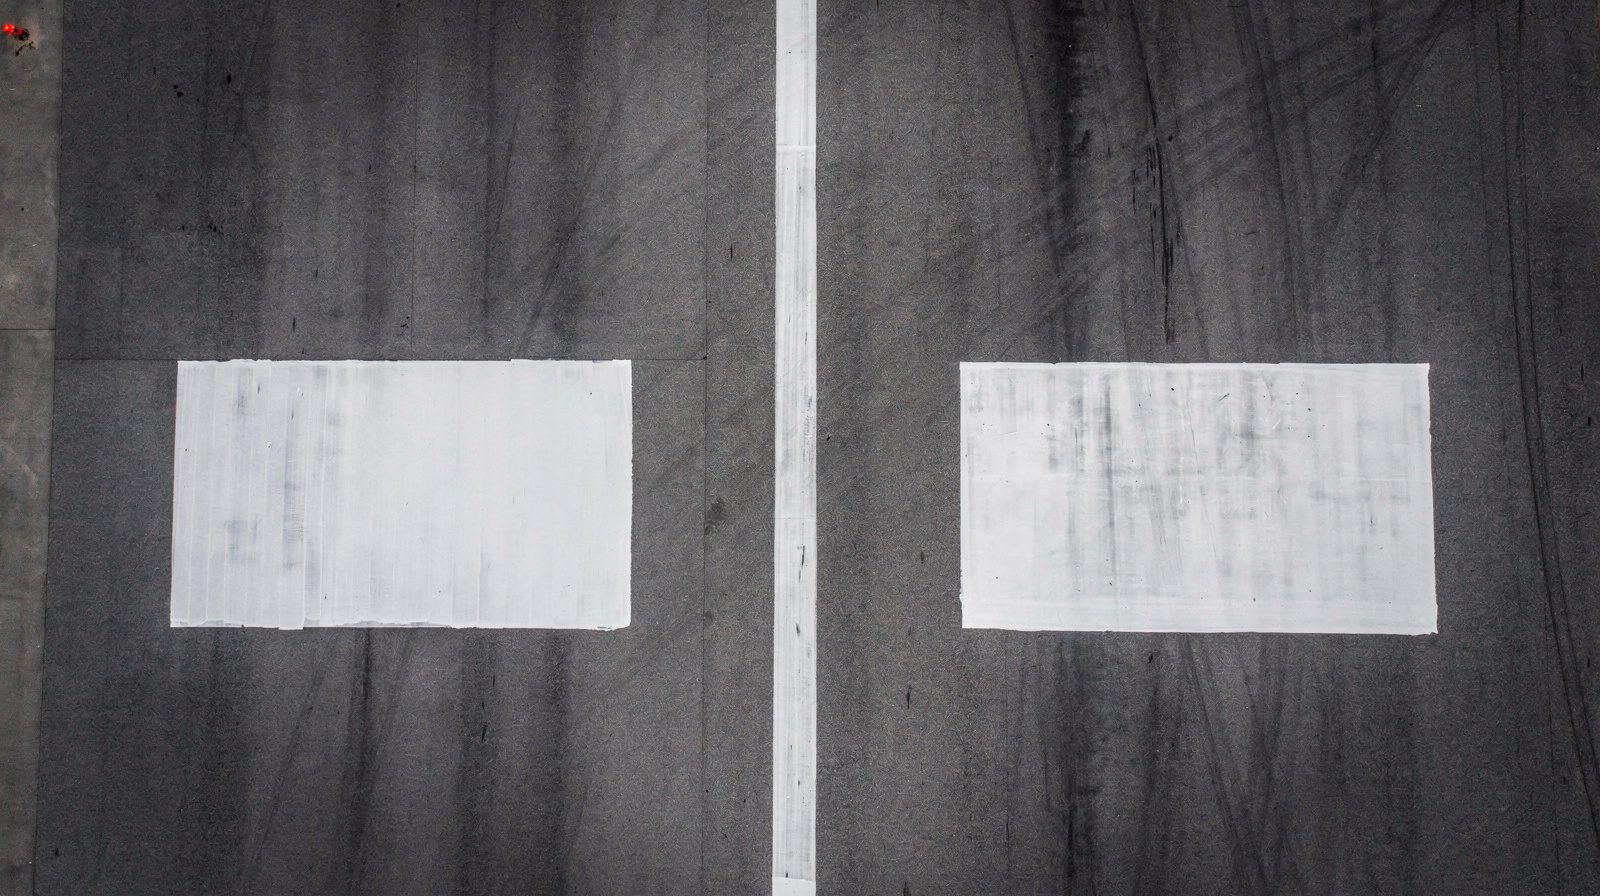 FRESH CENTRELINE · AIMING POINT · NADIR
Three questions that fail independently
An airfield marking inspection reads like one job. It is three, and they fail on different schedules.
Presence. Is the marking there, and is it the right marking for that surface. A runway designation that no longer matches the magnetic heading after a magnetic variation update is a presence failure with perfect paint. So is a holding position marking that was never reinstated after a taxiway rebuild, or a displaced threshold whose arrows were left in place after the threshold moved back.
Geometry. Is it the right size, in the right place, at the right spacing. Stripe width, stripe and gap length, lateral offset from the centre line, distance from the threshold. This is dimensional conformity and it is pure measurement.
Conspicuity. Can a pilot see it, at the distance and in the conditions where it matters. Conspicuity degrades continuously rather than in steps, and it is the question a photograph answers worst.
Most airfields assess all three at once, by eye, from a vehicle, and record one condition grade. Separating them is most of the value in doing the inspection with an instrument instead.
What the standards actually specify
ICAO Annex 14, Volume I, Chapter 5 covers markings in metric, as standards and recommended practices rather than as a drawing set. Section 5.2.1.4 states that runway markings shall be white, and 5.2.1.5 that taxiway markings, runway turn pad markings and aircraft stand markings shall be yellow. Two notes under 5.2.1.4 matter more than their status suggests. The first records that on runway surfaces of light colour, the conspicuity of white markings can be improved by outlining them in black. The second asks that the risk of uneven friction characteristics on markings be reduced, so far as practicable, by using a suitable kind of paint.
The geometry is written as bounds. For the runway centreline , 5.2.3.3 requires uniformly spaced stripes and gaps where one stripe plus one gap is not less than 50 m and not more than 75 m, and each stripe is at least the length of the gap or 30 m, whichever is greater. Width follows the approach category under 5.2.3.4: not less than 0.90 m on precision approach category II and III runways, 0.45 m on category I and on non-precision runways of code number 3 or 4, and 0.30 m on non-precision code 1 or 2 and on non-instrument runways.
Threshold marking is equally explicit. Stripes commence 6 m from the threshold under 5.2.4.4, and under 5.2.4.6 they are at least 30 m long and approximately 1.80 m wide with approximately 1.80 m between them, extending to within 3 m of the runway edge or to 27 m either side of the centre line, whichever gives the smaller lateral distance. The stripe count follows runway width, 12 stripes at 45 m and 16 at 60 m.
Aiming point and touchdown zone markings are dimensioned by landing distance available rather than by a single figure. Annex 14 Table 5-1 gives four bands, and 5.2.6.3 sets the number of touchdown zone pairs from one below 900 m to six at 2 400 m and above, spaced 150 m from the threshold, with any pair falling within 50 m of the aiming point marking deleted from the pattern.
The FAA specifies the same family of markings in imperial units and as fixed patterns. That difference is not cosmetic. It changes what an inspection is comparing against.
| Question | ICAO Annex 14 Vol I Ch 5 | FAA AC 150/5340-1M |
|---|---|---|
| Units | Metric, primary | Imperial, primary |
| Style of specification | Bounds and minima, with figures | Fixed dimensioned patterns and detail figures |
| Runway centreline stripe width | ≥0.90 m Cat II/III, ≥0.45 m Cat I and non-precision code 3–4, ≥0.30 m otherwise | ≥36 in precision instrument, ≥18 in non-precision instrument, ≥12 in visual |
| Centreline stripe and gap | Cycle 50–75 m, stripe ≥ gap and ≥30 m | Fixed 120 ft stripe with 80 ft gap |
| Aiming point position | 150 m, 250 m, 300 m or 400 m from threshold by landing distance band (Table 5-1) | Nominally 1,000 ft from the landing threshold |
| Touchdown zone spacing | Pairs at 150 m intervals, count set by landing distance | Pairs at 500 ft intervals |
| Colour requirement | Runway white, taxiway yellow, chromaticity and luminance factor in Appendix 1 | Runway white, taxiway yellow, with colour and bead requirements in the AC |
| Contrast aid on pale pavement | Black outlining, as a note under 5.2.1.4 | Black border marking, specified with dimensions |
An airport under one authority that reads a report built against the other gets numbers that look wrong and are not. A marking report has to say which document it graded against, on every row.
What a nadir survey measures without touching anything
A vertical photogrammetric survey of a runway or taxiway produces one orthorectified, georeferenced surface. Every marking on it is then a shape with coordinates, and five things fall straight out.
Position. Where the marking actually is, against the surveyed centre line and threshold rather than against where the paint crew thought they were. Offsets in pavement marking accumulate over repaint cycles, because each crew masks off the previous coat.
Dimensions. Stripe width, stripe and gap length, block length, lateral spacing, and the distances that Annex 14 dimensions from the threshold. This is a far easier resolution problem than crack width. A 0.45 m centreline stripe imaged at a ground sample distance of 10 mm per pixel is 45 pixels across, so the width is measured with margin to spare rather than estimated. The pixel budget that constrains a pavement scan is not the constraint here.
Edge definition. How sharp the boundary between paint and pavement is. A fresh mask gives a step of one or two pixels. A marking that has been overpainted three times gives a ragged edge with old paint bleeding outside the new one, which is visible in the gradient long before anyone would call the marking non-conforming.
Area of paint loss. Missing paint inside the nominal footprint of the marking, measured as an area rather than described. This is what wear actually looks like on a runway marking : not a stripe that vanishes, but a stripe that goes hollow in the wheel paths first.
Coverage percentage. Paint area divided by nominal area, per marking element. It is the number that turns a subjective grade into a trend, because the same element measured six months later gives a comparable figure rather than a second opinion.
| Property | Measured from a nadir survey | Needs a ground instrument | Needs human judgement |
|---|---|---|---|
| Presence and correct type | ✓ | ✗ | Correct type for a changed procedure |
| Stripe width, length, spacing | ✓ | ✗ | ✗ |
| Position against surveyed threshold | ✓ | ✗ | ✗ |
| Edge sharpness and overpaint drift | ✓ | ✗ | ✗ |
| Paint loss area and coverage percent | ✓ | ✗ | Where the acceptance threshold sits |
| Retroreflectivity, RL | ✗ | ✓ ASTM E1710 | ✗ |
| Daylight luminance coefficient, Qd | ✗ | ✓ ASTM E2302 | ✗ |
| Chromaticity and luminance factor | Colour under one uncontrolled illuminant | ✓ 45°/0° under CIE D65 | ✗ |
| Skid resistance over the paint | ✗ | ✓ Friction measuring device | ✗ |
| Whether the marking reads correctly at night | ✗ | Partly | ✓ Pilot report, night drive-through |
What a camera cannot answer
Three properties stay on the ground, and all three are the ones that decide whether a marking works when it is needed.
Retroreflectivity. How much of a landing light comes back toward the eye that sent it. It is measured as RL, the coefficient of retroreflected luminance, with a portable retroreflectometer under the CEN 30 m geometry of ASTM E1710, an entrance angle of 88.76° and an observation angle of 1.05°. Glass beads dropped into wet paint provide it, and they are the first thing traffic strips off. A marking can be geometrically perfect, look bright in an overcast nadir photograph, and return almost nothing at 88.76°. ASTM E2302 covers the companion daylight quantity, Qd, the luminance coefficient under diffuse illumination.
Chromaticity. Annex 14 Appendix 1 section 3 sets the chromaticity boundaries and minimum luminance factors for marking colours, with white at a luminance factor of at least 0.75 and yellow at least 0.45, determined under standard conditions: illumination at 45°, view perpendicular to the surface, CIE standard illuminant D65. A drone camera satisfies none of those conditions. It views from nadir under whatever the sky is doing, through a lens with its own colour response. It can flag that a yellow taxiway marking has drifted toward grey relative to a fresh one in the same frame. It cannot report a luminance factor. Appendix 1 also notes plainly that the surface colour specifications apply only to freshly coloured surfaces, and that marking colours change with time and therefore require renewal.
Friction over the paint. Paint is smoother than the pavement it sits on, which is why Annex 14 asks for a suitable kind of paint in the first place. A thick, wide, well-maintained marking in the touchdown zone is a low-friction patch when wet. Friction is measured with a continuous friction measuring device against the level the State has set, and no imagery substitutes for it.
The cycle, and what triggers a repaint
Annex 14 Chapter 10 requires a maintenance programme, including preventive maintenance where appropriate, and 10.5.2 requires a system of preventive maintenance of visual aids to ensure lighting and marking system reliability. It does not name a repainting interval, and neither does a sensible airport. Intervals come from the material and the traffic.
What actually triggers a repaint is one of four things: coverage falling below whatever the operator has set as acceptable, retroreflectivity falling below the level the night operation needs, a geometry change such as a moved threshold or a new designation, or a paved surface change that leaves the marking sitting on the wrong pavement. Only the first and third are visible from above. The second needs the retroreflectometer, and the fourth is usually already known.
The useful discipline is to separate the trigger from the evidence. A survey that reports coverage per element, position against the survey control, and a dated comparison against the previous flight gives the maintenance team a curve. A retroreflectivity run on the elements the curve flags then costs an hour on the ground instead of a full night walk.
Where automated marking detection still struggles
Detection is not the same as measurement, and the research is candid about it. Work on line identification for autonomous systems has found that algorithms tuned on taxiway markings degrade when applied to runway markings, because the line characteristics differ and shadows, tyre marks and varying surface condition interfere. The 2025 study “Runway vs. Taxiway” adds a CNN classifier specifically to cut misclassification of the horizon and background as marking, which is a reasonable summary of how brittle the naive approach is.
Robustness is the same story from a different angle. Federated adversarial work on landing runway detection, trained on the LARD dataset of synthetic and real approach imagery, exists because detectors that score well on clean images do not hold up on perturbed ones.
Neither result argues against automated marking survey. Both argue for the same thing we do with pavement: report what was measured, keep the imagery behind every finding, and expect a human to disagree with the first run on a specific airfield.
What we fly
Marking condition comes off the same pass as the pavement. Our runway surface scan covers the full width at a known ground resolution with every image georeferenced to RTK precision, so a marking measured this visit is compared against the same marking last visit rather than against a memory of it.
What that gives you is the geometry and the coverage, dated, positioned and repeatable. What it does not give you is the retroreflectometer reading or the friction number, and any report that claims otherwise from a photograph is guessing.
Founded by flight-inspection veterans who spent decades measuring PAPI lights for aviation authorities across Europe.
Learn more
Related terms
03 TERMSAirfield Pavement Markings
Airfield pavement markings, runway centerline, threshold, touchdown zone, taxiway centerline, holding position, and apron markings, are critical for pilot navigation. Covers marking types, materials (paint, thermoplastic, preformed tape), retroreflectivity, and AI-based marking condition assessment per ICAO Annex 14 and FAA AC 150/5340 standards.
Airport Ground Markings
Airport ground markings guide pilots and ground crews using standardized, painted visual cues on runways, taxiways, and aprons. These markings ensure safe, efficient, and organized airport operations by delineating operational areas, directing traffic, and providing critical safety information.
Taxiway Marking
Taxiway markings are standardized visual cues painted on airport surfaces to guide pilots and vehicles safely and efficiently on taxiways, aprons, and intersections. Governed by ICAO and FAA standards, they reduce collision risks and ensure compliance.
Further reading
03 ARTICLES
Runway Edge Light Inspection: What ICAO Requires and How It Is Measured
What ICAO Annex 14 requires of runway edge lights, what it leaves open, and how intensity, colour and coverage are actually measured in the field.
When Runway Markings Lose Conspicuity
A marking can be present yet invisible. How abrasion, rubber, oxidation and water degrade conspicuity, and when to repaint versus strip.
Runway Surface Inspection: What a Drone Scan Actually Sees
What a drone pavement scan resolves on a runway, what it cannot, how ground sample distance sets the smallest measurable crack, and how a scan becomes…