Runway Surface Inspection: What a Drone Scan Actually Sees
What a drone pavement scan resolves on a runway, what it cannot, how ground sample distance sets the smallest measurable crack, and how a scan becomes a rating.
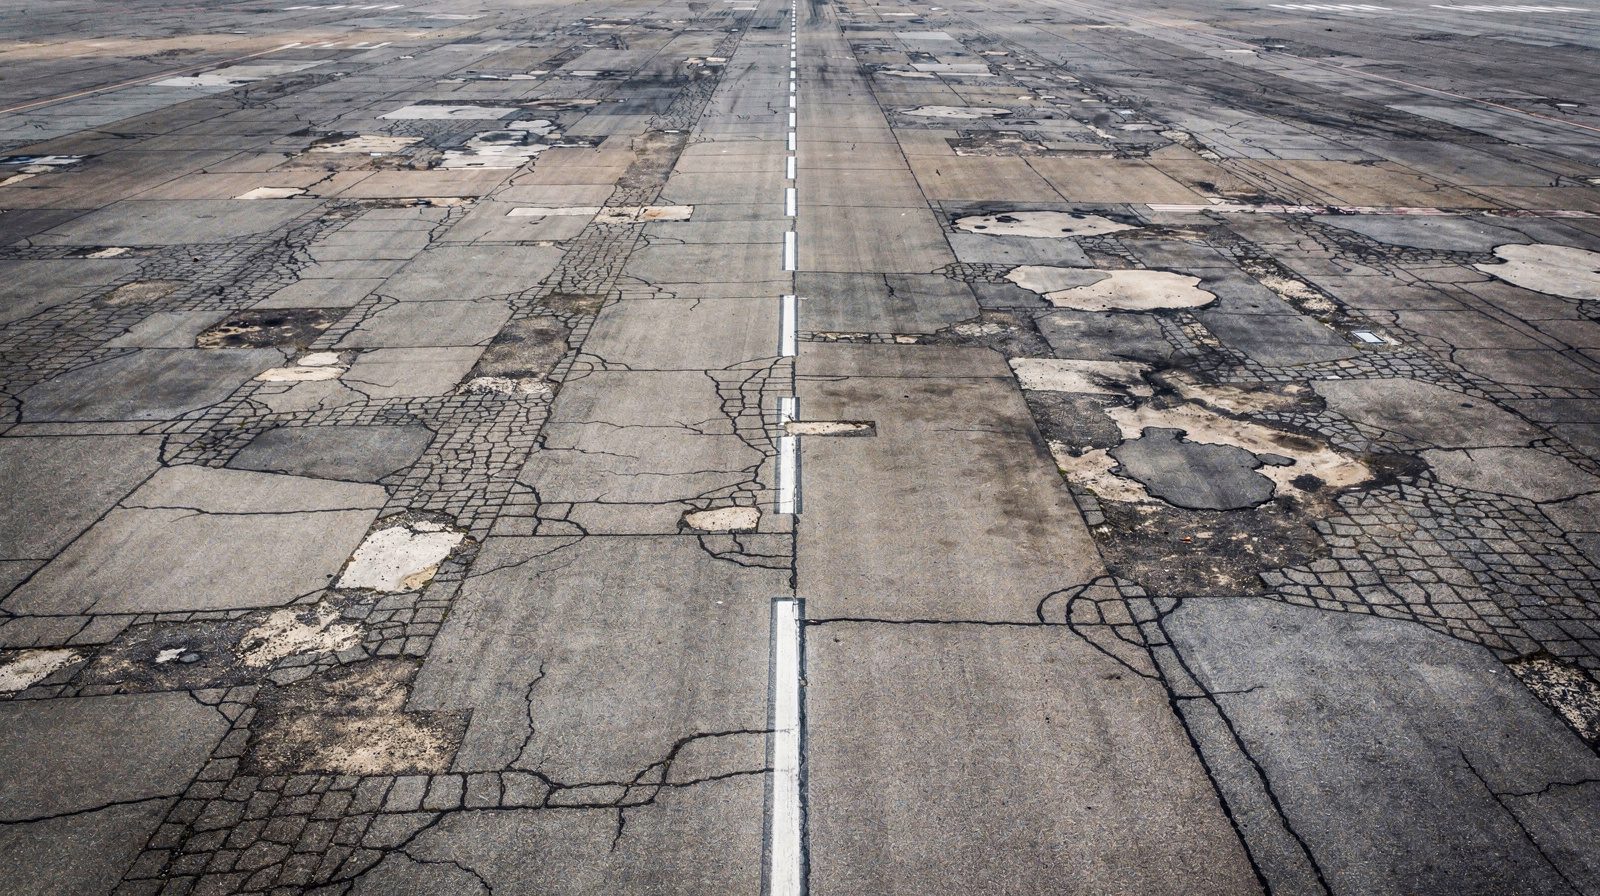 SEALED CRACKING · PATCHED · OVERCAST
The surface is where the evidence is
Runway pavement deteriorates from the top down and from the bottom up at the same time, and only one of those is visible. Water enters through a crack, the base loses support, and the surface reports the problem months later as a depression or a spreading crack network. By then the cheap repair window has closed.
That is the argument for looking often rather than looking hard. A survey every three years catches each defect at whatever stage it happens to have reached. A survey twice a year catches most of the same defects while they are still a sealing job.
The question airports ask us is narrower than that, and fairer. What does a camera on a drone actually see, and what is it quietly missing? This is the honest version of the answer.
What goes wrong on a runway, and how it presents
Cracking
Cracks are the most common airfield distress and the easiest to read from an image, because a crack is a dark line on a surface with very little other line structure. The type follows from orientation and pattern. Longitudinal cracking runs parallel to the centreline, and its most common cause is a construction joint between adjacent paving passes that was never compacted properly. Transverse cracking runs across the surface and is usually thermal contraction. Block cracking divides the pavement into rough rectangles as an aged binder shrinks. Alligator cracking, interconnected polygons concentrated in a wheel path, is the one that means fatigue of the structure rather than ageing of the surface.
Severity is width, not length. The FHWA LTPP Distress Identification Manual classifies asphalt cracks on mean width: low at 6 mm or less, moderate above 6 mm up to 19 mm, high above 19 mm. A sealed crack with sealant in good condition counts as low regardless of the opening underneath. Jointed concrete uses tighter bands, with low below 3 mm and high at 13 mm or more, or with spalling of 75 mm or more, or faulting of 13 mm or more.
Note that the manual specifies mean width along the crack, not the widest point. A crack with a few wide sections and a tight average rates lower than a photograph of its worst point suggests. Automated systems often report maximum width instead, because it is closer to what an inspector picks out with a gauge. Both answers are defensible and they are not the same number, so a report has to say which one it used.
Deformation
Rutting is a permanent longitudinal depression in the wheel path. Three mechanisms produce it and they differ in cross section. Densification is post-construction compaction under traffic, with no lateral upheaval, the surface simply sits lower. Shear flow displaces mix sideways and leaves raised shoulders along the groove. Subgrade failure produces a broad basin with the asphalt cracked where it flexed to follow.
On the TxDOT depth scale, shallow rutting is 0.25–0.49 in, deep is 0.50–0.99 in, severe begins at 1.00 in (25.4 mm) and failure at 2.00 in (50.8 mm). Airfields care earlier than that. Water ponding in ruts as shallow as 3–5 mm can initiate hydroplaning at typical landing speeds, and an aircraft on the roll cannot steer around the wheel path.
Rutting is the distress that exposes the limit of plain imagery most clearly. A rut has almost no tonal contrast against the pavement around it until it rains and fills. Depth is geometry, not colour, so it has to come from a reconstructed surface model rather than from a picture.
Loss of material
Raveling, weathering and spalling are the loss of aggregate and binder from the surface. Their root cause is usually volumetric. Design air voids in a dense-graded hot-mix asphalt are 4.0%, with in-place voids expected to stay between 3% and 8% across the service life, and the FAA requires in-place voids not to exceed 8.0% after construction for airport mixtures. Above that the pavement is permeable, oxygen and water reach the binder, and the surface starts shedding stone. Kandhal and Koehler found raveling becomes significant above 8% air voids and severe above 15%. The Asphalt Institute puts the cost at roughly 10% of pavement life for every 1% of air voids above 7%.
Raveling presents as a change in texture and tone rather than as a line. That makes it harder for an automated detector than cracking, and harder for a human rater too.
| Distress | What it looks like from above | Resolved by imagery | Needs something else |
|---|---|---|---|
| Longitudinal, transverse, block cracking | Dark linear or rectilinear network, high contrast | Location, length, orientation, width band | Whether the crack is working or dormant |
| Alligator cracking | Interconnected polygons in the wheel path | Extent and severity of the pattern | Remaining fatigue life, layer condition |
| Rutting | Little contrast when dry, holds water when wet | Depth from a surface model, not from tone | Which of the three mechanisms caused it |
| Raveling and weathering | Coarsening texture, lightening tone | Extent, with lower confidence than cracking | Air voids and binder content, from a core |
| Spalling and joint breakdown | Broken edges along joints and slab corners | Location, area, loose material present | Load transfer across the joint |
| Depressions and ponding | Visible only as standing water or as a surface model | Geometry from the model, ponding evidence | Drainage design and subgrade behaviour |
What a camera resolves, and what it does not
An imaging survey measures two things well. Surface geometry, if the reconstruction is good, and visible distress, if the resolution is sufficient. It measures nothing below the wearing course.
It cannot give you layer thickness, moisture in the base, subgrade stiffness or remaining structural life. Those come from deflection testing, ground-penetrating radar, or a core. This is not a limitation of drones specifically. The Pavement Condition Index itself is not a structural measurement. It is a surface-distress proxy, built on empirical work at the US Army Corps of Engineers CERL in the 1970s that established how distress patterns correlate with underlying condition. Any survey based on looking at the surface inherits that boundary, whether from 10 m up or from a metre away on foot.
One more distinction worth making, because the vocabulary collides. A pavement scan is not a runway condition assessment in the sense of the ICAO Global Reporting Format. GRF is about contaminants on the surface right now, water, snow, slush and ice, coded as a runway condition code for each third of the runway and passed to flight crews. A pavement scan tells you about the pavement. Its findings are good for months. A runway condition report is good for as long as the weather holds.
Ground sample distance and the smallest crack you can trust
Ground sample distance is how many millimetres of runway one pixel covers. It falls out of the optics, not out of the flight plan alone: mm per pixel equals sensor width times working distance, divided by focal length times image width.
Detection and measurement have different thresholds, and conflating them is where resolution claims usually go wrong. A crack narrower than one pixel can still be detected, because it darkens a pixel it only partly fills. Putting a width on it is a different problem. The working rule is that a feature needs roughly three pixels across it before its measured width means anything, and even at three pixels the precision is poor. At 0.1 mm per pixel, a 0.3 mm crack spans exactly three pixels and is already at the edge of what the measurement supports.
That rule turns GSD into an honest severity limit.
| Ground sample distance | Width at about 3 pixels | Severity work it supports on asphalt |
|---|---|---|
| 1 mm/px | ≈3 mm | Below the low severity band, comfortable margin |
| 2 mm/px | ≈6 mm | Sits on the low/moderate boundary at 6 mm |
| 3 mm/px | ≈9 mm | Moderate band only, low severity is detection not measurement |
| 6 mm/px | ≈19 mm | Sits on the moderate/high boundary at 19 mm |
| 10 mm/px | ≈30 mm | Mapping where cracks are, not how wide they are |
The nominal figure is a ceiling, never a promise. Rough surface texture blurs crack boundaries by one to three pixels. Out-of-focus capture adds one to three more. A non-perpendicular camera angle introduces perspective error that has to be corrected geometrically or it becomes width error. Subpixel edge techniques recover part of the loss, and photogrammetry combined with deep learning has been reported at average errors of 0.26–0.71 mm for cracks under 5 mm, which is comparable to a manual crack comparator card at roughly ±0.5 mm. None of that rescues a survey flown too high for the question being asked.
The practical consequence is that scan altitude is a decision about severity bands, not about how quickly the runway can be covered. Ask what the smallest crack you need a number for is, work back through three pixels to a GSD, and fly that. Crack width measurement is only as good as the calibration behind it, and calibration is only as good as the geometry it was derived from.
How a scan becomes a condition rating
The pipeline is mechanical once the imagery exists. Segment the crack pixels. Convert pixel distances to millimetres with the calibration factor. Derive width along the centreline, either by distance transform from the mask or by sampling profiles perpendicular to the crack. Bin the widths into severity levels. Sum length or area per distress type and severity to get extent. Look up a deduct value for each combination, run the corrected deduct value iteration, and subtract from 100.
The airport method is ASTM D5340, not the ASTM D6433 used for roads and parking lots. Sample units are defined differently for rigid and flexible pavement, by slab count and by area respectively, and the figures quoted in secondary sources do not agree with each other. Take them from the edition of the standard you actually hold rather than from a summary. What FAA AC 150/5380-7B sets is the cadence: a federally obligated airport must perform a detailed inspection of its airfield pavements at least once a year under its pavement management program, and if a PCI survey to D5340 is performed, the interval between those detailed inspections may be extended to three years. The annual inspection is the baseline, and the PCI survey is what buys the longer interval. In common practice, PCI 70 is where overlay planning starts for a runway and PCI 55 is where reconstruction enters the conversation, though neither number appears in the circular.
What an automated scan produces is a proxy grade, and calling it anything else is overclaiming. It is repeatable, it covers the full surface rather than a sample, and it is anchored to the same distress definitions. It has not been signed by a certified rater. That distinction, and how much it actually matters for budgeting, deserves its own treatment and gets one in a companion post on the index itself.
Where a scan does not replace boots or a core
Four things stay on the ground.
Anything tactile. Whether a crack is working or dormant, whether the sealant is still bonded to the crack face, whether joint filler lifts out in your hand. No camera resolves adhesion.
Anything subsurface. Layer thicknesses, base moisture, subgrade stiffness. Coring, deflection testing and ground-penetrating radar answer these, and nothing flown answers them.
Anything volumetric. In-place air voids and binder content come from a core tested in a laboratory. The surface only shows you the consequence, years later, as raveling.
Verification. The first time a detection model runs on a specific pavement, someone should walk a sample of its findings and disagree with it on paper. That is how you learn what it over-calls, usually rubber deposits, tining, and old sealant.
The useful framing is division of labour. The scan tells you where to look and how the whole surface is trending between visits. The walk and the core tell you what is happening at the places the scan flagged. Neither replaces the other, and an airport that buys only one of them is guessing about half the problem.
What we fly
Our runway surface scan covers the full width of a runway or taxiway in one serpentine pass at low altitude, with every image georeferenced to RTK precision so the next survey compares against this one instead of starting over. The run count and spacing are computed from the camera and the requested overlap rather than estimated, which is the only way the ground sample distance a report quotes is the one it was actually flown at.
It comes off the same visit as the lights and the approach, which is the point. As we set out in what a PAPI inspection actually costs , once a crew is on site and coordinated with your tower, the marginal cost of also imaging the pavement is small.
Founded by flight-inspection veterans who spent decades measuring PAPI lights for aviation authorities across Europe.
Learn more
Related terms
03 TERMSAI-Based Crack Detection
AI-based crack detection uses computer vision, convolutional neural networks, vision transformers, and semantic segmentation models, to automatically identify, classify, and measure cracks in pavement and structural imagery. The technology underpins automated road, runway, and bridge inspection programs across the civil aviation and transportation sectors.
Longitudinal Cracking
Longitudinal cracks run parallel to the pavement centerline or direction of travel. Causes include poor construction joint bonding, reflective cracking from underlying layers, thermal stress, and differential settlement. FHWA LTPP and TxDOT define severity levels based on crack width, spalling, and faulting. Covers mechanics, classification, measurement protocols, and automated crack orientation…
D-Cracking
D-cracking is a pattern of closely spaced crescent-shaped cracks near joints, edges, and cracks in PCC pavements, caused by freeze-thaw deterioration of susceptible coarse aggregate. It is a progressive, irreversible distress affecting airport runways in cold climates.
Further reading
03 ARTICLES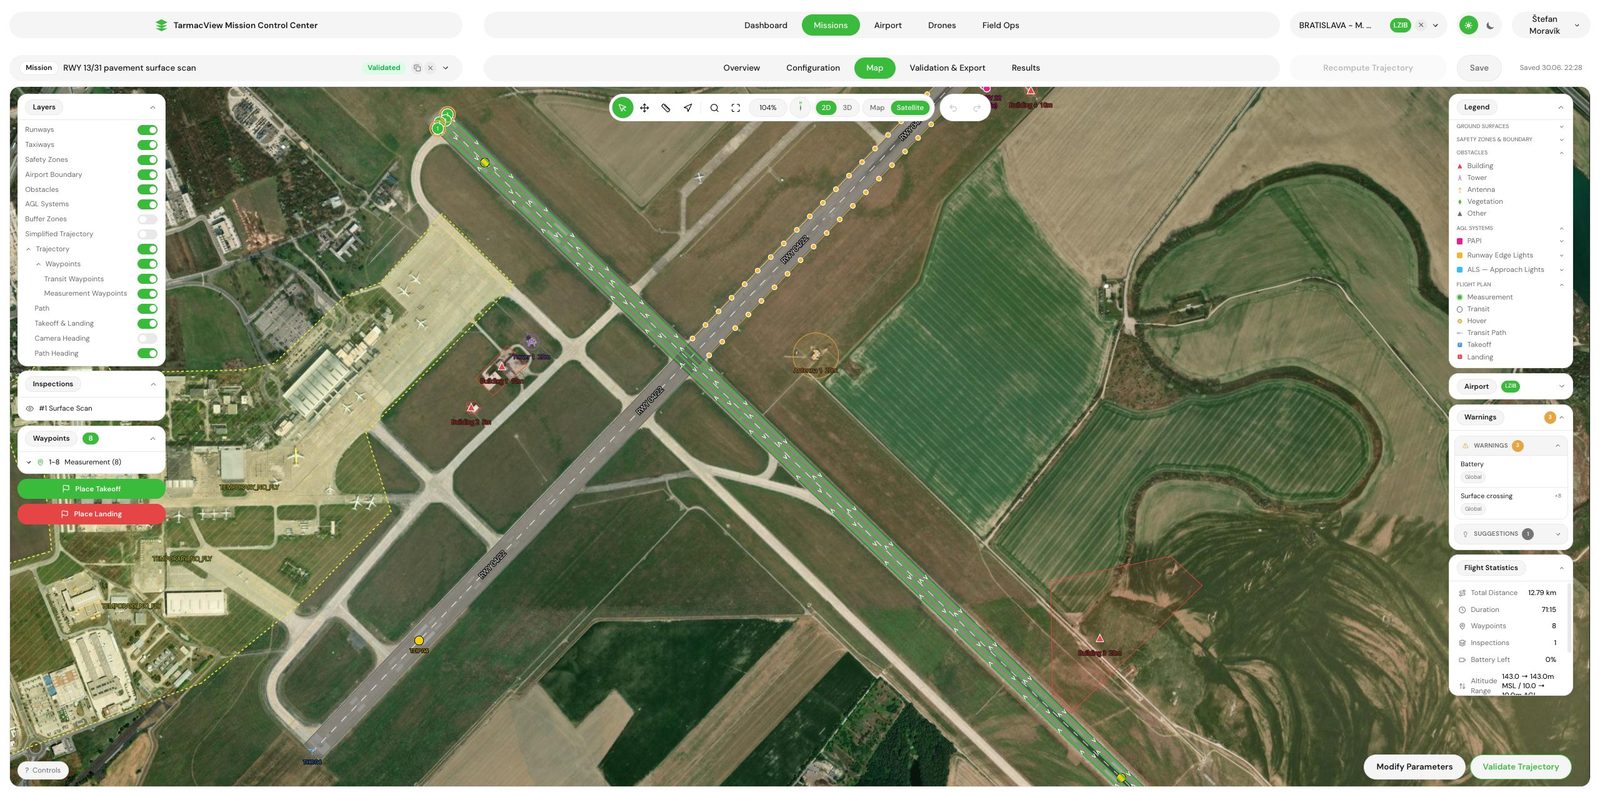
Runway Surface Scan by Drone at a Known Resolution
Drone scan of runway and taxiway pavement at a known ground resolution. Cracks, spalls, joint defects and debris found and located to RTK precision,…
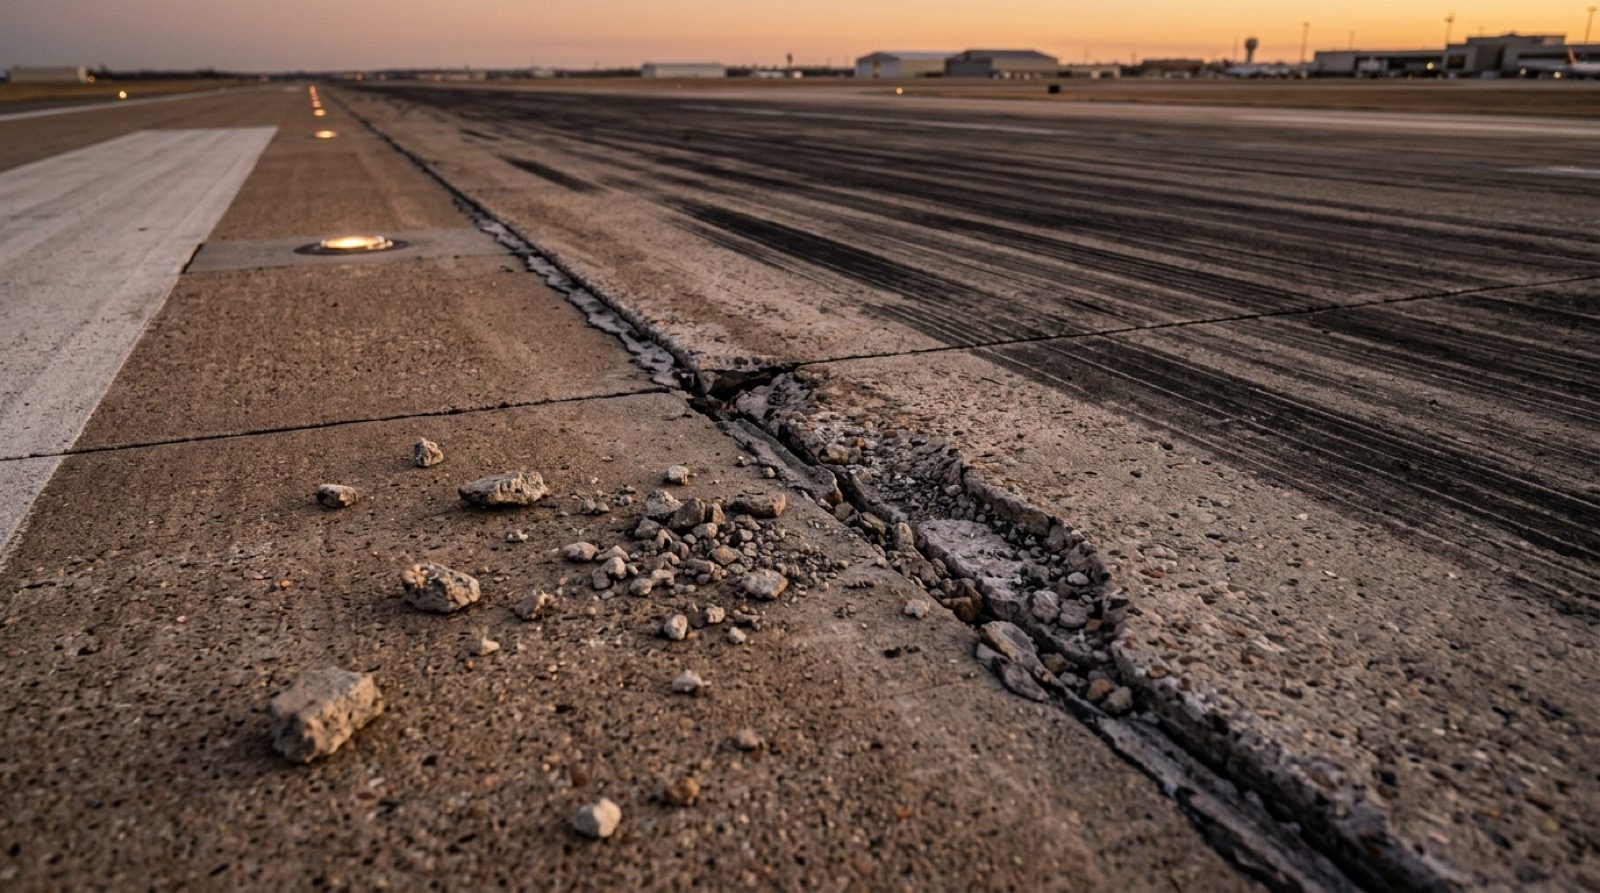
Airfield Pavement Condition Assessment by Drone
Drone condition assessment for runway, taxiway and apron pavement. Distress classified to ASTM D5340 categories, a PCI proxy per section, a ranked…
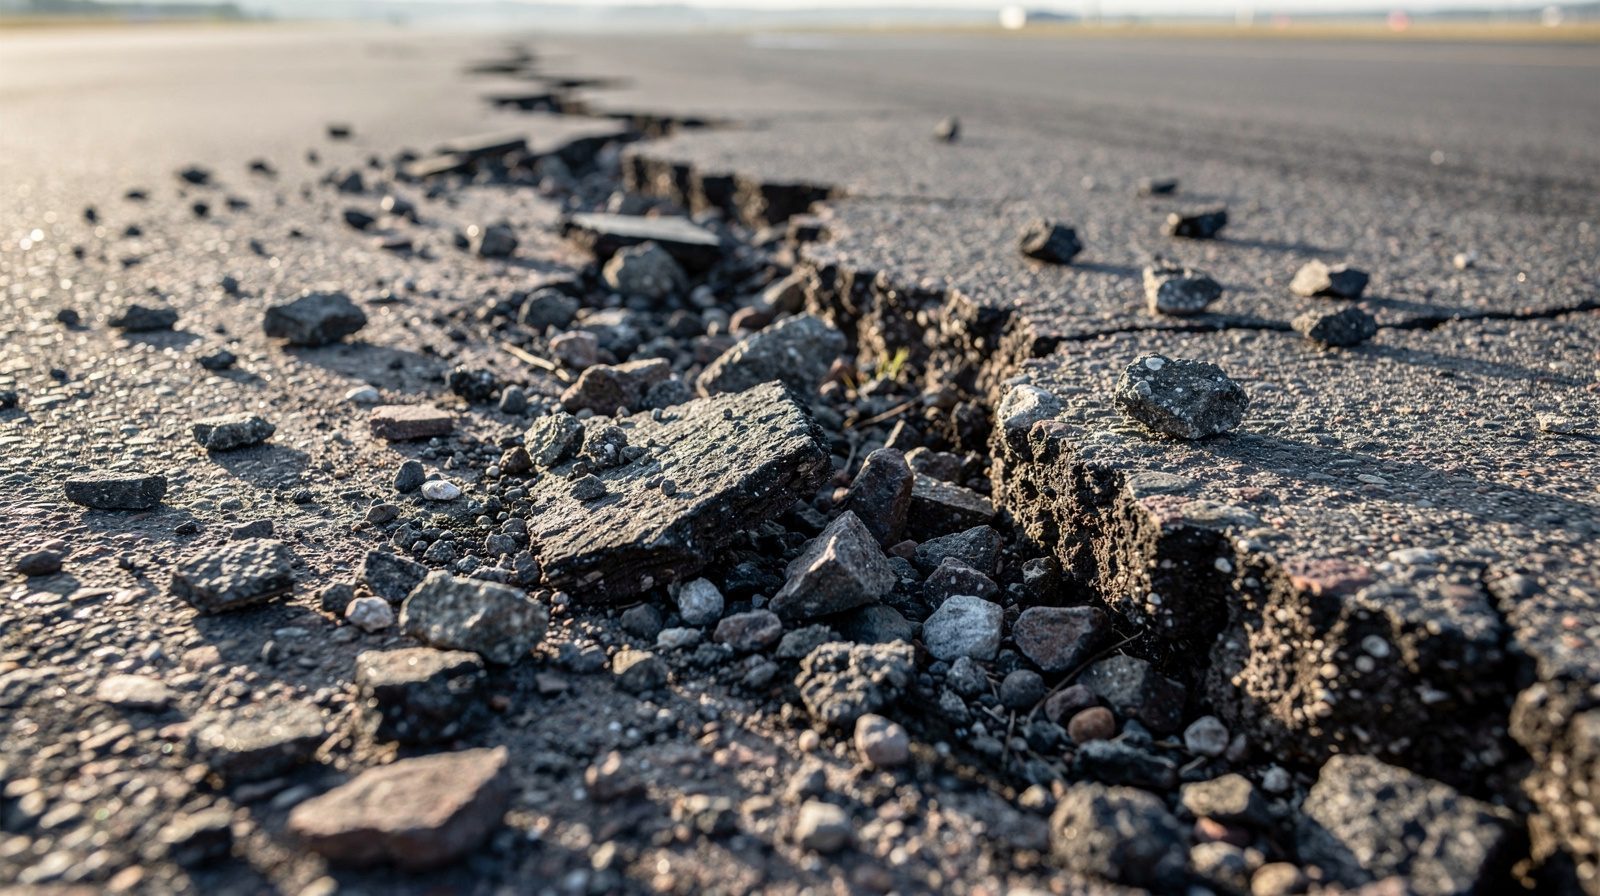
From Surface Distress to Foreign Object Damage
Most runway FOD is not dropped, it is shed by the pavement. How raveling, spalling and joint failure make debris, and which distress to seal first.