Pavement Condition Index Explained
What PCI is, how ASTM D5340 turns observed distress into a 0-100 number, what the deduct-value step does, and what the index cannot tell you about a runway.
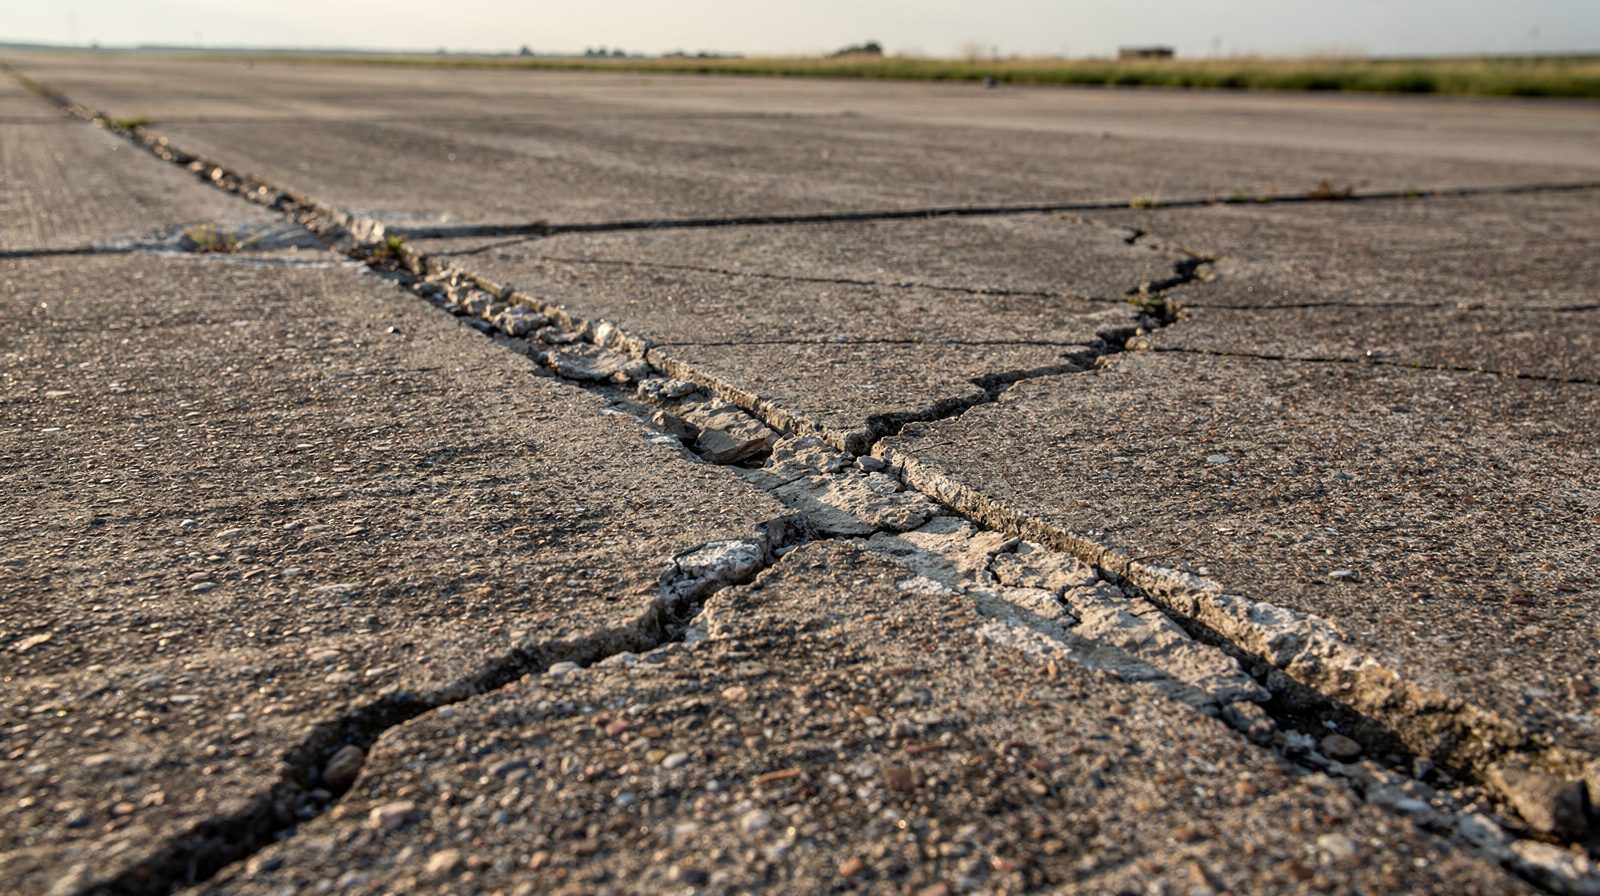 SPALLED JOINT · VEGETATION · LOW SUN
A rating, not a measurement
The Pavement Condition Index is the number most airports use to describe how a runway is doing, and the number most often misread. A section at PCI 82 is not 82 percent as strong as it was when new. It is not 18 percent worn through. The index says nothing directly about how much load the pavement will carry tomorrow morning.
What TarmacView delivers against it, a PCI proxy per section and a ranked repair list, is described on the pavement condition assessment page.
What it actually is: a score from 0 to 100 derived from what a trained observer can see on the surface. Three inputs, and only three. Distress type, severity, and extent across the area being rated. Everything else, the layer thicknesses, the binder chemistry, the moisture sitting in the base, is outside the index by construction.
ASTM D5340-20 says so in its own significance clause: “The PCI cannot measure the structural capacity, neither does it provide direct measurement of skid resistance or roughness.” Worth reading twice, because a good share of the pavement-budget disagreements we see turn out to be ones where somebody has quietly been treating the PCI as a strength figure.
Where the index comes from
PCI was developed by the US Army Corps of Engineers with funding from the US Air Force, and D5340 records that it was verified and adopted afterwards by the FAA and the US Naval Facilities Engineering Command. It is a military airfield method that civil aviation inherited, which explains both its bluntness and its longevity.
The standard is unusually candid about its own basis. D5340 describes the PCI as “a measurement of the collective judgement of pavement maintenance engineers”, relating directly to maintenance and repair needs and only indirectly to structural integrity. The deduct curves at the centre of the method were not derived from mechanics. They came from asking experienced engineers how bad a given distress at a given density looked, and fitting curves to the answers. That is a legitimate way to build an index. It is not measuring a pavement, and the standard does not pretend otherwise.
Two standards exist and they are not interchangeable. ASTM D6433 covers roads and parking lots. ASTM D5340 covers airports, and it is the one an airfield uses. The airport version carries distress types that only occur on an airfield, jet blast erosion near thresholds, fuel spill damage on aprons, rubber accumulation in the touchdown zone, and its scope explicitly takes in porous friction courses alongside asphalt and jointed concrete. FAA AC 150/5380-7B, the advisory circular on the Airport Pavement Management Program, names D5340 as the method. The current active edition is D5340-24.
How a survey is put together
A PCI survey is not a walk down the runway with a clipboard. It follows a defined hierarchy, and the hierarchy is what makes the number comparable between years.
The network is divided into branches, a runway or a single taxiway being one branch. Each branch is divided into sections sharing construction history, traffic and structure. The section is the reporting level. When somebody says “runway 09/27 is at PCI 71”, that is a section value, not a point measurement.
Sections are then divided into sample units, fixed and mapped and numbered patches of pavement. Concrete units are counted in contiguous slabs, asphalt units are a rectangular area. D5340 sets an asphalt unit at 5,000 ± 2,000 contiguous square feet and a concrete unit at 20 ± 8 contiguous slabs, figures unchanged since the 1998 edition. The 2,500 ± 1,000 sq ft that also circulates for asphalt is the D6433 figure for roads and parking lots, so a source quoting it for a runway has mixed up the two standards. The principle does not vary. A sample unit has an identity, so the next survey inspects the same ground rather than a fresh guess at where to look.
Not every unit gets walked. The method allows statistical sampling within a section, sized to give stated confidence in the section value rather than a census. That trades completeness for cost, worth remembering when a PCI is quoted to two significant figures.
Within a unit, the rater records three things for every distress found: what it is, how severe it is on a low, medium or high scale, and how much of it there is. Severity criteria are distress-specific and not all the same kind of quantity. Severity for longitudinal cracking is a crack width band. Severity for rutting is a depth. Severity for joint spalling is a broken edge dimension. That variety is why a survey needs a trained rater rather than a checklist, and why imagery does better on some distresses than others.
The deduct value step, in plain language
Each recorded distress is converted to a density, its quantity divided by the area of the sample unit. Density and severity together are looked up on a deduct curve for that distress type, and out comes a deduct value: points to be taken off a perfect 100.
The obvious next move is to add the deduct values up and subtract. The method does not, for a good reason. Distresses overlap in what they tell you. A pavement already alligator-cracked in the wheel path is not twice as bad for also being rutted there, because both report the same underlying failure. Straight addition would over-penalise, and on a badly distressed unit it would run past 100 and produce a negative index.
So the standard corrects. Count the deduct values above 5 and call that q. Sum all of them into a total deduct value. Read a corrected deduct value off a curve chosen by q. Then iterate: take the smallest deduct value still above 5, set it to 5, reduce q by one, read again. Keep the largest corrected value any iteration produced. The PCI for that unit is 100 minus that value, and section PCI is the average across the units inspected.
Two consequences follow, and both surprise people. The index is not additive, so a unit whose deduct values sum to 54 does not score 46, it scores higher. And the scale is not linear in distress: PCI 90 to 80 takes far less new damage than 40 to 30. A five point gap between sections is a real difference in condition, but it is not five percent of anything.
The rating scale
The 0 to 100 range is conventionally read in seven bands. AC 150/5380-7B prints its version under the caption “Example PCI Rating Scales for Airfield Pavements”. The bands are shared vocabulary, not a regulatory tariff.
| PCI | Band | What the surface looks like | Typical response |
|---|---|---|---|
| 86–100 | Good | No distress, or isolated and minor | Routine maintenance, crack sealing |
| 71–85 | Satisfactory | Minor distress visible, structure unaffected | Preventive maintenance, surface treatment |
| 56–70 | Fair | Moderate deterioration, some structural loss | Rehabilitation planning begins |
| 41–55 | Poor | Significant deterioration, capacity reduced | Major rehabilitation, structural overlay |
| 26–40 | Very Poor | Severe and extensive distress | Heavy rehabilitation or thick overlay |
| 11–25 | Serious | Extreme deterioration, barely serviceable | Reconstruction design |
| 0–10 | Failed | Complete failure | Full reconstruction |
You will often hear PCI 70 quoted as the overlay trigger for a runway and PCI 55 as where reconstruction enters the conversation. Those are FAA-typical practice and a common default in pavement management software. They are not written into AC 150/5380-7B as a requirement, and no numeric PCI threshold appears in its text.
What the circular does set is cadence, in the direction people usually get backwards. Federally obligated airports must perform a detailed inspection of airfield pavements at least once a year. If a PCI survey is performed as set forth in ASTM D5340, the circular states that the frequency of those detailed inspections may be extended to three years. A proper PCI survey buys a longer interval, it does not add an obligation. One to three years by traffic intensity and pavement age, tightening to annual below PCI 70, is the working pattern.
What the number is good for, and what it cannot answer
| Question | PCI | What actually answers it |
|---|---|---|
| Which sections are worse than which? | ✓ | The index, directly |
| Is this section deteriorating faster than the last cycle? | ✓ | PCI trend across surveys with a consistent method |
| How much rehabilitation budget do we need over five years? | ✓ | Trended PCI in a pavement management programme |
| Can this pavement take a heavier aircraft? | ✗ | Pavement strength reporting, deflection testing |
| How many years of service remain? | ✗ | Pavement design life analysis, non-destructive testing |
| Is there moisture or a void under the slab? | ✗ | Ground-penetrating radar, coring |
| How rough is it, and how much friction is there? | ✗ | Roughness and friction measurement, excluded by D5340 |
| Is the surface contaminated right now? | ✗ | Runway condition assessment under the ICAO Global Reporting Format |
That last row is a vocabulary collision worth naming once. A runway condition assessment reports contaminants, water, snow, slush and ice, on the surface right now, for the flight crew. It shares no machinery with PCI and expires within hours.
Deriving PCI from imagery
D5340 is already a visual method. Nobody cores a runway to compute a PCI. Imagery is therefore not a change of category, only of vantage point and of who does the classification. Four gaps stay real.
Some severity criteria are not visual. A crack width band survives a camera if the ground sample distance supports it. A rut depth needs a reconstructed surface. Whether a sealant is still bonded to the crack face is tactile, and no sensor recovers it.
The rater is part of the method. D5340 assumes a trained person applying the distress catalogue. A detection model is not that person, however well it performs, and a report implying otherwise is overclaiming.
The sampling logic inverts. A scan covers the whole surface rather than a statistically chosen subset. More coverage is better information, but a full-coverage number is not the statistic the standard’s sampling clause describes, so it should not be presented as the same figure.
Detectors over-call familiar things. Rubber deposits, tining, shadow across a joint and old sealant all read as distress until a model has been checked against that pavement.
So we publish a PCI proxy , a condition grade with its inputs and its limits written down, rather than a certified index. It is repeatable, georeferenced so this year compares against last year on the same ground, and cheap enough to run often. Its job is to tell a certified survey where to spend its hours, and to catch a section that slips between those surveys.
Our runway surface scan is built around that division of labour, and it comes off the same visit as the lights and the approach, which is the argument we made in what a PAPI inspection actually costs .
PCI is a well-built, honest, deliberately narrow instrument. It ranks surfaces, tracks them over time, and turns a walk-around into a budget line. Ask it about strength, about what is under the slab, or about the runway right now, and it will not answer, because it was never built to.
Founded by flight-inspection veterans who spent decades measuring PAPI lights for aviation authorities across Europe.
Learn more
Related terms
03 TERMSASTM D5340
ASTM D5340 is the definitive standard for conducting Pavement Condition Index (PCI) surveys on airport pavements. It defines 17 asphalt and 16 concrete distress types, including the airfield-specific jet blast erosion and oil spillage, with inspection units of 20±8 PCC slabs or 5000±2000 ft² AC areas. Used by FAA PAVEAIR per AC 150/5380-7B for federally obligated airport pavement management.
Pavement Condition Index (PCI), ASTM D5340 and D6433
The Pavement Condition Index (PCI) is a numerical indicator from 0 (failed) to 100 (excellent) that rates pavement surface condition based on observed distress type, severity, and extent, per ASTM D5340 for airports and ASTM D6433 for roads. Developed by the US Army Corps of Engineers for military airfields and later extended to roads, it is referenced by ICAO Doc 9157 and FAA AC 150/5380. Covers…
ASTM D6433
ASTM D6433-20 defines the Pavement Condition Index (PCI) methodology for roads and parking lots, establishing inspection unit definition, distress identification, severity/quantity measurement, deduct value curves, and PCI calculation. It is the foundation for pavement condition assessment. Covers the full ASTM D6433 methodology, distress types by pavement type, and how TarmacView's visual proxy…
Further reading
03 ARTICLES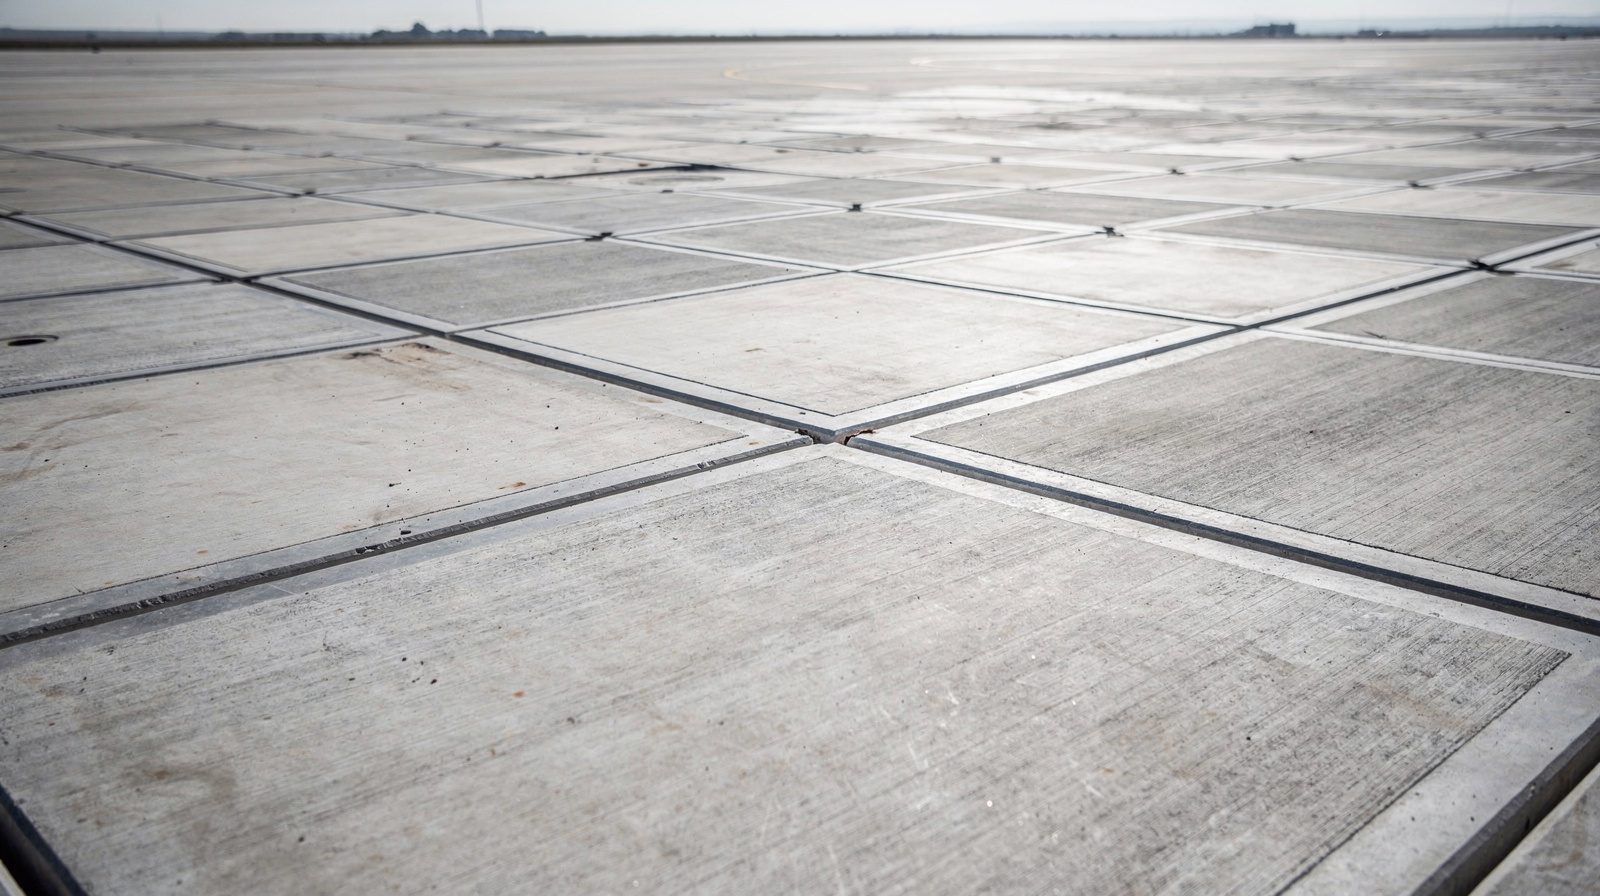
Pavement Strength: ACN-PCN and What a Survey Can Tell You
Surface condition and structural strength are different properties. What a PCN code reports, how the number is determined, and where a survey…
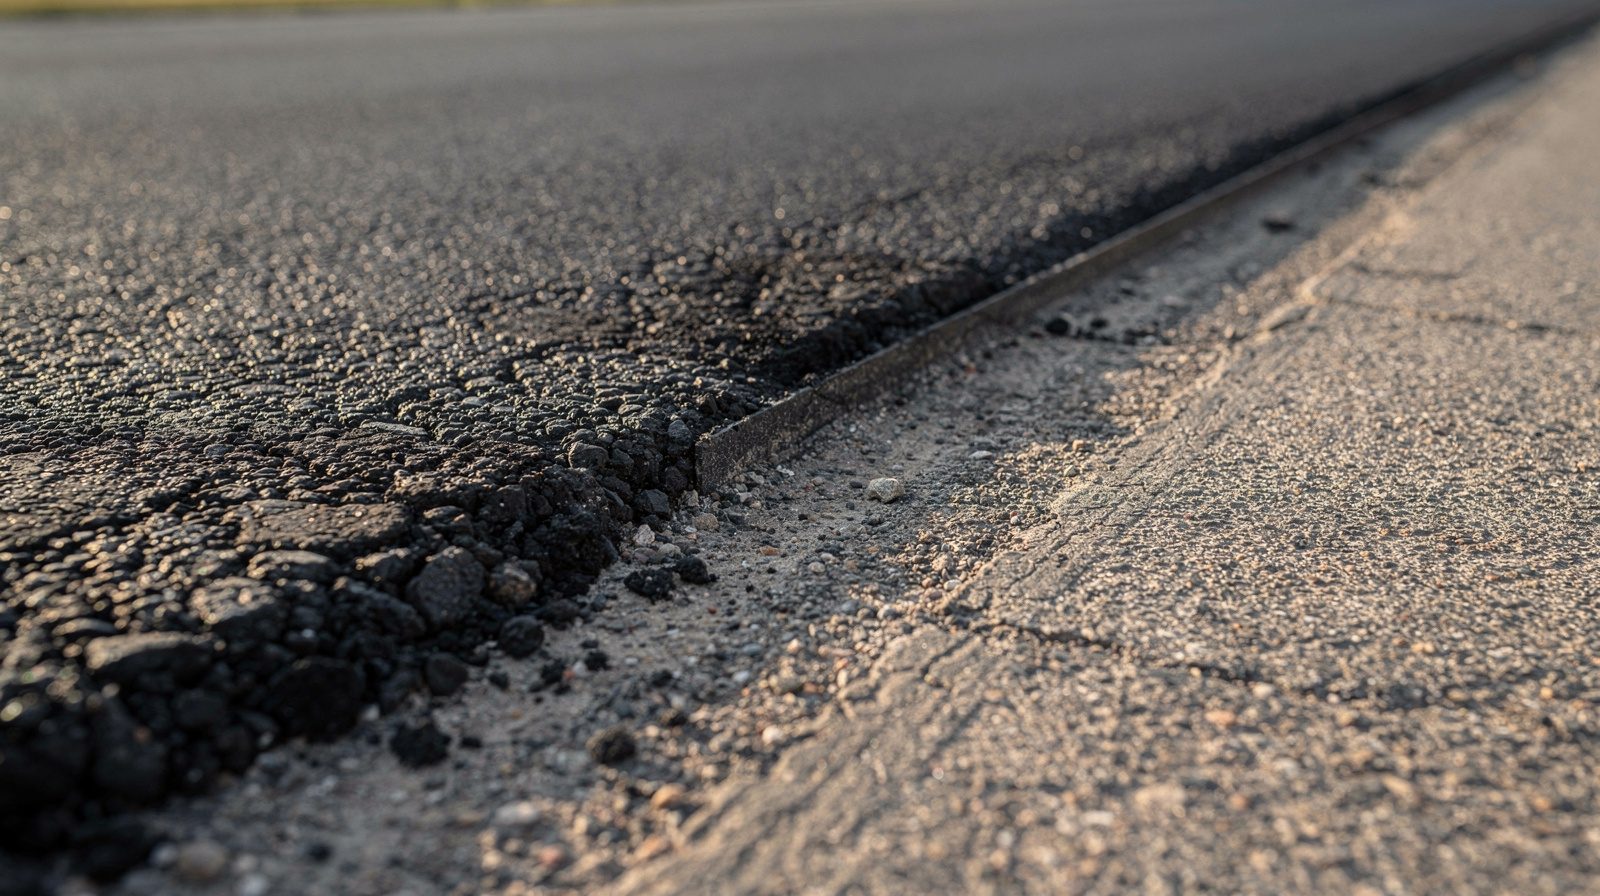
Pavement Design Life and When an Overlay Is Due
Why a single survey cannot drive an overlay decision, and why a trend across years tells you the deterioration rate that actually matters.
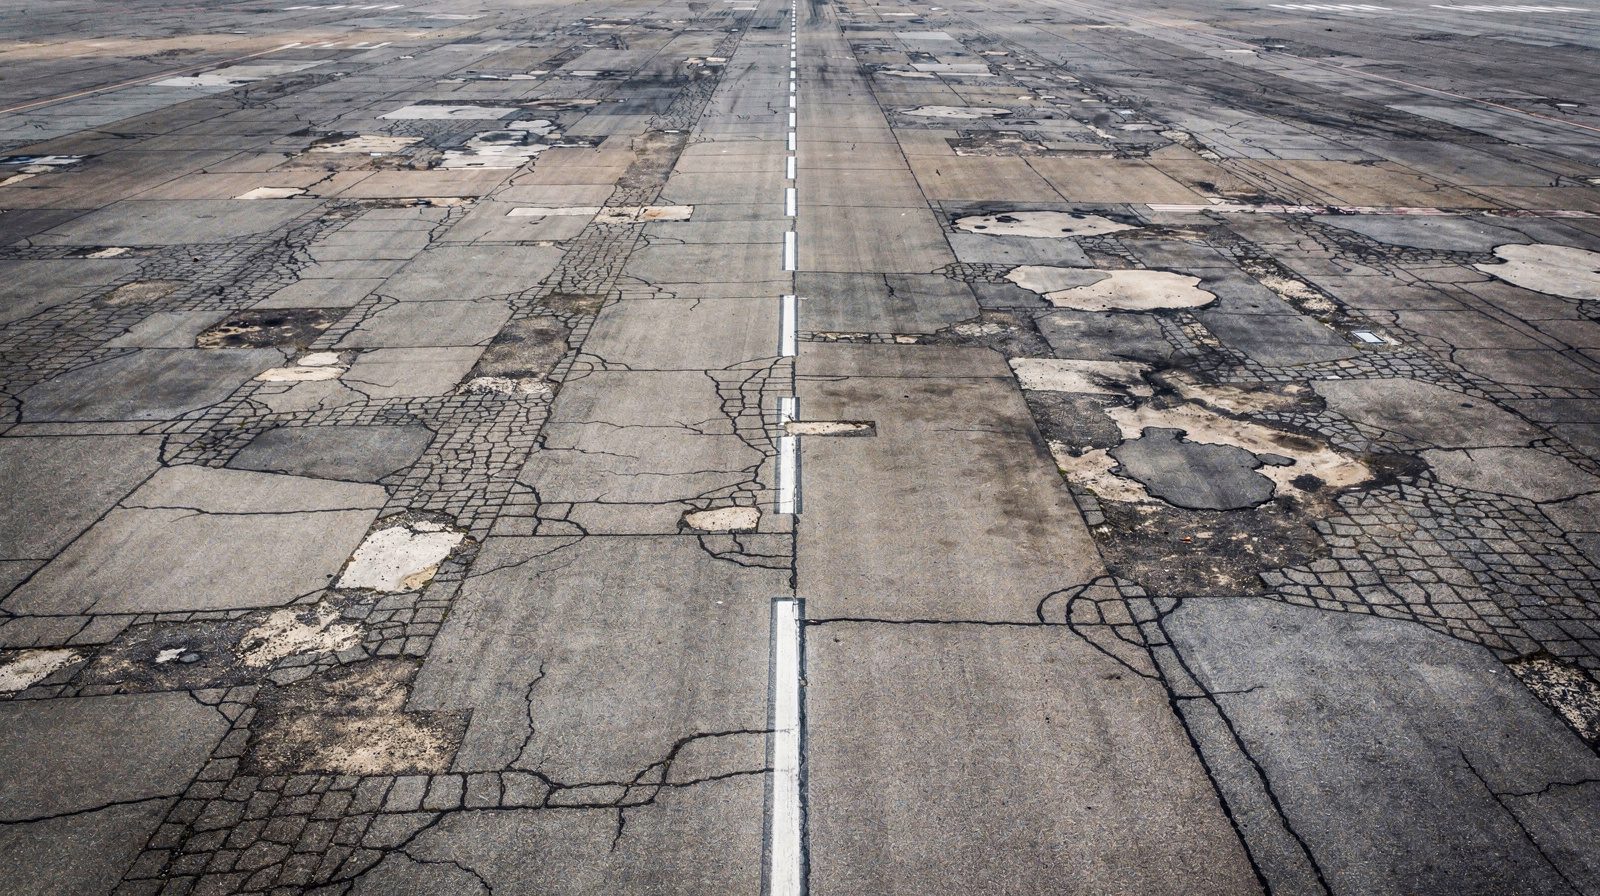
Runway Surface Inspection: What a Drone Scan Actually Sees
What a drone pavement scan resolves on a runway, what it cannot, how ground sample distance sets the smallest measurable crack, and how a scan becomes…